
Bonds & Interest Rates
In the US, economic data remain mixed. We expect the Fed to remain cautious – this has just been emphasized once again by Mrs. Yellen in her testimony -, but a slowdown of purchases in December is not to be ruled out. The first rate hike is likely in mid-2015 and our Treasury yield forecast remains unchanged.
The ISM manufacturing and non-manufacturing index remain close to post-crisis highs, pointing to higher growth, and employment is again increasing faster (190K non-farm payrolls added per month in the mean). In contrast, consumer confidence deteriorated and leading indicators for the housing market such as pending home sales declined as a consequence of yield increases over the summer (higher mortgage rates weigh on the housing market). The unemployment rate has declined partly due to the fact that discouraged workers are no longer looking for jobs; the participation rate is now as low as in 1978.
In the Eurozone, inflation declined significantly more than expected, to 0.7%. The unemployment rate was revised upwards and the stabilization seen so far seems less certain, which is dampening wage and price developments.
Inflation is especially low in peripheral countries, where the economy and the labor market are weak and wages are declining. At the same time, financing costs for SMEs and households in Italy and Spain remain high, which might be related to ongoing high financing and capital costs for banks there. Mr. Draghi said, ‘by enhancing transparency and incentive compatibility, [the banking union] will help Europe return to a situation in which investment decisions will be based on business prospects, not on geographical location’. It remains to be hoped that the AQR can improve financial fragmentation in the euro area so as to enhance growth perspectives and prevent the deflationary risks that might otherwise emerge.
Whole Report HERE

-
I’m becoming increasingly concerned by emails that I’m receiving from amateur investors. These emails tout a fabulous future for the American stock market. Many stock buybacks have occurred, but actual earnings growth for American companies is highly questionable.
-
“I am very cautious on equities today. This market could easily have a big drop…. Very simplistically put, a lot of the earnings are a mirage.” – Reuters News, November 18, 2013.
-
That’s legendary activist investor Carl Icahn, speaking at the Reuters Global Investment Outlook Summit.
-
He doesn’t sound very enthusiastic, and nor do other powerful money managers who control enormous amounts of risk capital. “U.S. stocks are grossly overpriced, according to asset management firm Grantham Mayo Van Otterloo (GMO) & Company, which estimates fair value for the S&P 500 Index at 1,100 – or almost 40 percent below current levels. In a quarterly letter published on Monday, Ben Inker, co-head of global asset allocation at GMO said the expected rate of return on the stock market index is minus 1.3 percent per year, adjusted for inflation, for the next seven years.” – CNBC News, November 19, 2013.
-
If gigantic funds like GMO (with over $100 billion under management) see the American stock market as “grossly overpriced”, while amateur investors are touting the market as a “fabulous bargain, with gains that are here to stay”, I would urge gold community investors to exerciseextreme caution.
-
Investors who are selling gold stocks now, and buying general stock market equities on American stock markets, may soon find they become part of one of the biggest “out of the fry pan and into the fire” horror shows in history.
-
I expect the Fed to taper their quantitative easing (QE) program in 2014, and perhaps in December of this year. If the Fed tapers in December, many institutional money managers are likely to quickly move a lot of capital from the stock market to bonds.
-
If there is no taper in 2014, the reason is likely to be that the American stock market has crashed. If the stock market crashes, it’s possible that the Fed increases QE.
-
The bottom line is that whether the Fed increases QE, tapers, or does nothing, the American stock market is at great risk, because value-oriented fund managers are pulling out. Stocks that were held by the strongest hands are now held by what appear to be very weak hands.
-
It’s possible to make money in an asset class with “momentum investing” (price chasing), but it’s extremely difficult, and arguably impossible, to keep that money. Most of the world’s greatest investors are value-oriented.
-
Gold stock investors who want “action” should probably look at the Chinese stock market, which is far below its all-time highs.
-
“China has pledged to make the most sweeping changes to the economy and the country’s social fabric in nearly three decades with a 60-point reform plan that may start showing results within weeks.” – China Daily News, November 18, 2013.
-
Please click here now. You are viewing a daily chart for FXI-NYSE. I call it the “Chinese Dow”. Institutions are buying Chinese stocks aggressively, and volume is enormous.
-
Please click here now. That’s a longer term look at FXI, using the weekly chart. Technically, it’s on the verge of a major breakout from a symmetrical triangle formation.
-
The Chinese stock market is now about 37% below its 2007 highs. Reforms there should increase urbanization, and increase the standard of living for most Chinese citizens.
-
As Chinese citizens get more disposable income, including capital gains from the stock market, they are likely to dramatically increase the amount of gold jewellery they buy. That’s very good news for gold mining companies.
-
Janet Yellen recently told US congress that she doesn’t know much about gold, except that people buy it when they are afraid. Please click here now. Does this Chinese lady look like she’s afraid? Most of the gold that is mined by Western mining companies is bought in the form of jewellery, by the citizens of China and India. They don’t buy it because they are afraid. With all due respect to Janet Yellen, I think she may need to ask the Bombay Bullion Association for a pamphlet on the basics of gold market supply and demand.
-
On that note, please click here now. I showed you this table of gold demand about a week ago, courtesy of usdebtclock.org. It shows that whether gold buyers are afraid or ecstatic when they buy gold really doesn’t matter. What matters is how much gold they buy. Unfortunately, you can see that compared to China and India, Americans don’t buy very much gold at all, even when they are afraid.
-
Please click here now. That’s a freshly updated table of gold demand. You can see that according to the usdebtclock.org people, American demand has fallen over the past week. In contrast, Chinese and Indian jewellery demand continues to grow.
-
American economic events like the jobs report and QE announcements are powerful short term drivers of the gold price. In the big picture, it is the enormous growth in demand for gold jewellery that will drive the gold price vastly higher. Ironically, the American super-crisis caused terrified Western investors to buy gold and gold stocks, but it will be the ecstatic Chindian (Chinese and Indian) jewellery buyer that makes them richer.
-
Please click here now. You are viewing the daily T-bond chart. In the short term, “where goes the T-bond, so goes gold”. Look at the stokeillator oscillator at the bottom of the chart. It looks spectacular, and there’s an upside breakout in play from the thin black supply line. I realize that many analysts are talking about a coming crash in the gold market, but powerful value investors are pulling a lot of money out of the stock market and pouring it into bonds. That’s bullish for gold.
-
Please click here now. That’s the daily gold chart. Gold feels “soft” right now, because the Indian government has imposed draconian gold import rules. Given the fact that Indian imports have dropped from about 100 tons a month to 20 tons a month, gold is remarkably strong. From a technical standpoint, gold is “hanging around” the thick green line of a large symmetrical triangle, but the action in the bond market seems to be supporting gold nicely. The stokeillator suggests a substantial rally should begin soon.
-
What about silver? Please click here now. Some silver bears see a head and shoulders top pattern in play. I think it’s more of a shape than an actual price pattern, and Indian silver demand has surged. Silver can’t replace gold in India, but it can serve as a kind of “stop gap” measure. A move to $23.10 should ignite bullish reports from technical analysts at major banks.
-
Please click here now. You are viewing the daily chart for GDX. The stokeillator looks decent. I haven’t drawn any trend lines on this chart, because I think this is a time where they don’t work. When a major asset class makes a bottom, huge numbers of analysts struggle to identify the turning point. Whipsaw price action can be very frustrating to both bulls and bears. Rather than focusing on QE “taper caper” action, my suggestion is to contact the directors of mining companies and ask them what they are doing to prepare for the accelerating growth of the Chindian middle class. Or should I say, the growth of the Chindian gold buyer class!
Special Offer Website Readers: Uranium has been on a bit of a tear recently. Please send me an Email to freereports4@gracelandupdates.com and I’ll send you my free “Radioactive Hot!” report on uranium stocks that may be poised to move.
Thanks!
Cheers
St
Note: We are privacy oriented. We accept cheques. And credit cards thru PayPal only on our website. For your protection. We don’t see your credit card information. Only PayPal does. They pay us. Minus their fee. PayPal is a highly reputable company. Owned by Ebay. With about 160 million accounts worldwide.
Written between 4am-7am. 5-6 issues per week. Emailed at aprox 9am daily.
Email: stewart@gracelandupdates.com
Rate Sheet (us funds):
Lifetime: $799
2yr: $269 (over 500 issues)
1yr: $169 (over 250 issues)
6 mths: $99 (over 125 issues)
To pay by cheque, make cheque payable to “Stewart Thomson”
Mail to:
Stewart Thomson / 1276 Lakeview Drive / Oakville, Ontario L6H 2M8 Canada
Stewart Thomson is a retired Merrill Lynch broker. Stewart writes the Graceland Updates daily between 4am-7am. They are sent out around 8am-9am. The newsletter is attractively priced and the format is a unique numbered point form. Giving clarity of each point and saving valuable reading time.
Risks, Disclaimers, Legal
Stewart Thomson is no longer an investment advisor. The information provided by Stewart and Graceland Updates is for general information purposes only. Before taking any action on any investment, it is imperative that you consult with multiple properly licensed, experienced and qualifed investment advisors and get numerous opinions before taking any action. Your minimum risk on any investment in the world is: 100% loss of all your money. You may be taking or preparing to take leveraged positions in investments and not know it, exposing yourself to unlimited risks. This is highly concerning if you are an investor in any derivatives products. There is an approx $700 trillion OTC Derivatives Iceberg with a tiny portion written off officially. The bottom line:
Are You Prepared?

 …depends on your definition of reform I guess.
“The political object is the goal, war is the means of reaching it, and the means can never be considered in isolation from their purposes.” – Carl von Clausewitz
It is interesting watching the PR machine inside and the dupes in the financial press outside of China spin the Third Plenary Session. “Gee, it is momentous market reform and the markets are reacting positively to this great news,” seems the spin.
This is an example of what I am talking about, from Caijing.com:
“Many contend that the reform path of ‘comprehensively deepening reform’ identified during the Third Plenum, which constitutes a continuation of the spirit of reform that dates back to the 1980s, will strengthen China’s market economy system, transcend economic reform, and promote the overall development of China’s future.”
Say what?
It seems the primary goal was…

Yes Mrs. Yellen, QE Is Creating An Asset Bubble
Much to the consternation of those who continue to insist that we are not in a bubble it is my opinion that we are in a bubble at the moment and one that is being blown ever larger by investors who want to believe that the money machine will continue to spew forth profits and the risk of malfunction is extremely low. There can be no question that my views that QE has failed and that we are now at the upper end of a cyclical bull market within a secular bear market are not popular views. Those who believe in the efficacy of QE are very quick to point out that my views are – at this point – utterly useless as I have been wrong for the entirety of the year.
Just to set the record straight on that point here is what I said back in January:
My best case scenario for 2013 is a range basis the S&P of 1600 on the high side and 1260 – the 2012 lows – as the low side.
I missed the high by at least 12% – not a particularly good call to say the least. I of course am not alone in my views that we remain in a secular bear market nor am I alone in my call on when we will start the next cyclical bear market – both in the sense of timing and magnitude. It will of course do that – enter a new cyclical bear market that is – as it always does. Furthermore, when the market gets stretched to far in one direction it tends to overshoot in the opposite direction.
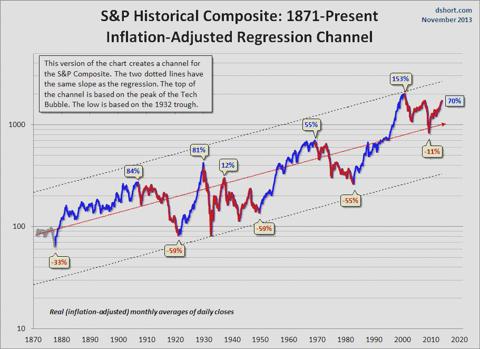
Doug Short’s chart below makes note of the fact that even though the dotcom bubble – at it’s peak – was the beginning of the current secular bear market – the market sell off in 2000 fell well short of what was seen in previous secular bear markets. In fact the 2000 market sell off didn’t even bring the market back to the regression trend line. The 2008 sell off did push the market slightly below the line – 11% to be precise – but even this sell off fell well short of all previous pull backs.
(click to enlarge & view the whole article with 13 charts)

The gold situation is something that has got everyone rather keen and this is how it has been for quite some time. If you’re to take a closer look at the current scenario, then you’ll realize that gold isn’t really glittering as much as it did last week. This precious metal is known to hog the limelight and that too for obvious reasons. Even a week ago, gold actually rallied sharply in the wake of the decision by the Federal Reserve policy-makers who wish to maintain the stimulus program in an intact form and it has actually helped support the economy for the whole of last year.
However, the gains were short lived as far as Tuesday morning is concerned. Gold trading stood at just above 1,315 dollars an ounce which is down from the recent high of 1,375.30 dollars an ounce. This is obviously a major dent and yes it hurts investors.
Actually the gold market and its volatility serves as a constant reminder of how odd an asset gold is. It’s a known fact that gold is one of those things that people have turned to since the beginning of time itself. Undoubtedly there are numerous advantages when it comes to gold. It’s not just so very portable due to the fact that it’s lightweight, but also the fact that it never spoils over time. The best part supposedly is the fact that you won’t even see it getting tarnished.
No matter what, it still remains a fact this 2013 that gold is absolutely unlike any other commodity in which people can go ahead and invest. Actually gold is a pretty tricky thing to analyze in terms of wealth. This is because of the simple fact that gold doesn’t serve any so-called “fundamental” purpose. Now it’s true that gold is used to craft jewelry items, but fact remains that it’s not a fundamental one for jewelry is simply a decorative form of gold coins and bars. The purpose served by jewelry is also the same – that of preserving wealth.
All of this put together makes gold rather tricky to analyze in terms of an investment deal. There are quite a few noted investors who’re of the opinion that gold isn’t even an investment like stocks and bonds for that matter. Now then it all boils down to one simple question that why should you own gold at all? More than this being a fact, it has become an emotion of sorts. In fact, even with time having reached the 2013 year, the gold investmentbit is still associated with the emotional connect and how exactly one feels about this entire thing.
Now, one of the major reasons that investors took to gold so ardently last week was essentially because of the fact that most were of the view that the US dollar was likely to weaken against other major currencies provided the interest remained low. Inflation is definitely another factor that fuelled the demand for gold.
Lorena is a professional writer. She has been associated with some leading related websites as an author. To know more about this page please visit.


-
I know Mike is a very solid investor and respect his opinions very much. So if he says pay attention to this or that - I will.
~ Dale G.
-
I've started managing my own investments so view Michael's site as a one-stop shop from which to get information and perspectives.
~ Dave E.
-
Michael offers easy reading, honest, common sense information that anyone can use in a practical manner.
~ der_al.
-
A sane voice in a scrambled investment world.
~ Ed R.
Inside Edge Pro Contributors

Greg Weldon

Josef Schachter

Tyler Bollhorn

Ryan Irvine

Paul Beattie

Martin Straith

Patrick Ceresna

Mark Leibovit

James Thorne

Victor Adair