Yes Mrs. Yellen, QE Is Creating An Asset Bubble
Much to the consternation of those who continue to insist that we are not in a bubble it is my opinion that we are in a bubble at the moment and one that is being blown ever larger by investors who want to believe that the money machine will continue to spew forth profits and the risk of malfunction is extremely low. There can be no question that my views that QE has failed and that we are now at the upper end of a cyclical bull market within a secular bear market are not popular views. Those who believe in the efficacy of QE are very quick to point out that my views are – at this point – utterly useless as I have been wrong for the entirety of the year.
Just to set the record straight on that point here is what I said back in January:
My best case scenario for 2013 is a range basis the S&P of 1600 on the high side and 1260 – the 2012 lows – as the low side.
I missed the high by at least 12% – not a particularly good call to say the least. I of course am not alone in my views that we remain in a secular bear market nor am I alone in my call on when we will start the next cyclical bear market – both in the sense of timing and magnitude. It will of course do that – enter a new cyclical bear market that is – as it always does. Furthermore, when the market gets stretched to far in one direction it tends to overshoot in the opposite direction.
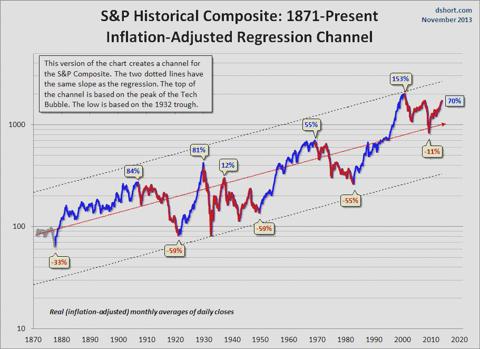
Doug Short’s chart below makes note of the fact that even though the dotcom bubble – at it’s peak – was the beginning of the current secular bear market – the market sell off in 2000 fell well short of what was seen in previous secular bear markets. In fact the 2000 market sell off didn’t even bring the market back to the regression trend line. The 2008 sell off did push the market slightly below the line – 11% to be precise – but even this sell off fell well short of all previous pull backs.
(click to enlarge & view the whole article with 13 charts)