
Stocks & Equities
(Reuters) – Stocks rose on Friday, with the S&P 500 closing above 1,800 for the first time and healthcare names leading the way higher.
The Dow industrials ended at another record high above 16,000.
Both the Dow and the S&P 500 recorded their seventh straight week of gains in what has been a very strong year for stocks. The seven-week advance comes just ahead of December, which since 1950 has been the best month for both the Dow and the S&P.
“We’re advising our clients to take this ride until the end of the year,” said Drew Nordlicht, managing director and partner at Hightower San Diego.
The Nasdaq Biotech Index .NBI jumped 3 percent, driven by a surge in Biogen Idec (BIIB.O).
Shares of Biogen shot up 13.2 percent on heavy volume to $285.62 after the company won 10 years of exclusivity protection for its multiple sclerosis drug, Tecfidera, from regulators in Europe.
“Healthcare is the place to be. It’s a hot area. People want stocks in healthcare, industrials and consumer discretionary. That’s where tactical investors have been focused, and that’s where the money has been flowing,” said Michael Matousek, head trader at U.S. Global Investors Inc, in San Antonio, Texas.
European regulators also recommended approval of a new drug for hepatitis C from Gilead Sciences (GILD.O), which pushed its shares up 3.7 percent to $74.27.
The S&P 500 healthcare sector index .SPXHC has gained 37.5 percent so far in 2013, making it the S&P 500’s best-performing sector this year.
Such moves give investors who have enjoyed some of the 26.5 percent surge in the S&P 500 this year an opportunity to reduce their positions ahead of an eventual market correction.
The CBOE Volatility Index .VIX fell 3.2 percent to close at 12.86.
With volatility low and the price of options cheap, “you can lighten your stock position, but replace it with a derivative. This way, if the market were to tank, you would lose a lot less on the derivative than you would lose on the stock,” Matousek said.
The Dow Jones industrial average .DJI rose 54.78 points, or 0.34 percent, to end at a record 16,064.77. The Standard & Poor’s 500 Index .SPX gained 8.91 points, or 0.50 percent, to finish at 1,804.76. The Nasdaq Composite Index .IXIC climbed 22.50 points, or 0.57 percent, to close at 3,991.65.
Dennis Lockhart, president of the Federal Reserve Bank of Atlanta, said on CNBC that reducing the pace of the central bank’s bond-buying program will be on the table at its December policy meeting. He added that monetary policy is likely to be very accommodative for some time.
“In the meantime, $85 billion a month keeps swirling into investor hands, and some of that finds its way out into the financial markets, including the stock market,” said Fred Dickson, chief market strategist at D.A. Davidson & Co., in Lake Oswego, Oregon.
Intel (INTC.O) fell 5.4 percent to $23.87 and was the biggest drag on the S&P 500 after analysts questioned whether the chipmaker can get higher-margin chips into tablets and smartphones, which are eroding sales of traditional PCs.

 European equities are poised to outperform the U.S. market, Marc Faber of the Bloom Gloom & Doom Report says.

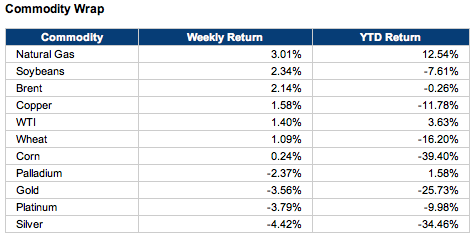
….Oil & Gas Spike
Energy outperformed, while precious metals underperformed.
Precious metals plunged, but other commodities rose this week on the back of strong economic data. Stocks, as measured by the S&P 500, edged up fractionally. The stock index was last trading close to record highs above 1,800—up 26.3 percent since the start of the year.
Macroeconomic Highlights
On Wednesday, the Fed released the minutes to the Oct. 30 FOMC meeting, which indicated that the central bank could taper its quantitative-easing program in the coming months.
According to the Fed minutes, “if economic conditions warranted, the Committee could decide to slow the pace of purchases at one of its next few meetings.”
Of course, that’s not necessarily surprising—market participants have been expecting the Fed to scale back its purchases. The only question is whether it happens at the December meeting or at another meeting early next year. That still remains unclear.
Meanwhile, strong economic data also lent credence to the view that the Fed could take action soon. The U.S. Census Bureau reported that retail sales in October rose by 0.4 percent, much better than the 0.1 percent increase that was expected.
At the same time, the Department of Labor said that the number of people filing for unemployment benefits fell from 344K to 323K last week, also better than expected.
On the flip side, a mild inflation reading suggested that there was no urgency for the Fed to rein in stimulus. The Bureau of Labor Statistics said that the Consumer Price Index in the U.S. actually fell by 0.1 percent in October due to declining food and energy prices. Economists had expected no change. Core prices (excluding food and energy) grew by 0.1 percent, as expected. On a year-over-year basis, the headline and core CPIs were up by 1 percent and 1.7 percent, respectively.
Finally, in housing news, the National Association of Realtors said that existing home sales slipped from 5.29 million to 5.12 million units annualized in October.
….much more HERE
 Great forces are at work in the the US. Forces that are holding back its economy.
Canada’s economy is affected enormously by the United States’s so Michael identifies those forces and clarifies how they are so highly likely going to affect our own economy going forward…..
{mp3}business_comment_podcast_nov22fp{/mp3}
To read “Michael Campbell’s Money Talks” Facebook page go HERE
 Before we get started with this week’s news please take a few moments to read our latest presentation on the future of the energy sector: 5 new energy booms every investor should see right now
Ukraine was set to sign a landmark trade association agreements with the European Union on 29 November, much to the dismay of Moscow, but the deal is now officially dead according to reports coming out of Kiev.
Ukrainian Deputy Prime Minister Yuriy Boyko announced today that Kiev has suspended its preparations for the signing of the EU-Ukraine Association Agreement until a “solution” can be found. Internal politics aside, at issue are industrial production decline and relations with the countries of the Commonwealth of Independent States (CIS)—both of which would need to be compensated by the European market.
One of the EU’s key conditions for the signing of the agreement was the release of Yulia Tymoshenko—at least to travel to Germany for medical treatment. Yesterday, Ukraine’s parliament rejected draft laws that would have allowed this to happen. Opposition leader and former prime minister Tymoshenko is a staunch opponent of Ukrainian President Viktor Yanukovych. She is serving a seven-year sentence in prison on abuse of office charges.
In the meantime, there has been a flurry of activity between Moscow and Kiev, including a Ukrainian pledge to readjust the payment schedule for Russian natural gas imports and address overdue payments to Moscow. Officials in Kiev are now saying they will pay $1 billion in overdue gas payments by the end of this year. Only last week, Ukraine had said it was suspending gas purchases from Russia and would instead rely on its own storage facilities, but it quickly backtracked on that.
Quite simply, there is just too much domestic political and geopolitical baggage attached to the EU-Ukraine deal, and according to Robert Bensh, senior energy advisor to Boyko and senior consultant for Cub Energy, the timing isn’t quite right.
Perhaps five years from now the climate will be more favorable for a deal and until then Ukraine will have to continue to balance relations with the EU and Russia.
Back in North America, it’s a busy week in energy as we head into the winter holidays, which promise to leave a lot of loose ends to tie off in the New Year, among them the five-year-pending approval of the controversial Keystone XL project and over 20 applications for exporting US natural gas to countries that don’t have Free Trade Agreements (FTAs) with the US.
This week has been a rather disappointing one for Keystone XL and LNG exporter-hopefuls.
First, the Freeport LNG export project in Texas saw its capacity hopes dashed by a Department of Energy (DOE) conditional approval of only 400,000 Mcf/d in LNG exports—a far cry from the 1 Bcf/d the company had asked for based on capacity and future expansion plans.
At the same time, it looks like one other project—at most—will be approved by the DOE before the end of the year, based on the approximately one month it has taken for each of the four LNG exports projects approved so far.
While some analysts were suggesting there would be a moratorium on further approvals this year, the DOE has stated that it is not suspending the approval process, but the process has been slowed because of October’s federal government shutdown.
The 16-day government shutdown “impacted our ability to move forward” on approving pending LNG export applications, Christopher Smith, DOE’s acting assistant secretary for fossil energy, said during his Senate Committee on Energy and Natural Resources nominationhearing.
Smith’s statement is more or a less a response to growing criticism from some senators that the DOW has been dragging its feet on LNG exports to non-FTA countries.
Then we have Keystone XL, the planned start-up of which has now been delayed for the second time this year, to 2016. It has become clear to TransCanada Corp. that its pipeline will not be getting approval this year, but the company remains hopeful that early 2014 will see the presidential green light. Once approval is granted, it will take at least two years for the pipeline to become operational.
In the meantime, though, the estimated costs of the project continue to climb along with the start-up delays. On Tuesday, TransCanada announced the new estimated costs of the project would be at least $5.4 billion–$100 million more than earlier estimates.
Colin Soares, CEO of Canada’s High North Resources, recently told us in an interview that Keystone XL isn’t as fundamentally important as it used to be because of huge increase in crude being transported by rail. “But from a market point of view, it’s still a big deal, and market valuations will increase with Keystone approval.”
Our analysis for readers this week comes from the Executive Report in Premium and takes a look at Egypt’s dying energy sector and the measures the interim military-backed government is trying to put things right—sort of. (The full report is below the introduction)
For those of you interested in Oilprice.com premium, we have a great letter lined up for subscribers. Dan Dicker our expert trader and legend in the oil markets takes a detailed look at the direction he believes oil prices will be heading in (This is a must read for ALL traders and analysts).
Our Opportunities letter take a look at a report recently put out by Ernst & Young which sounded a warning on the future of the E&P sector. Telling investors they need to beware of a silent killer that is stalking producers in some parts of the world. Places stock buyers should be looking at reducing their exposure. (if you have oil & gas investments in North America this is a must read report)
Our intelligence notes look at developing situations in Mozambique and Kenya and we issue our security risk rankings for East Africa.
This is another must read issue and you can do so completely free. We offer a 30 day free trial to readers in which time you will receive 30 reports that look at trading opportunities, unique investments, industry developments, geopolitical updates and much more. You can cancel at any time during these 30 days if you think our research isn’t for you.
You have no risk and need make no payment to try our premium service – we can’t be fairer than that. To find out more about how you can start a 30 day free trial – click here
That’s it from us this week.
I hope you enjoy the report below and have a great weekend.
Best regards,
James Stafford

-
I know Mike is a very solid investor and respect his opinions very much. So if he says pay attention to this or that - I will.
~ Dale G.
-
I've started managing my own investments so view Michael's site as a one-stop shop from which to get information and perspectives.
~ Dave E.
-
Michael offers easy reading, honest, common sense information that anyone can use in a practical manner.
~ der_al.
-
A sane voice in a scrambled investment world.
~ Ed R.
Inside Edge Pro Contributors

Greg Weldon

Josef Schachter

Tyler Bollhorn

Ryan Irvine

Paul Beattie

Martin Straith

Patrick Ceresna

Mark Leibovit

James Thorne

Victor Adair