
Timing & trends
The Bottom Line
Economic sensitive sectors with strong positive seasonality traits (e.g. Industrials, Consumer Discretionary, Technology and Materials) are leading equity markets on the upside. Preferred strategy is to accumulate equity markets and sectors with favourable seasonality on weakness in order to take advantage of the October 28th to May 5th period of strength.
Equity Trends
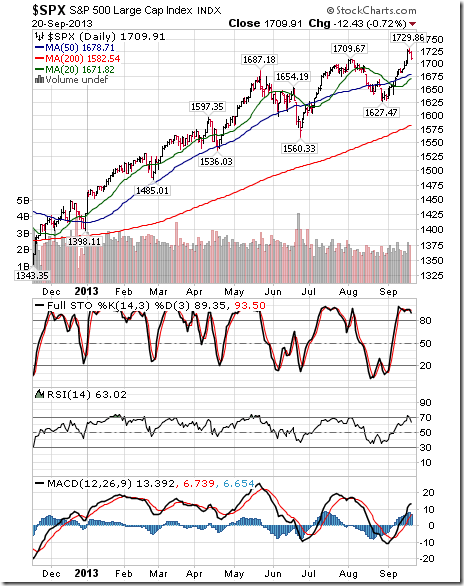
The S&P 500 Index added 6.58 points (0.37%) last week. Trend remains up. The Index closed at an all-time high. The Index remains above its 20, 50 and 200 day moving averages. Short term momentum indicators remain at overbought levels.
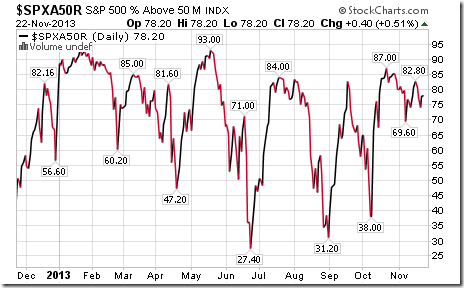
Percent of S&P 500 stocks trading above their 50 day moving average slipped last week to 78.20% from 82.80%. Percent remains overbought.
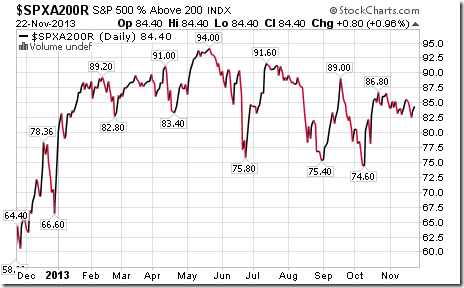
Percent of S&P 500 stocks trading above their 200 day moving average slipped last week to 84.40% from 85.60%. Percent remains intermediate overbought.
Bullish Percent Index for S&P 500 stocks increased last week to 83.80% from 83.40% and remained above its 15 day moving average. The Index remains intermediate overbought.
The TSX Composite Index slipped 4.23 points (0.03%) last week. Trend remains up (Score: 1.0). The Index remains above its 20 day moving average (Score: 1.0). Strength relative to the S&P 500 Index remains negative (Score: 0.0). Total score based on the above technical indicators remains at 2.0 out of 3.0. Short term momentum indicators remain overbought.
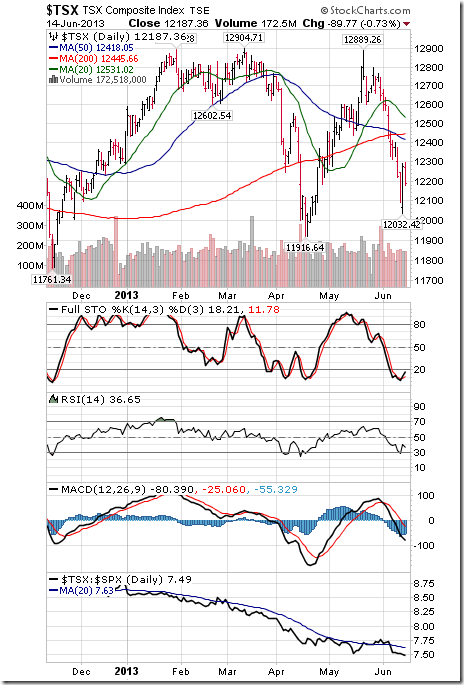
Percent of TSX Composite stocks trading above their 50 day moving average slipped last week to 58.58% from 62.76%. Percent remains intermediate overbought with a downward bias.
Percent of TSX Composite stocks trading above their 200 day moving average slipped last week to 56.90% from 57.74%.Percent remains intermediate overbought with a downtrend.
….read and so much more as 34 more charts & other issues are studied in this detail HERE

October Housing Starts to be released at 8:30 AM EST on Tuesday are expected to increase to 915,000 from 891,000 in August.
September Case/Shiller 20 City Home Price Index to be released at 9:00 AM EST on Tuesday is expected to increase 13.0% from 12.8% in August
November Consumer Confidence Index to be released at 10:00 AM EST on Tuesday is expected to increase to 72.4 from 71.2 in October.
Weekly Jobless Claims to be released at 8:30 AM EST on Wednesday are expected to increase to 330,000 from 323,000 last week
October Durable Goods Orders to be released at 8:30 AM EST on Wednesday are expected to fall 2.2% versus a gain of 3.8% in September. Excluding Transportation, October Durable Goods Orders are expected to increase 0.2% versus a decline of 0.2% in September
November Chicago PMI to be released at 9:45 AM EST on Wednesday is expected to fall to 58.0 from 65.9 in October
November Michigan Sentiment Index to be released at 9:55 AM EST on Wednesday is expected to increase to 73.0 from 72.0 in October
October Leading Economic Indicators to be released at 10:00 AM EST on Wednesday are expected to decline 0.1% from September versus a gain of 0.7% in September.
Earnings News This Week
Hewlett Packard and Tiffany on Tuesday

The Editor and Publisher of the Gloom, Boom & Doom Report expects US Federal Reserve to increase bond purchases. He also said that India could grow at around 7% if regulatory environment would improve.
THE FED SHOULD BE AUDITED
I dont value gold, I just weight it every year to see if its the same weight. I wish they would do that with the Federal Reserve, because nobody has audited these governments who claim they have that much gold. Maybe they dont have it, maybe they have lent it already.
 FABER SAYS PLATINUM IS MAYBE THE BEST PRECIOUS METAL
I stick to physical Gold largely, and I have some holdings in shares like Newmont, Freeport McMoran.
I think commodities, precious metals, will all move in the same direction. Some may move faster than others. Some say Silver is better than Gold, some sayPlatinum is the best. I tend to agree that maybe platinum is the best precious metal
FABER WARNS ABOUT MASSIVE CREDIT BUBBLE IN ASIA
Over the last Five years, everywhere in Asia, the household debt as a percentage of the economy has exploded higher, in other words a lot of growth was driven by unsustainable credit growth.
The household debt levels are relatively high, the asset prices are high, the affordability of buying homes has diminished and many countries have had currency weaknesses and their currency account surplus has turned to deficits. Some countries like India, Indonesia had to push up interest rates to support their currencies.
I’m not overly negative in the Asian regions but if a bubble bursts in China it would have a devastating impact on the surrounding countries.
I’m penning this column from my cabin on the Crystal Symphony where I’ve met with subscribers who joined us on the first Money and Markets cruise.
I’ll tell you more about it in my next issue, including details of the presentation I gave on the war cycles and what they show for 2014.
But, today, I want to get to the most urgent matter at hand, none other than gold.
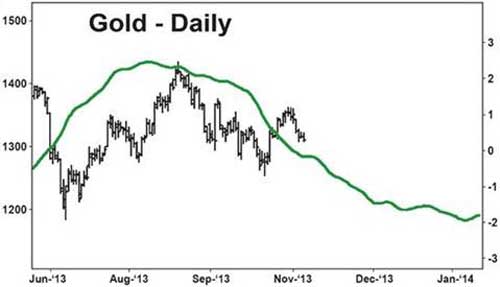
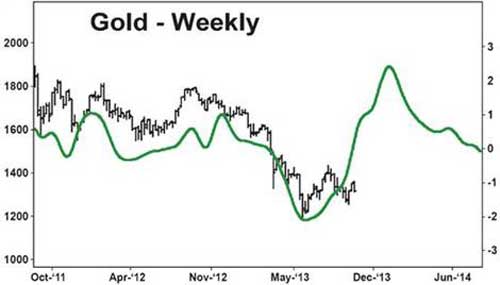
With gold now moving lower and breaking critical support at the $1,262 level, let me tell you exactly what’s happening:
First, the timeframe for a major low in gold runs until the end of January.
And now that it’s broken that $1,262 level, we are likely to see gold fall below the June low at $1,178, and then below $1,100. I suspect the final low will be somewhere between $990 and $1,035.
Second, the action we are seeing in gold of late is part and parcel of a major bottoming process. It’s swinging wildly. So are silver, platinum and palladium.
Important bottoms are characterized by:That volatility is important. Why? Because important bottoms in any market take time to develop. Unlike important tops, which occur suddenly, important bottoms are tricky.
 Important bottoms are characterized by:
- Increasing volatility
- False breakouts
- Sharp moves lower
- Wild swings overall, causing traders and investors to become impatient, frustrated, even hopeless
The key during this very important time period: Don’t let impatience or frustration cause you to take your eye off the prize. That’s what the market wants you to do.
But if you fall prey to the market’s antics at this time, when a major bottom is being formed, you will not be one of those who rides the next bull leg higher to glory.
Keep in mind that at important tops, a market will always do its best to trap you near the highs and make it hard for you to get out …
While at important market bottoms, a market will do everything in its power to prevent you from getting on board.
So, though gold has broken the $1,262 level, sharp rallies are still possible within the confines of a trend that should find gold headed lower into January.
Third, the latest data from my cycle studies support the wild action we are seeing and the bottoming process.
More specifically, as you can see from the chart below of the long-term daily cycles, gold should be heading lower into January.
But look at the long-term weekly cycles for gold on this next chart.
This type of formation — where the daily cycles are bearish but the weekly cycles are bullish — is not unusual at important turning points.
It’s what causes wild swings, confusion in the market place — and yet, it’s part and parcel of the bottoming process.
It’s the market’s way of throwing as many curveballs at you as possible — to shake you out of the market — so only the savviest, most disciplined investors can profit from the next leg up.
One more thing about gold and the bottoming process. Here are my year-end momentum and trading ranges to monitor for gold …
Gold’s 2014 momentum range: $1,948.10 — $1,338.20
Gold’s 2014 trend range: $1,268.30 — $852.60
If you’ve been watching gold closely, you can see how accurate those ranges are. Gold rallied above the $1,338.20 level — the bottom of the 2014 momentum range — in late October, but then suddenly dropped right back below it.
This is critical. It is telling you that the momentum in gold remains negative, with a bearish bias heading into year-end.
And now, gold has fallen below the top of the 2014 trend range at $1,268.30. This tells you that the daily cycles are now overpowering the weekly cycles, setting up gold for a January 2014 low, at much lower prices.
All of this is also why I urge you to pay very close attention to the gold market now … to everything I write and send you … and be ready to act on a moment’s notice.
Gold is reaching its most important inflexion point since its major bottom back in 1999. And if you let the wild action throw you off course, you will miss the next big leg up that will take gold to well over $5,000 an ounce.
Be patient, disciplined and wait for my signals. If you can do that, you stand to make more money in gold over the next three years than you ever dreamed possible.
Best wishes,
Larry
About Larry Edelson
This investment news is brought to you by Money and Markets. Money and Markets is a free daily investment newsletter from Martin D. Weiss and Weiss Research analysts offering the latest investing news and financial insights for the stock market, including tips and advice on investing in gold, energy and oil. Dr. Weiss is a leader in the fields of investing, interest rates, financial safety and economic forecasting. To view archives or subscribe, visit http://www.moneyandmarkets.com/.

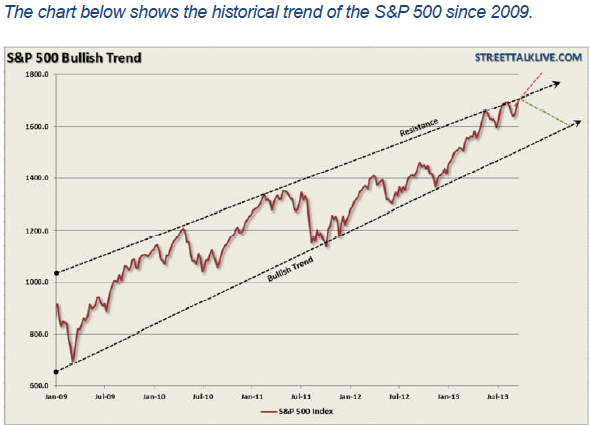
In September I discussed the prospect of “why” stocks could be ready to melt up going into the end of the year. At that time I discussed some commentary by Bill King who had stated:
“Ironically, the market’s zest for Yellen instead of Summers could doom her reign if she becomes Fed CEO. The market will go into Abenomics mode if Yellen is crowned. This will create multiple bubbles that will eventually burst and cause horrors of biblical proportions.
In order to disabuse the market of the notion that she is easier than Easy Al and Ben Bernanke, Yellen will have to be tough from the inception of her reign. If this occurs, the market will throw a temper tantrum of biblical proportions.
We opined last week that an in-line QE taper ($10B to $15B) could ignite a short-covering melt up in stocks. The totally irrational Summers relief rally might mitigate the taper relief rally.
With the benefit of options and futures expiration this week, stocks are extremely vulnerable to upside manipulation and short squeezes.”
I stated then that:
“This is an interesting piece of commentary for several reasons. First, the current cyclical bull market is already fairly well advanced, in terms of both price and time, and when combined with trailing valuations above 18x and rising should elicit some concerns. This is particularly the case when earnings growth has begun to deteriorate. Secondly, and to the point of Bill’s thesis, is that the final stage of every bull market cycle has been a parabolic push as irrational exuberance takes over rational thought.
>> Read More. Download This Weeks Issue Here.
Lance Roberts is the General Partner & CEO of STA Wealth Management, Host of the “Streettalk Live” Daily Radio Show (streamed live at www.streettalklive.com), and Chief Editor of the X-Report and the Daily X-Change Blog.
Follow me on Twitter: @streettalklive

-
I know Mike is a very solid investor and respect his opinions very much. So if he says pay attention to this or that - I will.
~ Dale G.
-
I've started managing my own investments so view Michael's site as a one-stop shop from which to get information and perspectives.
~ Dave E.
-
Michael offers easy reading, honest, common sense information that anyone can use in a practical manner.
~ der_al.
-
A sane voice in a scrambled investment world.
~ Ed R.
Inside Edge Pro Contributors

Greg Weldon

Josef Schachter

Tyler Bollhorn

Ryan Irvine

Paul Beattie

Martin Straith

Patrick Ceresna

Mark Leibovit

James Thorne

Victor Adair