
Personal Finance
 Today in Canada there is little doubt where the tenants are heading: straight into Alberta, Saskatchewan and, to a lesser extent, Manitoba, which form an economic powerhouse in the heart of our nation.
Real estate investing is a bit like duck hunting. You have to set your aim to “lead” the duck to allow for the distance the duck will fly while your shotgun pellets are getting to it. If you don’t, you’ll always be shooting where the duck was, not where the duck is.
It is similar in the real estate market. Knowing where your potential tenants will be in the future is vital. Values grow where people go and people go where the jobs grow.
Since your returns depend on people with jobs that are likely staying, it is important to find out about livability, vacancy rates and new job creation.
Multi-family real estate values thrive on fully tenanted buildings and, if you want capital appreciation, you need to know where the tenants are flocking. I stress capital appreciation because low capitalization rates today make it difficult to earn returns.
Vancouver’s expensive apartment-building market is (finally) seeing price resistance this year, as investors balk at paying record-high “per door” prices (the average price of a Vancouver rental apartment is now north of $220,000) and suffering cap rates in the 3 per cent range. As a result, first-half sales this year flatlined after years of growth.
But Vancouver investors have a ready option, and it is to the immediate east.
Today in Canada there is little doubt where the tenants are heading: straight into Alberta, Saskatchewan and, to a lesser extent, Manitoba, which form an economic powerhouse in the heart of our nation.
Big players in the multi-family market, such as real estate investment trusts (REITs), have already figured this out. For instance, Boardwalk REIT of Calgary and Toronto-based Canadian Apartment Properties REIT spent an average of $33 million a month in 2012 just in Western Canada, and they are not too picky about what they buy as long as it cash flows.
The reason is clear. Yield and return. According to the REALpac/IPD Canada Annual Property Index, over the past 12 months real estate outperformed public equities at 5.9 per cent, bonds at 4 per cent and inflation at 1 per cent. The total returns varied between six Canadian cities surveyed for the index, but the biggest returns were in Calgary, up 17.4 per cent; and Edmonton, up 17.1 per cent.
OK, where should you hunt in 2013 and beyond?
Well, certainly research where the big boys – and tenants – have gone and are likely to go. Here are three places that we have been recommending to our Jurock Real Estate Insider subscribers.
Calgary and Edmonton
Calgary and Edmonton currently have the lowest apartment vacancy rates in Canada, at 1.2 per cent. Calgary led all big cities with an average 7.2 per cent rent increase in the past year (Alberta has no rent controls). According to Statistics Canada’s quarterly population estimates, in-migration from other provinces and immigration totals about 68,000 persons per year arriving in Alberta, with most heading for the larger cities.
Interprovincial migration to Alberta in the first quarter of this year was the highest in nearly 40 years at 13,400, including 2,500 from B.C. and 6,000 people from Ontario.
The lure is jobs. Calgary’s unemployment rate is 5 per cent, and it is 4.6 per cent in Edmonton, second lowest in Canada after Regina and Saskatoon.
With stiff competition for apartment blocks investors can also look at buying condominiums and renting them out.
CMHC estimates that 32 per cent of Edmonton condos are being rented out, for example, a total of nearly 13,000 as of the last count. The vacancy rate for condos is 2.5 per cent and the typical rent for a two-bedroom is $1,268 per month – or about 20 per cent higher than the overall apartment market. Similar trends are seen in Calgary.
Think of the ducks: your tenants are flying into Alberta and that is where you should be investing.
Saskatoon
With an apartment rental vacancy rate of 2.6 per cent Saskatchewan’s biggest city is a prime landlord investment market.
Saskatoon is drawing a lot of young people – even from Vancouver – despite its wintry weather. With 6,100 migrants arriving last year – a record high – the city now has 272,000 residents. It also has the strongest economic growth of any city in Canada this year, as forecasted by the Conference Board of Canada, which pegs its growth at 3.7 per cent this year and 3.8 per cent in 2014. As a comparison, Vancouver will see about 2.3 per cent GDP growth both this year and next.
Saskatoon is bursting with jobs, with an unemployment rate at 3.9 per cent. Housing starts are at a 30-year high; building-permit values hit a record of $1.1 billion last year; and the average weekly wage is around $910, compared with $869 in much-more-expensive B.C.
West is best
Are there other cities to buy in? Absolutely. Western Canada is the place to be. The power shift east to west is seriously underway. We at Jurock predict the oil pipelines will be built. The LNG pipelines will be built. The LNG terminals will be built. More people will retire in the West. More immigrants, particularly business immigrants, will come to the West. So, buy Prairie properties with good cash flows, good “B” locations and caring tenants. Watch the vacancy rates, watch the big boys but, above all, watch where the ducks will be flying.
From the Western Investor, August 2013
Ozzie Jurock is a Vancouver-based real estate investor and publisher of the Jurock Real Estate Insider. He is a contributor in Donald Trump’s book, The Best Real Estate Advice I Ever Received. Reach Ozzie at oz@jurock.com or ozziejurock.com.

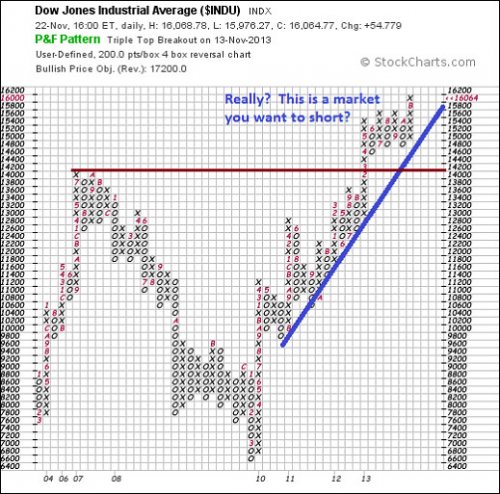
Seven weeks in a row of higher prices, three 1000 marks broken: late-2013 is one for the record books. So it’s the same old story: we (conservative DTL types) don’t own nearly enough stock to fully benefit from this. But on the other hand, at least we’re not short! Are we???
I played the whole “irrational exuberance” hand from the mid-1990s to early 2000s. You know – this market is SO over-priced and can only go down – and bought a bunch of contra, bear funds. Guess how well that worked out? (Hint: I still have to work for a living.)
At some point, the market will crater and the shorts will make tons of dough. But as always, it’s the “when” that matters, and so far guessing the answer to that one has eluded most of us. So ride the bull as the Dow soars towards 20,000 (yes — I read today why that’s not outlandish at all), or sit on the sidelines, but don’t short a rip-roaring bull market unless you just love the thrill of gambling and don’t mind losing.
As mentioned last week, it may be that this bull market, or at least this uninterrupted move up in the bull market, will run out of steam sometime in the next month or two. That possibility is based on a number of factors, intuition among them. There’s also the historical tendency for markets to top out at the end of one year/beginning of another. (i.e. gold 1979/80, stocks 1965/1966, stocks 1999/2000). But none of this is to suggest shorting the market. If anything, it may be a time to take profits and diversify some funds into foreign markets, as suggested in previous weeks. Sell on further price gains and wait for a correction to buy those foreign securities (e.g. EFA, EEM, etc), or simply swap US stocks and ETFs for foreign stocks/ETFs straight across the board? Either is a reasonable strategy; choose the one that makes more sense to you.
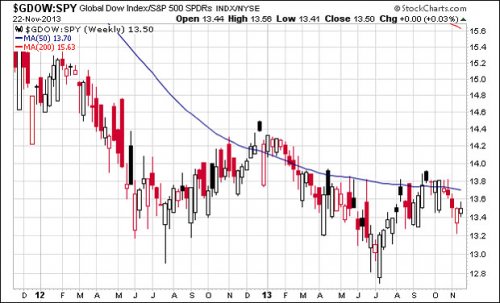
Here the Global Dow Index is shown relative to the S&P 500. It shows that, so far, global stocks have not outperformed US stocks. If one is concerned about the US economy and US dollar however, then this chart implies that there’s still time to own equities while hedging against future US problems. How? By buying foreign stocks/ETFs that are denominated in foreign currencies.
[Hear More: Jeffrey Saut: Portfolio Managers Still in the “Disbelief Phase” of This Bull Market]
Last week was a bad one for gold, along with silver and the mining shares. I’d like to say that this only means their upward potential is now even greater, but that kind of logic only applies in the very long-term. So ten or twenty years from now, the price of gold will be much higher? Probably so — but does that mean that it’s a “buy” or even a “hold” here? At least according to the charts, the first (gold is a buy here) is a tough argument to make. And even the second (hold your gold) is open to debate among reasonable people after last week’s price action.
Last week I showed a dangerous head-and-shoulders top in gold (I accidentally labeled it a triple-top — sorry). That topping formation unfortunately gave way on the downside, generating a pretty strong sell signal in gold. Here you see a different version of that same chart, with the obvious downside target for gold now being the summer’s lows around $1180. As explained here in the past, based on this kind of market action the odds seem greater than 50/50 that gold’s great bull market that started in 2000 is now over. A break below the $1180 area would almost certainly confirm that judgment.
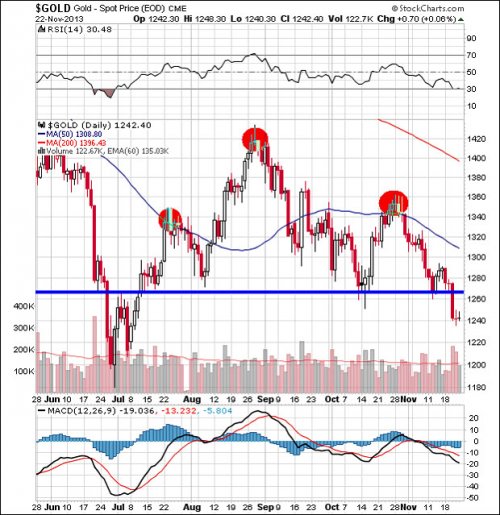
There ARE charts that show gold’s bull market may still be intact, and so we shouldn’t forego all hope of higher prices. But the most reliable charts and the weight of evidence suggeststhat gold has entered a multi-year period of sideways to lower prices. With all the precious metals that DTL readers and writers own, this certainly is not what we wanted to see. But the odds are, that is the reality we now face.
THEREFORE… If you own a boatload of precious metals, you need to consider your options here. Gold cannot get anything going, even during its seasonally-strongest time of the year, and at the same time sends strong technical signals that there may well be many tough months or years ahead for it. Do you hold, hoping it’s all a market fake-out, or only a few months of lower prices ahead, or hold on forever because you’re convinced that’s the best long-term strategy? Or do you lighten up a bit, look for little rallies to sell into, cut back your precious metals exposure, live to fight another day? Each of us has to make those decisions by ourselves. I’ve been urging you to consider how you might respond in this kind of situation, but won’t presume to tell you what’s best for you and your circumstances.
The stock market seems to offer more upside potential, although I am concerned that US stocks may top out — at least temporarily — in the next few weeks. With the market up 22% for the year, throwing caution to the wind and jumping in now doesn’t make sense. But neither does being entirely on the sidelines, given that 1) there’s no other place to make any money and, 2) we may well have that manic 3rd stage ahead of us that sends stock prices sharply higher still. Moderation and diversification, as always, are the answers. Own some US stocks, own some foreign stocks, own a little foreign currency, keep your precious metals (pared down a fair amount?), and have a healthy cash reserve.
The following is an excerpt of Richard Russell’s Dow Theory Letters. To receive their daily updates and research, click here to subscribe.

The Dow just made another all-time record high. To provide some further perspective to the current Dow rally, all major market rallies of the last 113 years are plotted on today’s chart. Each dot represents a major stock market rally as measured by the Dow with the majority of rallies referred to by a label which states the year in which the rally began. For today’s chart, a rally is being defined as an advance that follows a 30% decline (i.e. a major bear market). As today’s chart illustrates, the Dow has begun a major rally 13 times over the past 113 years which equates to an average of one rally every 8.7 years. It is also interesting to note that the duration and magnitude of each rally correlated fairly well with the linear regression line (gray upward sloping line). As it stands right now, the current Dow rally that began in March 2009 (blue dot labeled you are here) would be classified as well below average in both duration and magnitude. However, the magnitude of the current post-financial crisis rally has now reached median status — its magnitude is greater than six and less than six Dow rallies since 1900.
Notes:
Where’s the Dow headed? The answer may surprise you. Find out right now with the exclusive & Barron’s recommended charts of Chart of the Day Plus.
Quote of the Day
“An expert is someone who has succeeded in making decisions and judgments simpler through knowing what to pay attention to and what to ignore.” – Edward de Bono
Events of the Day
November 27, 2013 – Hanukkah (1st day)
November 28, 2013 – Thanksgiving Day
December 10, 2013 – Nobel Prizes awarded (announced in October)
Stocks of the Day
— Find out which stocks investors are focused on with the most active stocks today.
— Which stocks are making big money? Find out with the biggest stock gainers today.
— What are the largest companies? Find out with the largest companies by market cap.
— Which stocks are the biggest dividend payers? Find out with the highest dividend paying stocks.
— You can also quickly review the performance, dividend yield and market capitalization for each of the Dow Jones Industrial Average Companies as well as for each of the S&P 500 Companies.
Chart of the Day is FREE to anyone who subscribes. Just go HERE and enter your email address

Despite its recent weakness, the world is still viewing gold as a store of value.
Overall demand remains strong. As Eric Sprott points out, “It’s staggering to think demand for gold is twice global mine production.”
China is now the largest gold buyer and producer in the world. And with their economy looking better, gold continues getting a big boost from this area.
Gold’s steps are your friend
For now, all is still good on the basing front. And our best bet is to keep track of the stepping stones because gold is at a crossroads.
They served us well on the way up, and they’ll serve us well now.
Chart 1 shows gold’s steps, along with its mega 23 month moving average.
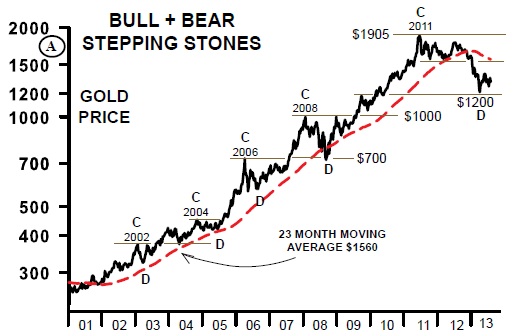
Briefly, during the up moves, the C peaks generally marked the support for the future D declines.
This was a bull market check point.
The interesting point today is that the low in June near $1200 is still higher than the prior C peak in 2008.
This is technically a good sign and if $1200 holds, it’ll be a bullish signal.
The C rise up to the 2011 peak was an unusually long C rise, but the D decline has also been unusually long. This means, on the downside, if the June low is clearly broken for a few days, we could then see the $1000 level tested, the 2008 prior C peak.
If so, the entire post financial crisis rise would’ve been erased. This would probably be the worst case scenario.
What’s best to buy & keep
Many have asked if CEF and GTU are safer and better to hold than the gold and silver ETFs, like GLD and SLV.
Both CEF and GTU are Canadian gold and silver funds that are backed up by gold and silver in their funds.
This is not necessarily the case with the ETFs. Many rumors are flying that the Comex gold warehouse supplies are way down, and during the mad ETF selling last April-May-June, China was picking up a lot of that same gold and silver.
For reasons of safety, you know gold and silver are stored with CEF and GTU, but you’ll never really know about the ETFs.
In today’s world, safety is important, and keeping the physical metals in your possession is always best, followed by CEF and GTU.
Follow the bankers
When price manipulators take the gold price down, central banks see value and buy.
Mario Draghi, the head of the European Central Bank (ECB) said it well when he explained, “I never thought it wise to sell gold because for central banks this is a reserve of safety.”
He also said it gives non-U.S. dollar countries a good protection against fluctuations of the dollar.
This is clearly a different view than Ben Bernanke’s view that nobody really understands gold prices. He doesn’t seem to enjoy talking about the barbarous relic, but stay tuned.
—
Mary Anne & Pamela Aden are well known analysts and editors of The Aden Forecast, a market newsletter named 2010 Letter of the Year by MarketWatch, which provides specific forecasts and recommendations on gold, stocks, interest rates and the other major markets. For more information, go to www.adenforecast.com


-
I know Mike is a very solid investor and respect his opinions very much. So if he says pay attention to this or that - I will.
~ Dale G.
-
I've started managing my own investments so view Michael's site as a one-stop shop from which to get information and perspectives.
~ Dave E.
-
Michael offers easy reading, honest, common sense information that anyone can use in a practical manner.
~ der_al.
-
A sane voice in a scrambled investment world.
~ Ed R.
Inside Edge Pro Contributors

Greg Weldon

Josef Schachter

Tyler Bollhorn

Ryan Irvine

Paul Beattie

Martin Straith

Patrick Ceresna

Mark Leibovit

James Thorne

Victor Adair