
Timing & trends
Economic News
November Canadian Housing Starts to be released at 8:15 AM EST are expected to dip to 195,000 from 198,000 in October.
THE BOTTOM LINE:
Economic sensitive sectors with strong positive seasonality traits (e.g. Industrials, Consumer Discretionary, Technology and Materials) are leading equity markets on the upside. Preferred strategy is to accumulate equity markets and sectors with favourable seasonality on weakness in order to take advantage of the October 28th to May 5th period of strength.
Weekly Initial Jobless Claims to be reported at 8:30 AM EST on Thursday are expected to increase to 315,000 from 298,000 last week.
November Retail Sales to be released at 8:30 AM EST on Thursday are expected to increase 0.6% versus a gain of 0.4% in October. Excluding auto sales, November Retail Sales are expected to increase 0.3% versus a gain of 0.2% in October.
October Business Inventories to be released at 10:00 AM EST on Thursday are expected to increase 0.3% versus a gain of 0.6% in September.
November Producer Prices to be released at 8:30 AM EST on Friday are expected to remain unchanged versus a decline of 0.2% in October. Excluding food and energy, November Producer Prices are expected to increase 0.1% versus a gain of 0.2% in October.
EQUITY TRENDS
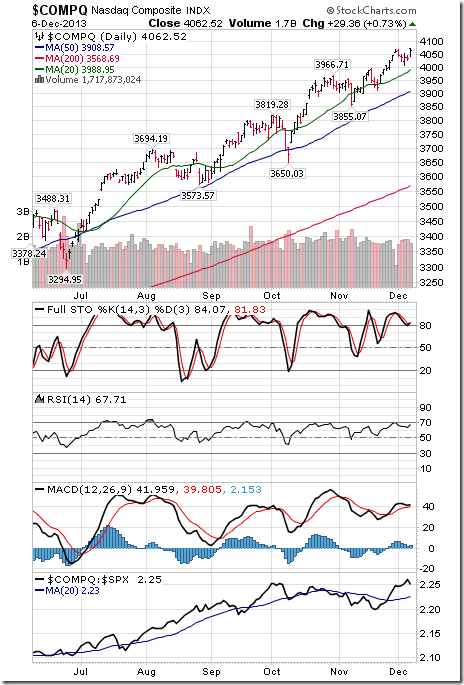
The NASDAQ Composite Index The Shanghai Composite Index added 16.61 points (0.75%) last week. Trend changed from neutral to up on a move above resistance at 2,243. The Index remains above its 20, 50 and 200 day moving averages. Strength relative to the S&P 500 Index remains positive. Technical score improved to 3.0 from 2.5 out of 3.0. Short term momentum indicators are overbought.
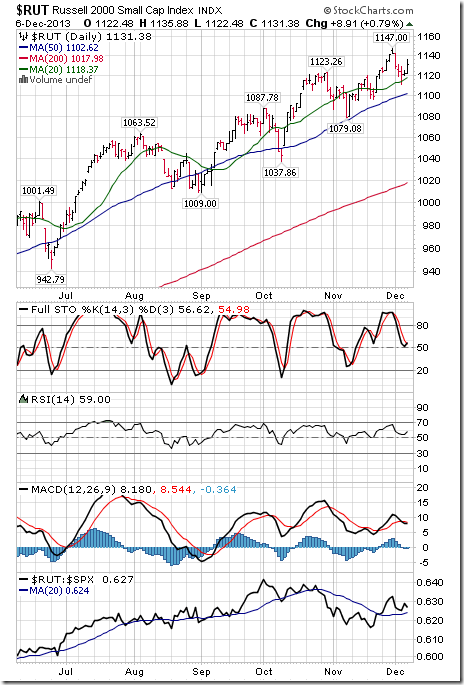
The Russell 2000 Index fell 11.51 points (1.01%) last week. Trend remains up. The Index remains above its 20 day moving average. Strength relative to the S&P 500 Index remains positive. Technical score remained at 3.0 out of 3.0. Short term momentum indicators are trending down.
The Shanghai Composite Index added 16.61 points (0.75%) last week. Trend changed from neutral to up on a move above resistance at 2,243. The Index remains above its 20, 50 and 200 day moving averages. Strength relative to the S&P 500 Index remains positive. Technical score improved to 3.0 from 2.5 out of 3.0. Short term momentum indicators are overbought.

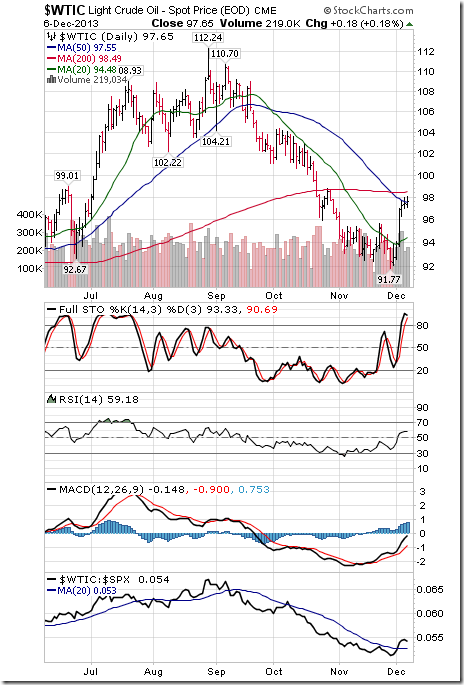
Crude oil gained $4.93 per barrel (5.32%) last week. Trend changed from down to neutral on a move above $95.63. Crude moved above its 20 and 50 day moving averages. Strength relative to the S&P 500 Index changed from negative to positive. Technical score improved from to 2.5 from 0.0 out of 3.0. Short term momentum indicators are trending up.
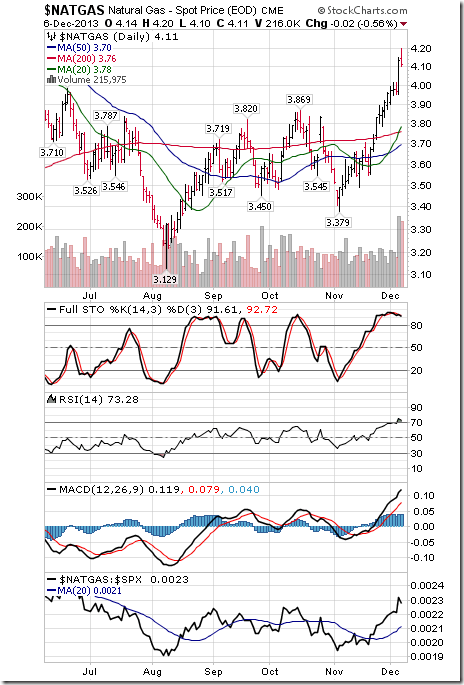
Natural Gas added $0.16 per MBtu (4.05%) last week. Trend remains positive. Natty remains above its 20, 50 and 200 day moving averages. Strength relative to the S&P 500 Index remains positive. Technical score remains at 3.0 out of 3.0. Short term momentum indicators are overbought.
Copper added $0.05 per lb. (1.56%) last week. Trend remains down. Copper moved above its 20 day moving average. Strength relative to the S&P 500 Index changed from negative to positive. Technical score improved to 2.0 from 0.0 out of 3.0. Short term momentum indicators are trending up.
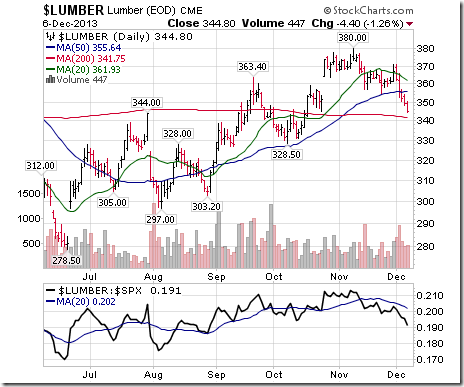
Lumber fell another $22.10 (6.02%) last week. Trend remains up. Lumber fell below its 20 and 50 day moving averages. Strength relative to the S&P 500 Index remains negative. Technical score slipped to 1.0 from 2.0 out of 3.0.
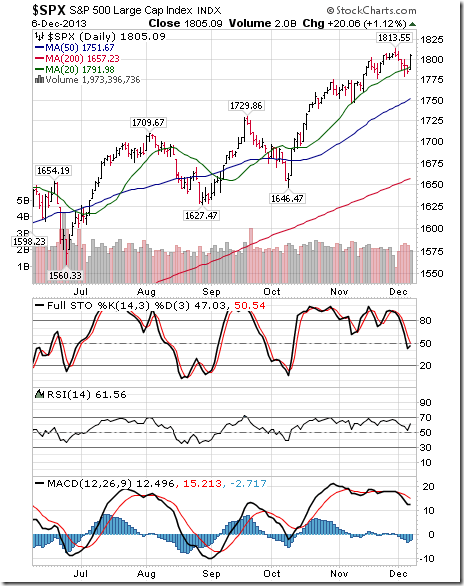
The S&P 500 Index slipped 0.72 (0.04%) last week. Trend remains up. The Index briefly fell below its 20 day moving average, but managed to close above it. Short term momentum indicators have rolled over from overbought levels.
The TSX Composite Index fell 114.68 points (0.86%) last week. Trend changed from up to neutral on a move below 13,285 (Score: 0.5). The Index remained below its 20 day moving average (Score:0.0). Strength relative to the S&P 500 Index remains negative (Score: 0.0). Technical score slipped to 0.5 from 1.0 out of 3.0. Short term momentum indicators are trending down.
Economic and political focus this week is on the Congressional Budget Committee and its report expected to be released on December 13th. Hopes are high that an agreement will be reached. Other economic reports (e.g. Retail Sales, Initial Claims, Producer Prices) are expected to support higher equity prices.
Earnings reports this week are not a factor.
Short and intermediate technical indicators for most equity markets and sectors are overbought, but have yet to show significant signs of rolling over.
Seasonal influences for equity markets this week are slightly negative. However, influences turn strongly positive throughout the remainder of the month.
Money flows into share buy backs continue. Last week, Deere joined the party with an $8 billion share buyback. Equity markets likely will anticipate an increasing number of share buybacks when fourth quarter reports are released.
Special Free Services available through www.equityclock.com
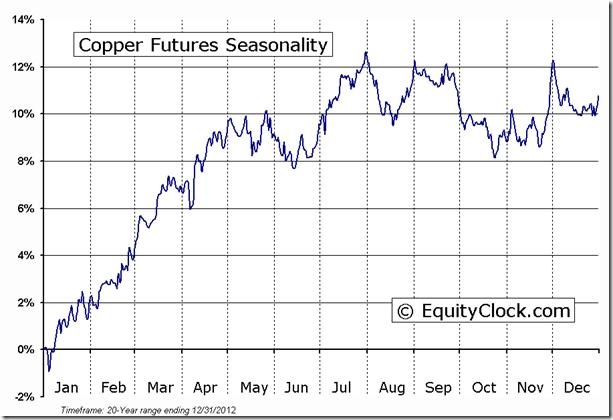
Equityclock.com is offering free access to a data base showing seasonal studies on individual stocks and sectors. The data base holds seasonality studies on over 1000 big and moderate cap securities and indices. Notice that most of the seasonality charts have been updated recently.
To login, simply go to http://www.equityclock.com/charts/
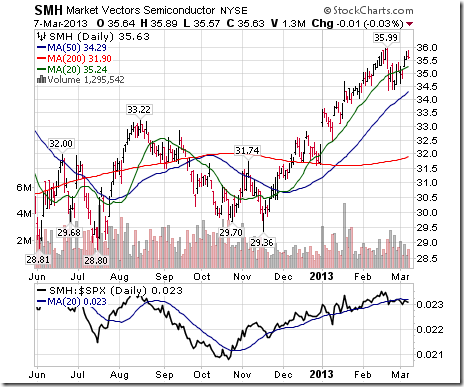
ED Note: Above is an example of the Copper Seasonality Chart which pretty graphically underscores the Bottom Line Sector Seasonal Strength.

 This week I am preparing to write our annual Outlook and Forecast for 2014 which is an annual attempt to make a “wild @$$ guess” about the future based on what we can glean from historical statistics. However, while it is an exercise in data analysis, logic and educated guesses – the reality is that is not so far removed from Tarot cards, crystal balls and palm reading.
However, the amount of research required takes an exorbitant amount of time which means that this week’s newsletter will be a little more concise than usual.
Since there was no newsletter over the Thanksgiving weekend I want to take a moment to remind you of what I said two weeks ago as it is relevant to today’s topic.
“The discussion of both parabolic markets, and trend analysis, are keys to the overall understanding of why the markets could rise to 2300. The chart [on the next page] shows the current bullish trend(s) of the market since the lows of 2009.
As you will notice the market is currently pushing into the resistance of the original bullish trend line that begins in 2009. The break of that trend line in 2011 has now turned the trend line from support into resistance.
However, as shown by the red dashed line, the current bullish trend has begun to accelerate from the trend that begin post the 2011 debt ceiling debate. IF this market is going to accelerate higher from current levels it will be important that it either breaks out above 1800 on a sustained basis OR the market pulls back to 1700 and holds support at the current bullish trend line.
The PRIMARY ISSUE here is that there is NO valuation argument that currently supports asset prices at current levels.

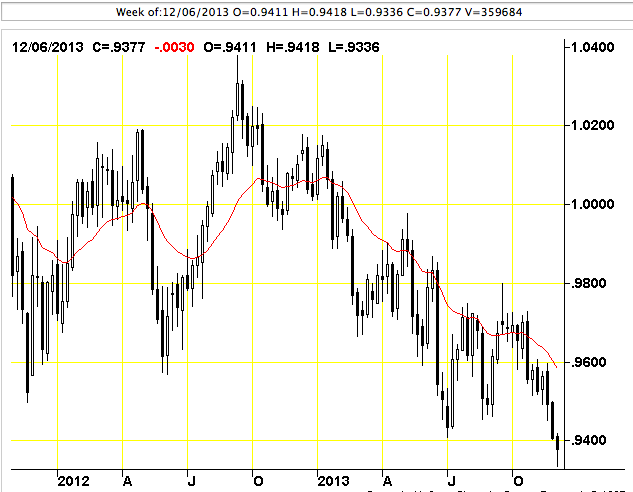
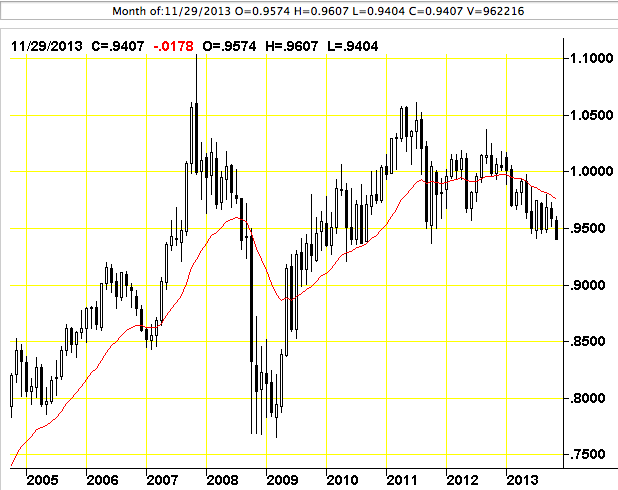
It’s hard to avoid the topic of the beleaguered Canadian dollar given the swift move down we have seen against its US counterpart over the last six weeks. Just six weeks ago the Loonie was much stronger, roughly trading around 97.50 Cents US before the Bank of Canada abandoned what many referred to as their hawkish bias on their second most recent policy announcement. And by removing that reoccurring implication that the next move in interest rates was going to be higher and just simply waiting for the economy to pick up some steam, economist and investors took the withdrawal of that hawkish tone as an indication that next move in interest rates could just as likely be to the downside.
But rest assured, a move lower in interest rates is not in the cards from the Bank of Canada in the months ahead, and the despite the toll its taking on the dollar, we won’t see the bank change step. In fact, this most recent downturn in our currency is one of the most natural trade boosters we could receive. But there is no question that the Canadian economy is struggling to achieve the economic growth forecasts that many had been optimistically hoping for earlier in the year. However, it is still nowhere near sluggish enough for the central bank to re-enter (or arguably remain in) a sustained period of emergency level record low interest rates. And quite simply, it is the inability for the Bank of Canada to raise interest rates due to the inherent weakness in the economy, and that is the main factor driving the Loonie lower.
There are also two fundamental reasons though we are seeing weakness in our currency. The first has to do with the lack of inflation. Most recent data highlights the price level advanced by an annualized rate of a mere seven tenth of a percent in October. And the lack of inflation in the economy has two very simple implications. One is that low inflation levels are associated with more muted periods of economic growth. The second and relating to the lower levels of economic expansion is that the economy struggles to create jobs. But when you have the Canadian economy still averaging over 13,000 jobs created a month, it’s not yet a worry. For any serious credibility given to a downward move in interest rates, job growth would seriously have to dissipate.
The second reason we are seeing the dollar trade lower is to do with a deteriorating balance of trade. Particularly, the weakening demand we are seeing in the resource sector is equating to a waning demand to purchase those commodities. And as that sector of the economy has proven to be so pro cyclical with GDP growth, it can be expected that when the resource sector picks up again, and it will, we will see a renewed demand that is very supportive of the Canadian currency.
While examining the fundamental factors impacting the Canadian dollar these last few months, if these volatile financial markets over the last few years have illustrated anything, fundamentals, albeit important, can very much be trumped by the sentiment of investors. And the fact that Canada was the least dirty shirt among the worlds developed economies was what elevated our Canadian dollar above parity. In fact, beyond the fundamentals, the Canadian dollar almost carried an elite status because of the relative strength of our financial institutions following the worst recession since the Great Depression. In the moment though, the story is very much about the regained strength of the US dollar. Pair that with a central bank abandoning their hawkish views and we will see the premium in our currency dissipate.

Something is wrong. On Friday the pundits were bellowing that the unemployment rate had fallen to a mere 7.0%, the IPR had risen and, of course, the equity markets cheered. The Grande Dame Dow roared ahead 198 points. Gold and silver sank further as they have been for 6 weeks.
It is now becoming common thinking that the Fed must “taper” Quantitative Easing. Common thinking is very dangerous, indeed. It causes volatility as markets are whipsawed, with futures wagging the Dog’s tail.
Of course, eventually it must be tapered but that will not necessarily revive the country’s economic problem. In fact take a quick look at the ten year Treasury last week. Interest rate vigilantes are just waiting with baited breath to revert that market – and it will not be gradual – it will be knee jerk.
“So what”, you ask?
Well, higher interest rates will be very nice for insurance companies (now reeling under impending Obama Care) and seniors (reeling under financial repression, an insidious tax on savers) but as interest rates rise housing, capital investments and the debt-burdened American consumer will have to pay up. Savers will benefit. Increased saving is not what our legislators in Washington want to see at this time.
Ever wonder why Bitcoin has increasing appeal? Think about that. Take a look at Treasury rates between January 1 and December 6, 2013. As you can see the Ten Treasury year bond has fallen as yields have risen 102 basis points. Be careful what you ask for, Dr. Yellen, the Bond Vigilantes may still control this picture.
In other words, is the US economy really ready for higher interest rates?

While the economy may be looking slightly less torpid, the banking system is still very much on the wane. The money multiplier continues its descent to lowest level in the history of the time series, resting now at $.71 but clearly on the downtrend. The Fed’s economists ignore the artifact even though Milton Friedman scolded the Fed for not increasing the money supply during the Great Depression in the face of the multiplier’s shrinkage. Several years ago Fed Chairman Bernanke responded to him that the Fed would not make the same mistake this time. Unfortunately the Fed has acted implementing several QE programs. The results are clear and definitively negative. We are in a pernicious deflationary environment. Gold and silver are shouting this fact. The graph below, from the St Louis Federal Reserve Bank, conjures the vision of a rocky, mountainous banking bottom descending yet to its deepest depths.
Hence the title of this paper, “Challenger Deep.”
Evidently, creating asset “bubbles” as economic policy is not the way to sustain a vibrant economy. The money gods have spoken. That is their message.
Now we have a third bubble (non-hard asset resource equities) inflating in the open. It is strictly a monetary phenomenon.
Reporters are cheering. They should be warning. You know the saying. I think my friend Dennis Gartman may have developed this and it is so true to life.
“When you are yelling, you should be selling and when you are crying you should be buying.” It is just a matter of determining how long this situation will exist.
Perhaps I can add another question, “When the MSNBC pundits are cheering, should you be fearing?”
Printing trillions of fiat dollars has not restored a sustainable US economy. Unemployment and underemployment are far too high after 60 months, labor force participation is at historic lows, real wages are stagnant, college costs exorbitant, medical care is likely to be more, not less, expensive, a new higher debt ceiling almost a certainty on February 7th 2014, unemployment benefits are to be lengthened once again, and consumers are teetering.
We have an epiphany to encounter before the turn comes. When it does, of course, hard assets will be seen in hindsight as a negative bubble. Unless there is a miraculous Deus Ex Machina we have 1 to 5 years of economic headwinds ahead. Challenger Deep indeed!

I might add any of the St Louis Fed’s money multiplier time series. They are all signing the same song. QE programs have enlivened the equity markets. But they will kill the bond market in due course. Gold and silver are just the beginning of the story. Equities, excepting equities on hard assets, are approaching “Bubble Territory” (no one can call top of a bubble). Housing must follow suit as interest rates rise. Consumers must resort to saving to attempt to restore retirement wealth for future family generations. Most are just beginning to be aware of the dilemma facing their legacy in future generations.
A Succession of Asset Bubbles
When will this all end? I don’t know. We will have an idea when the multiplier makes a final bottom and turns up and the velocity of money accelerates.
Most observers and TV personalities do not focus on the history of the past two gigantic asset bubbles. From 1995 through 2000 the Dot Com bubble reared its head. Then Washington inflated the housing bubble in response to the bursting of the Dot Com stocks. A close examination of the velocity of money during these two periods shows how damaging these two bubbles have been.
During the Dot Com bubble velocity soared only to decline thereafter. Then the massive housing bubble ballooned and velocity recovered though less than previous highs. In 2007 the housing bubble began to deflate and velocity tanked to the lowest level ever. In 2010 velocity recovered a small amount as you can see below. We only have data through mid-year 2013 but clearly the ability of velocity to accelerate is declining in the face of successive and very destructive asset bubbles.
Evidently, creating asset “bubbles” as economic policy is not the way to sustain a vibrant economy. The money gods have spoken. That is their message.
Now we have a third bubble (non-hard asset resource equities) inflating in the open. It is strictly a monetary phenomenon.
Reporters are cheering. They should be warning. You know the saying. I think my friend Dennis Gartman may have developed this and it is so true to life.
“When you are yelling, you should be selling and when you are crying you should be buying.” It is just a matter of determining how long this situation will exist.
Perhaps I can add another question, “When the MSNBC pundits are cheering, should you be fearing?”
Printing trillions of fiat dollars has not restored a sustainable US economy. Unemployment and underemployment are far too high after 60 months, labor force participation is at historic lows, real wages are stagnant, college costs exorbitant, medical care is likely to be more, not less, expensive, a new higher debt ceiling almost a certainty on February 7th 2014, unemployment benefits are to be lengthened once again, and consumers are teetering.
We have an epiphany to encounter before the turn comes. When it does, of course, hard assets will be seen in hindsight as a negative bubble. Unless there is a miraculous Deus Ex Machina we have 1 to 5 years of economic headwinds ahead. Challenger Deep indeed!

What to do?
1. Budget for lean days.
2. Buy gold and silver as hard asset backstops, if possible. Barter may someday be necessary. They are cheap and will likely become cheaper.
3. Look for sustainable opportunities in the Discovery space – particularly precious and industrial metals (such as silver and copper – Nu Legacy, Pershing Gold, Terraco Gold come to mind), Fertilizers (particularly phosphates – Arianne Resoruces), potable water technology and water assets (nuclear desalination companies – Babcock & Wilcox comes to mind), arable land opportunities, cost effective medical technologies with breakthrough potential (Senesco Technologies and Neuralstem come to mind). Buy any real Quality of Life investment opportunities.
We will, of course survive, this dark period of economics if we act now. On the bright side there will be investment opportunities that abound. They are beginning to appear already. Try hard to be there when the bottom is in. Wait for the turn. Make sure your investment can sustain itself. The great wealth opportunities will be for the taking.
The material herein is for informational purposes only and is not intended to and does not constitute the rendering of investment advice or the solicitation of an offer to buy securities. The foregoing discussion contains forward-looking statements within the meaning of the Private Securities Litigation Reform Act of 1995 (The Act). In particular when used in the preceding discussion the words “plan,” confident that, believe, scheduled, expect, or intend to, and similar conditional expressions are intended to identify forward-looking statements subject to the safe harbor created by the ACT. Such statements are subject to certain risks and uncertainties and actual results could differ materially from those expressed in any of the forward looking statements. Such risks and uncertainties include, but are not limited to future events and financial performance of the company which are inherently uncertain and actual events and / or results may differ materially. In addition we may review investments that are not registered in the U.S. We cannot attest to nor certify the correctness of any information in this note. Please consult your financial advisor and perform your own due diligence before considering any companies mentioned in this informational bulletin. We own shares in Senesco and Neuralstem and Advise Arianne Resources.
…..YOU’RE GOING TO NEED IT TO SURVIVE!
 With the precious metals market in the doldrums and at the bottom of a thirty month correction, there has definitely been some hand wringing and a whole bunch of moping from investors who purchased gold and silver at or near the 2011 highs. This is natural and to be expected. Nobody wants to lose money. People purchase investments ostensibly to make money – hopefully, a lot of it.
Here at the trading desk of Liberty Gold and Silver, we hear our share of complaints as well. However, the complaints originate predominantly from a small minority of our customers. A synopsis of the fundamental attitudes of this minority goes something like this: “We bought our gold and silver not for fundamental reasons, such as safety and security, but solely to make a so-called quick “paper” profit in the same way that stock day traders and house flippers do. Precious metals are simply another trading vehicle, no different than any other that is strictly used for financial gain; and we got into this because we noticed the markets were surging just like the recent Bitcoin phenomenon and we wanted to get in on the exciting fast action.”
…much more HERE in this

-
I know Mike is a very solid investor and respect his opinions very much. So if he says pay attention to this or that - I will.
~ Dale G.
-
I've started managing my own investments so view Michael's site as a one-stop shop from which to get information and perspectives.
~ Dave E.
-
Michael offers easy reading, honest, common sense information that anyone can use in a practical manner.
~ der_al.
-
A sane voice in a scrambled investment world.
~ Ed R.
Inside Edge Pro Contributors

Greg Weldon

Josef Schachter

Tyler Bollhorn

Ryan Irvine

Paul Beattie

Martin Straith

Patrick Ceresna

Mark Leibovit

James Thorne

Victor Adair