

Economic News
November Canadian Housing Starts to be released at 8:15 AM EST are expected to dip to 195,000 from 198,000 in October.
THE BOTTOM LINE:
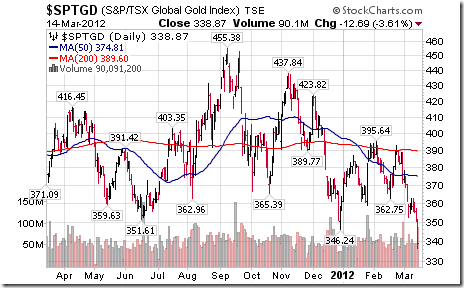
Economic sensitive sectors with strong positive seasonality traits (e.g. Industrials, Consumer Discretionary, Technology and Materials) are leading equity markets on the upside. Preferred strategy is to accumulate equity markets and sectors with favourable seasonality on weakness in order to take advantage of the October 28th to May 5th period of strength.
Weekly Initial Jobless Claims to be reported at 8:30 AM EST on Thursday are expected to increase to 315,000 from 298,000 last week.
November Retail Sales to be released at 8:30 AM EST on Thursday are expected to increase 0.6% versus a gain of 0.4% in October. Excluding auto sales, November Retail Sales are expected to increase 0.3% versus a gain of 0.2% in October.
October Business Inventories to be released at 10:00 AM EST on Thursday are expected to increase 0.3% versus a gain of 0.6% in September.
November Producer Prices to be released at 8:30 AM EST on Friday are expected to remain unchanged versus a decline of 0.2% in October. Excluding food and energy, November Producer Prices are expected to increase 0.1% versus a gain of 0.2% in October.
EQUITY TRENDS
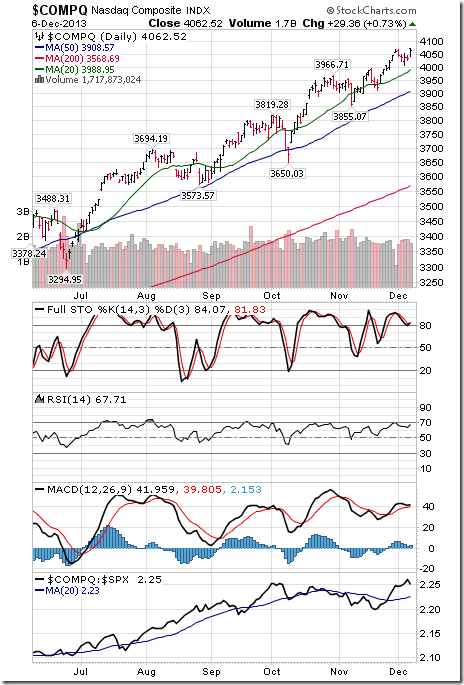
The NASDAQ Composite Index The Shanghai Composite Index added 16.61 points (0.75%) last week. Trend changed from neutral to up on a move above resistance at 2,243. The Index remains above its 20, 50 and 200 day moving averages. Strength relative to the S&P 500 Index remains positive. Technical score improved to 3.0 from 2.5 out of 3.0. Short term momentum indicators are overbought.
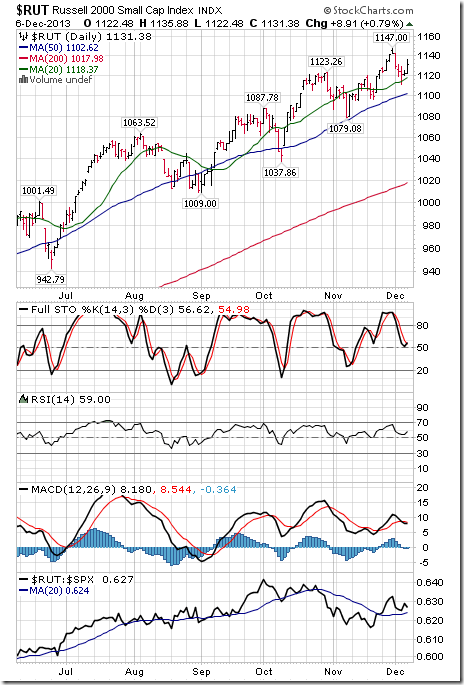
The Russell 2000 Index fell 11.51 points (1.01%) last week. Trend remains up. The Index remains above its 20 day moving average. Strength relative to the S&P 500 Index remains positive. Technical score remained at 3.0 out of 3.0. Short term momentum indicators are trending down.
The Shanghai Composite Index added 16.61 points (0.75%) last week. Trend changed from neutral to up on a move above resistance at 2,243. The Index remains above its 20, 50 and 200 day moving averages. Strength relative to the S&P 500 Index remains positive. Technical score improved to 3.0 from 2.5 out of 3.0. Short term momentum indicators are overbought.

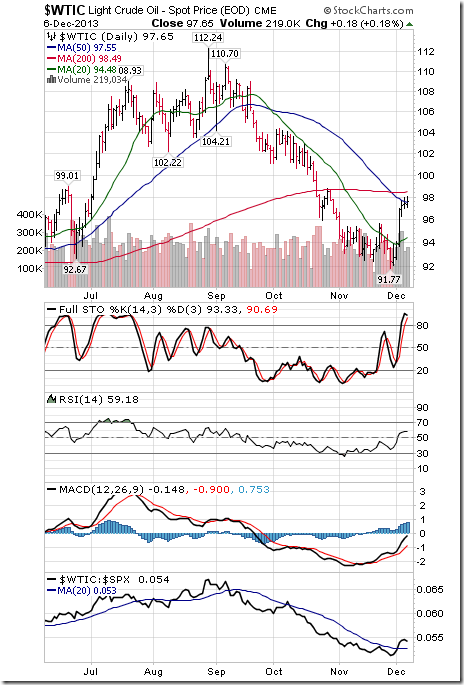
Crude oil gained $4.93 per barrel (5.32%) last week. Trend changed from down to neutral on a move above $95.63. Crude moved above its 20 and 50 day moving averages. Strength relative to the S&P 500 Index changed from negative to positive. Technical score improved from to 2.5 from 0.0 out of 3.0. Short term momentum indicators are trending up.
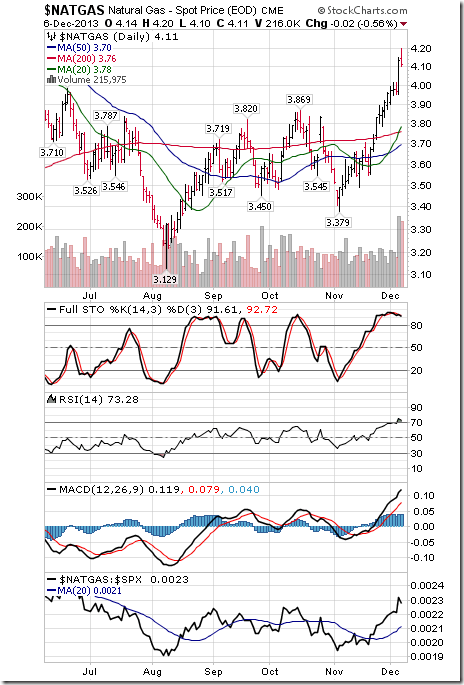
Natural Gas added $0.16 per MBtu (4.05%) last week. Trend remains positive. Natty remains above its 20, 50 and 200 day moving averages. Strength relative to the S&P 500 Index remains positive. Technical score remains at 3.0 out of 3.0. Short term momentum indicators are overbought.
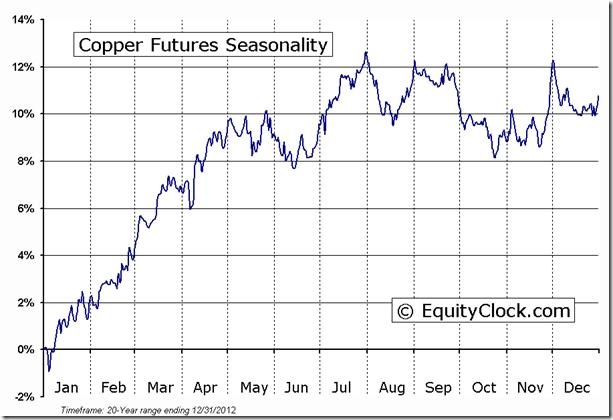
Copper added $0.05 per lb. (1.56%) last week. Trend remains down. Copper moved above its 20 day moving average. Strength relative to the S&P 500 Index changed from negative to positive. Technical score improved to 2.0 from 0.0 out of 3.0. Short term momentum indicators are trending up.
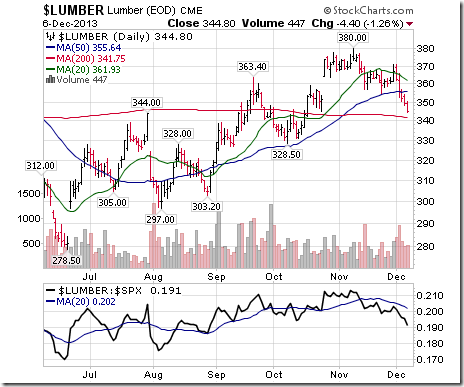
Lumber fell another $22.10 (6.02%) last week. Trend remains up. Lumber fell below its 20 and 50 day moving averages. Strength relative to the S&P 500 Index remains negative. Technical score slipped to 1.0 from 2.0 out of 3.0.
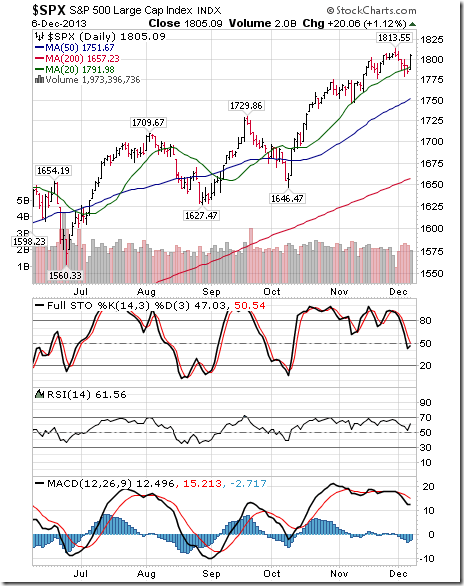
The S&P 500 Index slipped 0.72 (0.04%) last week. Trend remains up. The Index briefly fell below its 20 day moving average, but managed to close above it. Short term momentum indicators have rolled over from overbought levels.
The TSX Composite Index fell 114.68 points (0.86%) last week. Trend changed from up to neutral on a move below 13,285 (Score: 0.5). The Index remained below its 20 day moving average (Score:0.0). Strength relative to the S&P 500 Index remains negative (Score: 0.0). Technical score slipped to 0.5 from 1.0 out of 3.0. Short term momentum indicators are trending down.
Economic and political focus this week is on the Congressional Budget Committee and its report expected to be released on December 13th. Hopes are high that an agreement will be reached. Other economic reports (e.g. Retail Sales, Initial Claims, Producer Prices) are expected to support higher equity prices.
Earnings reports this week are not a factor.
Short and intermediate technical indicators for most equity markets and sectors are overbought, but have yet to show significant signs of rolling over.
Seasonal influences for equity markets this week are slightly negative. However, influences turn strongly positive throughout the remainder of the month.
Money flows into share buy backs continue. Last week, Deere joined the party with an $8 billion share buyback. Equity markets likely will anticipate an increasing number of share buybacks when fourth quarter reports are released.
Special Free Services available through www.equityclock.com
Equityclock.com is offering free access to a data base showing seasonal studies on individual stocks and sectors. The data base holds seasonality studies on over 1000 big and moderate cap securities and indices. Notice that most of the seasonality charts have been updated recently.
To login, simply go to http://www.equityclock.com/charts/
ED Note: Above is an example of the Copper Seasonality Chart which pretty graphically underscores the Bottom Line Sector Seasonal Strength.


