
Personal Finance
This article is taken from the Winter 2014 EPC Global Investor Newsletter.
With the Standard & Poor’s 500 Index having posted a 30% gain, it’s easy to assume that U.S. stocks easily led the world in 2013. (There is more on what is behind this rally in the latest version of the Euro Pacific Capital Newsletter). But as it turns out, the stimulus-loving U.S. markets had plenty of company. Surprisingly, this includes countries supposedly saddled by the scourge of austerity.
The Irish Stock Exchange Quotient (ISEQ), gained 33.6% in 2013. Close behind were the 28% jump in the Athens General Share Index, and the 21% rally in Spain’s IBEX 35 Index (IBEX). Factoring in the 4% rise of the euro over the calendar year and these returns look even better from American eyes. Europe was supposed to be the economic dregs in 2013 and these three charter members of the so-called PIIGS (Portugal, Ireland, Italy, Greece and Spain) were supposed to be the worst of the worst. Yet, they saw big rallies on their stock markets. Despite all we have heard about how callously imposed austerity had threatened to knock these fragile economies back into the Stone Age, the policy has not been as toxic as advertised. In fact, we would argue that it has helped these deathbed economies get partially back on track.
The Luck of the Irish
 You may have missed it but back in December Ireland became the first troubled euro zone state to exit its rescue program completely. Three years ago, amid the collapse of the country’s property market and large losses in the banking sector, Ireland received a 67.5 billion euro loan from a lending troika consisting of the International Monetary Fund, the European Commission and the European Central Bank. In exchange, Ireland was required to impose a series of spending cuts, tax increases, asset sales, and banking reforms. Although these measures made the Paul Krugmans of the world shudder, they appear to have worked for Ireland.
A turning point came in March of last year, for the first time since November 2010, Ireland successfully floated sovereign debt on the international market. Demand for its 10-year bond was so strong that Ireland increased the size of the offer to 5 billion euros from the original 3 billion euros. Then in the new year 2014, things got even better when Ireland was able to raise another 3.75 billion euros at an even lower rate (3.54%). In December 2013, ratings firm Standard & Poor’s affirmed its long-term credit rating of BBB+ and said the outlook remained positive. Ireland appears to be out of the financial doghouse.
In another positive sign, Ireland’s housing market appeared to have turned around after having fallen about 50% during the crisis. In June of last year, “national residential prices recorded their first year-on-year increase (of 1.2%) since January 2008,” said the Central Statistics Office. Additionally, October saw prices rise 6.1% year-over-year. Finally, the unemployment rate had fallen again in December for the 18th consecutive month, registering the lowest rate since May 2009. In the third quarter of 2013, the seasonally-adjusted rate fell to 12.8% from 13.6%, and more than two percentage points below its early 2012 peak.
The falling unemployment rate has been helped by American technology companies expanding their Irish operations. In 2012, Apple Inc. (NASDAQ:AAPL) announced it would build new offices at its Cork headquarters and would hire 500 people. Then in December, Microsoft Corporation (NASDAQ:MSFT) invested170 million euros to expand its Dublin center. All of this happened during a period of austerity!
The Drain in Spain
Spain agreed to its rescue package in July 2012, about 19 months after Ireland, but it expects to exit its bailout program in less time (the country expects to transition in early 2014). While the euro zone partners authorized a rescue package of 100 billion euros, Spain only took 41 billion.
 Like Ireland, Spain was forced by the lenders to make budget cuts and structural reforms in the financial system, and while the measures have bitten, they have led to improvements. In the third quarter, the Spanish economy emerged from a two-year recession and posted growth of 0.1%. While this is below the euro zone average, it is not the catastrophe that some had predicted. In November, Standard & Poor’s raised its outlook on Spanish debt to stable from negative, and kept its debt rating at BBB-, one notch above junk-bond status. By year end 2013, Spain’s government bond market stabilized with yields on 10-year bonds falling to 3.9% from 6.4% in July 2012.
In its November report on the European economy, the European Commission said Spain’s domestic consumption and equipment investment began to stabilize in the second quarter of 2013 and that it expected these trends to continue, with the composition of growth becoming more balanced as domestic demand strengthens.
The European Commission expects the Spanish economy to finally expand in 2014 with growth of 0.5%, and 1.7% in 2015. And while unemployment fell from its first-quarter peak of 27.2%, it remains extremely high at 26%. While these jobless numbers seem unimaginable to Americans, it must be remembered that Spain’s highly restrictive labor laws have driven a large portion of the nation’s jobs into the opaque world of the under the table economy.
There can be no doubt, however, that Spain is still in the thick of it. Based on its historic housing boom of the last decade, the country’s real estate market has yet to show signs of a true bottom, and will probably continue to contract in 2014. Still, the European Commission said, “overall, the adjustment process is progressing, but challenges and vulnerabilities remain significant.” Apparently that was enough for investors.
Greek Trajectory
The situation in Greece remains much riskier for investors than either Ireland or Spain. The country is nowhere near exiting its bailout. Actually, it’s expected to receive another 1 billion euros as part of its bailout program before the end of December 2013. The country is currently in the sixth year of a recession, and since 2010 has received 240 billion euros from the lending troika. (That’s more than 21,000 euros per resident). But its fiscal picture is improving.
 In December, the Greek parliament approved the 2014 budget in which it expects its first surplus in a decade, 812 million euros, double the previous estimate. Although the surplus excludes debt payments, it may be likely the country will meet next year’s fiscal targets. Meanwhile, Greek bond yields have plunged to 8.28% from 25% in August.
While the European Commission expects Greece’s GDP to contract by 4.0% in 2013, this is still an improvement over the 7.1% decline in 2011 and its 6.4% contraction in 2012. Going forward, the Commission expects Greece’s GDP to grow 0.6% in 2014 and increase to 2.9% the following year. Last summer, the tourism industry staged a strong revival as it proves to be a much cheaper destination compared to other vacation spots.
However, the austerity measures have required the government to eliminate many public-sector jobs from Greece’s famously bloated bureaucracy. This transition to a sustainable model is causing much current dislocation. The unemployment rate jumped to 27% in 2013 and with the lending troika demanding more austerity from the government, it doesn’t look like this problem will get better in the very near term. But investors may be looking past these numbers.
According to the commission, “In 2015, the recovery is forecast to gain strength, as investment becomes the main engine of the recovery. … With consumption no longer being a drag, real GDP growth is projected…” Given how woefully awful the Greek economy was widely understood to be, this forecast is actually a fairly acceptable prospect.
Austerity Bites?
Clearly all three economies are still in a shambles. But given how wildly unsustainable the debt growth had become for all three the recent stabilization should be celebrated. Given their problems, it would have been impossible to conjure a pain free solution that stood a chance for the long term.
While economists such as Paul Krugman have been at the forefront of the chorus that says austerity doesn’t work, these measures have not stopped these countries from improving their fiscal positions while setting a sustainable course. Although unemployment remains high in Greece and Spain, the falling unemployment rate in Ireland shows that restored faith in government responsibility leads to investment. Krugman and his brethren are similarly wrong when it comes to the devastating effects that are supposedly delivered by deflation (also explored in the Newsletter).
The improvements in these “basket case” economies remind us of the emerging market economies that came out of the Asian debt crisis with a new lease on life. For those who can tolerate the risks and volatility, it may be a good time to look deeper.
Andrew Schiff is Director of Communications and Marketing at Euro Pacific Capital. Opinions expressed are those of the writer, and may or may not reflect those held by Euro Pacific Capital, or its CEO, Peter Schiff.
Subscribe to Euro Pacific’s Weekly Digest: Receive all commentaries by Peter Schiff, John Browne, and other Euro Pacific commentators delivered to your inbox every Monday!
Order a copy of Peter Schiff’s updated illustrated economic parable he co-wrote with his brother Andrew, How an Economy Grows and Why It Crashes – Collector’s Edition, and save yourself 32%!

BOB HOYE
PUBLISHED BY INSTITUTIONAL ADVISORS
JANUARY 22, 2014
Prime Corporate Bonds

– At the secular low for interest rates in the mid-1940s, the Zoot Suit had the image.
– Polyester “leisure” suits over-stayed their welcome until the 1981 secular high.
– At the recent extreme low, the “skinny” look for men’s suits is very “in”.
– Lower-grade prices are even more extreme and are vulnerable to a change in fashion.


BOB HOYE, INSTITUTIONAL ADVISORS – WEBSITE: www.institutionaladvisors.com

Buyer beware! This is not another “Buy The Dip” opportunity. Three weeks ago I wrote that the stock market was“Priced for Perfection” and at risk of a nasty correction. Last week I wrote that the Federal Reserve had “Rung A Bell” signaling a “Sea Change” in Market Psychology that would ripple across all assets. It was time to take profits and reduce leverage.
Well, here we go.
Stocks:
All stock markets…including the Emerging Markets rallied into Year-end 2013…from my perspective December was the “cherry on top” of the 5 year stock market rally…but Market Psychology has changed since the beginning of 2014…the Japanese market and the Emerging Markets have tumbled…New York has gone sideways while Canada and Europe have rallied…until last week.
Last week he DJIA was down 579 points (3.5%)…Transports were down over 300 points (4%) on Friday alone…the TSE fell 283 points (2%) from Thursday’s highs to Friday’s close…the Nikkei was down ~5% on the week…down ~8.5% YTD…the DAX hit All Time Highs mid-week and then fell ~400 points (4.2%) to Friday’s close. The iShares Emerging Markets ETF is down ~9% YTD. Several of the major stock market indices registered Weekly Key Reversals Down. I suspect that last week may have been a KEY TURN DATE (when Market Psychology makes a major turn across asset classes)…but it’s too early to tell.
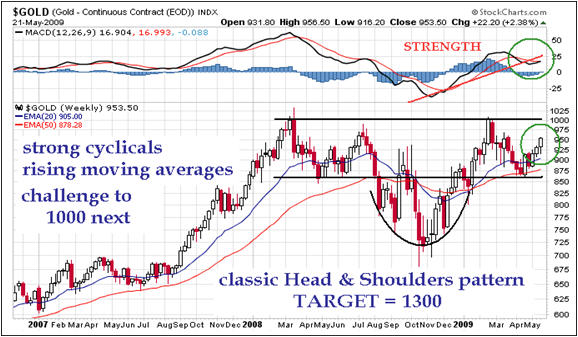
The S+P 500: The red trend line on the chart below starts in November 2012 when the market figured out that Abe was going to win the election and begin to implement his policies to end two decades of deflation in Japan…It’s been my view that the weak Yen and strong stock markets were two sides of the same coin. A break below the December 2013 lows (~1768 on the cash S+P) and/or a break of the red trend line could signal a leg down to the blue trend line…which began at the 2009 lows.

The Nikkei: The decline from the late December highs (which barely cleared the May 2012 highs before reversing) has come right back to the trend line off the Nov 2012 lows. The market broke hard last May/June (as the Yen bounced)…a bigger bounce in the Yen this time around would create a bigger tumble in the Nikkei.

Currencies:
The CAD traded below 90 cents last week for the first time since 2009…one year ago it was around 1.01 – 1.02…but the Turkish Lira is down over 10% in a month, the South Africa Rand is down 6% in a month, and the Argentine peso (official rate, not the black market rate) is down over 20% since January 1, 2014.


Japanese Yen: Huge short positions have been building against the Japanese Yen. If the Yen is indeed the other side of the strong stock market we could see a bigger short covering rally in the Yen than we saw in May/June 2013.

Interest rates:
US Treasury bond prices have soared since the beginning of the year (the yield on the 10 year has dropped from ~3.00% to ~2.70%) as capital seeks safety. Meanwhile “Junk Bonds”…which were bid aggressively higher as people “reached for yield” have collapsed. I have expected Treasuries to rally on a weak stock market…I have been skeptical of calls for the “collapse of the bond market.” However, a good rally in bonds may set up an opportunity to get short…but wait for it!


Metals:
Gold has rallied ~$90 from its Dec 31 lows…while copper has FALLEN from 3.42 to 3.26 in the same time period. It’s tempting to “see” a double bottom (June and December 2013) for gold…and gold may be making an important turn here…but as I wrote last week the better trade may be to buy gold against the stock market or other currencies…rather than against the USD.

Copper: If the December breakout above the $3.40 level was a “false breakout” then prices could be headed for $3.00…or lower.

Market Psychology:
Market Psychology has gone from “What, me worry?” to “Fear” very quickly.
The fear Index, the VIX had been trading at 7 year lows…it jumped last week to its highest weekly close since June 2013.

Key Turn Date:
A KEY TURN DATE may be developing across markets in January 2014…it “feels” like it’s been building for a couple of months…the “sea change” in Market Psychology across asset classes may be setting 2014 up for BIG moves…this is NOT another “buy the dip” opportunity.
Confidence:
Think of Market Psychology as a “Confidence” barometer…and remember that confidence waxes and wanes. When market participants are confident they become more aggressive in bidding markets higher. When they become “over-confident” they bid markets recklessly higher. When confidence wanes prices fall…with items that have been bid aggressively or recklessly higher falling the hardest.
Financial markets require confidence to sustain themselves. If confidence (in the government…in the currency) collapses, as it has in Zimbabwe, Venezuela or Argentina for instance, then prices don’t just fall they collapse.
by
Victor Adair – PI Financial Corp.
via Drew Zimmerman
Investment & Commodities/Futures Advisor
604-664-2842 – Direct
604 664 2900 –
604 664 2666 – Fax
800 810 7022 – Toll Free
PI Financial Corp. www.pifinancialcorp.com
____________________
DISCLAIMER
Due to the security risks involved in sending information over the Internet, PI Financial Corp. cannot be held responsible for ensuring the confidentiality and integrity of this e-mail message. This message is only intended for the use of the addressee and any other use is strictly unauthorized. Any opinions or recommendations expressed herein do not necessarily reflect those of PI Financial Corp. PI Financial Corp. cannot accept any orders via e-mail as the timely receipt of e-mail messages, or their integrity over the Internet, cannot be guaranteed.
NOTICE REGARDING PRIVACY AND CONFIDENTIALITY
PI Financial Corp. and its subsidiaries may, at their discretion, monitor and review the content of all email communications.
 When the bulls are running for the doors, that is a sign that we have hit bottom and wise investors should hold on to their portfolios for the ride up, says Silver-Investor.com Editor David Morgan in this interview with The Gold Report. It may take a couple of resource war-addled years for gold and silver prices to move back to profitable levels, but the right companies could make money all the way up.
The Gold Report: When we interviewed you last, you mentioned the possibility of “resource wars” in 2014 as referenced in Michael Klare’s book of the same title. What will that look like to the average investor?
David Morgan: The resource wars have already started. Look at Mexico. It has a resource that it covets very much, and that’s energy. That is why the government levied a new tax designed primarily at energy but subsequently adds a 7.5% royalty on mining profits. Is it a war? Not per se, but it is detrimental to companies that operate in Mexico today and in the future. I think we will see even more of this kind of thing in 2014.
TGR: Last year was a volatile year for precious metals prices with silver going below $20/ounce ($20/oz) and gold bobbing around $1,200/oz at the end of the year. Are we still three or four years from $100/oz silver as you said in your last interview? What’s going to push it to that level?
DM: What’s going to push it to that level are fundamentals. There is no change fundamentally in why investors would buy gold in 2001 compared to why they would buy gold in 2013 or 2014. The fundamental fact is that there isn’t a nation state on earth that has a handle on the debt problem. Because of that, we’re going to see more people wake up to the need for precious metals, because precious metals are true money outside the framework of the current system.
The correction we had in silver and gold isn’t that abnormal in a major bull market. I’ve been through one bull market already in my lifetime. I watched gold go from the fixed price of $42.22/oz up to $200/oz, then to sell off to around the $100/oz level. It later advanced all the way back to the peak of $850/oz in January 1980. I have seen the damage a big shakeout in a major bull market can have. That experience makes me a little bit more hardened to weather the storm we just experienced.
However, I think that the worst is over. I think silver has bottomed. Gold probably has as well. This year, 2014, will be a rebuilding year. Depending on what happens in the global economic system, it’s possible that we could even see a very good year for the metals, but I don’t anticipate that. I’m anticipating a rebuild year where silver climbs back over $30/oz and gold travels up well over $1,600/oz, probably to the $1,700/oz level or higher depending on how the economy unfolds.
TGR: Precious metals experienced a nice little bump at the beginning of the year. Of the companies now in the resources market, what percentage will live to see an upturn in the metals prices? How many are just on the edge right now?
DM: That’s a good question, but I’m probably not the best to ask because we focus mostly on top-tier and mid-tier companies, companies that are producers or near producers. We do study a great deal of the junior exploration sector, but suggest very few. If I would venture a guess, of the micro-cap companies—$0.5–3 million—probably half will survive, maybe fewer than that.
It has been very difficult in the precious metals sector over the last couple of years. Even some of the best companies—I am thinking of one recently that has one of the richest gold mines in the world—can be mismanaged. That is why with some of these companies I tell people to only risk money they can lose because the payoff can be great, but they can lose it all, too. And some of my readers thank me for it later. That happened just this morning.
TGR: You mentioned Mexico’s new tax. What impact is that going to have on producers large and small there? Are there some companies that could do well even with the new royalty burdens?
DM: Yes, there are. We’re still working on our white paper on the topic, but I can outline it in general terms. If you’re a major producer, the new Mexican tax is going to cut into the bottom line, but major producers will be able to adjust to still make a profit. For a mid-tier company, it could have more of an effect because the margins are less. But in the junior sector, after this tax is paid, it’s going to be touch and go in many cases. The smaller companies that have very little margin or would need to be producing for a few years to become profitable are not going to be able to start as easily because their breakeven analysis is pushed out farther. So, basically, if a company is currently producing with wide margins, it will be OK. But companies just getting started or very small producers are going to have a tougher time.
TGR: Do you see this mining tax as a permanent thing or will the government see the error of its ways and rescind it?
DM: I really don’t know. There may be too much political pressure to take it back in the short term. It might be altered somewhat, but I don’t think it will come off entirely.
TGR: We’ve had a lot of debate among some of our experts about the ideal ratio between gold and silver. If gold goes to $2,000/oz in 2014, do you believe silver will follow based on a specific ratio or do you see them working independently?
DM: I have studied this issue as much as anyone other than The Moneychangerauthor Franklin Sanders. A 45-foot long historic silver chart covering the last 4,500 years, where each foot would be 100 years, shows that only in the last 19 inches the silver-gold ratio would be above 16:1. The 4,400 years before that, it would be less than 16:1! So, from a long-term perspective it means silver is undervalued to gold. Yet, let us agree that for the current time frame it has much less meaning.
My point is that the ratio tells you which metal is doing better relative to each other. The ratio was 80:1 when the silver bull market started, and it’s basically 60:1 now. That means as volatile as silver has been, from the start of the bull market, if investors put the same amount of dollars into gold or silver, they would be better off putting it into silver. I’m not advocating that. I think investors should own both gold and silver. But, overall, I believe silver’s outperforming trend will continue.
Now Eric Sprott believes in the monetary classic ratio of 16:1 ratio and thinks the metal will eventually return to that level. I think the ratio will at least test where we’ve already been in this bull market, and that’s about a 35:1 ratio. We’ve already been there very, very briefly when silver did its big magic jump from $19/oz to $48/oz in 2011. In the meantime, we’re looking at more volatility.
TGR: What message did you give people at the Cambridge House Investment conference in Vancouver?
DM: The bull market is not over and it’s normal in these secular bull markets to shake off some bulls and reach the status that we are currently at where the sentiment is very low. There is a lot of distrust and a lot of people are questioning whether they should be in the sector. Those are signs that the bottom is in. Now is the time, for those not in the sector, to get in. For those already in, either hold what they have, add to their position or ride it out. A couple of years from now we’re going to see much higher prices in the precious metals. Three or four years out, it may be overvalued in real terms, but that remains to be determined.
TGR: Thanks, David, for your insights and time.
David Morgan (www.Silver-Investor.com) is a widely recognized analyst in the precious metals industry; he consults for hedge funds, high net-worth investors, mining companies, depositories and bullion dealers. He is the publisher of The Morgan Report on precious metals, the author of “Get the Skinny on Silver Investing” and a featured speaker at investment conferences in North America, Europe and Asia.
DISCLOSURE:
1) JT Long conducted this interview as an employee of The Gold Report.
2) Streetwise Reports does not accept stock in exchange for services. Interviews are edited for clarity.
3) David Morgan: I was not paid by Streetwise Reports for participating in this interview. Comments and opinions expressed are my own comments and opinions. I had the opportunity to review the interview for accuracy as of the date of the interview and am responsible for the content of the interview.
4) Interviews are edited for clarity. Streetwise Reports does not make editorial comments or change experts’ statements without their consent.
5) The interview does not constitute investment advice. Each reader is encouraged to consult with his or her individual financial professional and any action a reader takes as a result of information presented here is his or her own responsibility. By opening this page, each reader accepts and agrees to Streetwise Reports’ terms of use and full legal disclaimer.
6) From time to time, Streetwise Reports LLC and its directors, officers, employees or members of their families, as well as persons interviewed for articles and interviews on the site, may have a long or short position in securities mentioned and may make purchases and/or sales of those securities in the open market or otherwise.
Streetwise – The Gold Report is Copyright © 2014 by Streetwise Reports LLC. All rights are reserved. Streetwise Reports LLC hereby grants an unrestricted license to use or disseminate this copyrighted material (i) only in whole (and always including this disclaimer), but (ii) never in part.
Streetwise Reports LLC does not guarantee the accuracy or thoroughness of the information reported.
Streetwise Reports LLC receives a fee from companies that are listed on the home page in the In This Issue section. Their sponsor pages may be considered advertising for the purposes of 18 U.S.C. 1734.
Participating companies provide the logos used in The Gold Report. These logos are trademarks and are the property of the individual companies.


-
I know Mike is a very solid investor and respect his opinions very much. So if he says pay attention to this or that - I will.
~ Dale G.
-
I've started managing my own investments so view Michael's site as a one-stop shop from which to get information and perspectives.
~ Dave E.
-
Michael offers easy reading, honest, common sense information that anyone can use in a practical manner.
~ der_al.
-
A sane voice in a scrambled investment world.
~ Ed R.
Inside Edge Pro Contributors

Greg Weldon

Josef Schachter

Tyler Bollhorn

Ryan Irvine

Paul Beattie

Martin Straith

Patrick Ceresna

Mark Leibovit

James Thorne

Victor Adair