
Stocks & Equities
 What I recommend to clients and what I do with my own portfolio aren’t always the same. That said, my first recommendation is to short the Russell 2000. You can use the iShares Russell 2000 exchange-traded fund [IWM]. Small stocks have outperformed large stocks significantly in the past few years.
Next, I would buy 10-year Treasury notes, because I don’t believe in this magnificent U.S. economic recovery. The U.S. is going to turn down, and bond yields are going to fall. Abby just gave me a good idea. She is long the iShares MSCI Mexico Capped ETF, so I will go short.- in 2014 Barron’s roundtable
also:
“I have no faith in paper money, period. Next, insider buying is also high in gold shares. Gold has massively underperformed relative to the S&P 500 and the Russell 2000. Maybe the price will go down some from here, but individual investors and my fellow panelists and Barron’s editors ought to own some gold.” – in fxstreet.com
They are going to bankrupt the world. Mr. Bernanke said the intention of QE3, which then turned into QE4, was to lower long-term bond yields.
As it happened, yields on Treasury notes and bonds bottomed on July 25, 2012, and have been rising since. The policy was a failure.
World Central Banks Are Going To Bankrupt The World!
About Marc Faber
Dr Marc Faber was born in Zurich, Switzerland. He went to school in Geneva and Zurich and finished high school with the Matura. He studied Economics at the University of Zurich and, at the age of 24, obtained a PhD in Economics magna cum laude. Between 1970 and 1978, Dr Faber worked for White Weld & Company Limited in New York, Zurich and Hong Kong. Since 1973, he has lived in Hong Kong. From 1978 to February 1990, he was the Managing Director of Drexel Burnham Lambert (HK) Ltd. In June 1990, he set up his own business, MARC FABER LIMITED which acts as an investment advisor and fund manager.
Dr Faber publishes a widely read monthly investment newsletter “The Gloom Boom & Doom Report” report which highlights unusual investment opportunities, and is the author of several books including “ TOMORROW’S GOLD – Asia’s Age of Discovery” which was first published in 2002 and highlights future investment opportunities around the world.
“TOMORROW’S GOLD” was for several weeks on Amazon’s best seller list and is being translated into Japanese, Chinese, Korean, Thai and German. Dr. Faber is also a regular contributor to several leading financial publications around the world. A book on Dr Faber, “RIDING THE MILLENNIAL STORM”, by Nury Vittachi, was published in 1998. A regular speaker at various investment seminars, Dr Faber is well known for his “contrarian” investment approach. He is also associated with a variety of funds and is a member of the Board of Directors of numerous companies. Website: please click HERE.

The proposed Keystone XL pipeline cleared a key hurdle today with a government study that found its impact on the climate would be minimal, which supporters said meets President Barack Obama’s test for allowing the project to be built.
In its final environmental review, the U.S. State Department found the Canada-U.S. oil pipeline would not greatly increasecarbon emissions because the oil sandsin Alberta will be developed anyway.
The study, while not the final word, is important because Obama has said he wouldn’t approve Keystone if it would exacerbate carbon pollution. Now the pipeline’s fate comes down to broader questions about whether the project is in the U.S. national interest, weighing matters such as energy needs and diplomatic relations. – Full Article HERE
Related: This Is Not the Keystone Decision That You Think It Is

CNBC’s “By the Numbers” recently reviewed the predictive power of the January Barometer with the following observations:
“The January barometer has been right in 62 of the last 85 years, or 73 percent of the time. Since 1929, the index followed January’s direction 80 percent of the time when it finished positive, and 60 percent of the time, when it finished negative.
More recently, in the past 35 years, the S&P 500 (SPY) followed January’s direction 25 times, or 71 percent of the time…”
I was happy to see that the first set of observations segmented the analysis by up and down January months. I was puzzled why the analysis of the last 35 years did not include the same segmentation…until I reviewed the table the article provided for readers to see the numbers for themselves.
The past 35 years have been VERY bullish in terms of the number of up years. Thus it should come as little surprise that it is very difficult to find a good barometer for a down year. There have only been eight down years in the past 35 years. This elite group includes 2011 which was down a fraction at -0.003%. Of these elite eight years, only five (63%) January months were also down. So flip one negative January around – say 2002 where January delivered a -1.56% performance – and suddenly the odds are just 50/50 that a down year includes a down January. Even more telling is that in these 35 years, January closed down 12 times, yet, in those years, the S&P 500 closed the year down only FIVE times! This history of just 42% correct is much worse than the 60% cited over the last 85 years. These are poor betting odds for concluding that 2014 will be a down year because January this year delivered a -3.6% performance.
I am not sure why 35 years is considered recent, but I prefer to go back to 1951 when I play with these kinds of historical relationships. I find it convenient to look at the post-war period with a few years of buffer from the end of World War Two. When I look at THIS slice of time, the January barometer is even less convincing for down years or for down months of January.
The scatter plot below charts annual price change of the S&P 500 on the y-axis and the monthly price change for January on the x-axis.
The red, vertical line shows where January, 2014 performed. Note that there have only been three years since 1951 where January performed similar to 2014. Two of those three years ended up delivering gains for the entire year: January was an opportunity to buy the dip.
The green diagonal line marks where January and the S&P 500 perform exactly the same. Above that line are years where buying at the end of January still delivered gains at the end of the year. Below that line is where buying at the end of January delivered a loss for the year. Here again, January’s predictive powers are suspect. There are 24 years where January closed down for the month. Buying at the end of January in thirteen, or just over half, of those years would get you at least even by the end of the year. Similarly, in just thirteen of those years did the S&P 500 also decline. Move your eyes to the right half of the graph where January closes the month up, and it is very obvious that the vast majority of up months of January lead a positive year.
The overall correlation between January’s performance and performance for the year is only 0.55 – and remember the annual performance in this correlation includes January’s performance! The correlation between January’s performance and performance for the rest of the year (the remaining eleven months) is ONLY 0.28.
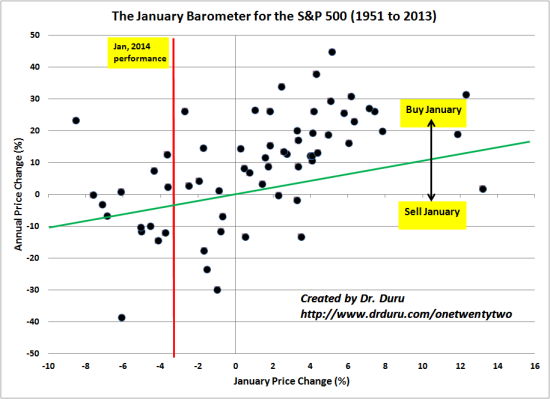 The January Barometer for the S&P 500 (1951 to 2013)
Source for prices: Yahoo Finance
In other words, celebrate when January is up. Cross your fingers (or roll the dice) when January is down…or choose a timeframe for analysis that makes you feel more comfortable.
The likely reason why people even pay attention to the January barometer is that negatively performing years for the S&P 500 tend to be VERY bad, disastrous even. The one year everyone wish they heeded the call of January was of course 2008 when January closed with a -6.1% performance and the year closed with a -38.5% performance, the absolute worst year almost anyone still active in the stock market can remember…
Be careful out there!
Additional disclosure: I am long SSO through call options, and I also own SSO put options.

 Dow Long Term Danger Chart Analysis
Gold $1278 Key Price Chart Analysis
Silver Cup & Handle Chart Analysis
Gold Stock Key Breakout Chart Analysis
Thanks,
Morris
Super Force Signals
A Leading Market Timing Service
We Take Every Trade Ourselves!
Email: trading@superforcesignals.com
Morris Hubbartt
Jan 31, 2014
“Our main format is now video analysis…
Unique Introduction For Web Readers: Send me an email to alerts@superforcesignals.com and I’ll send you 3 of my next
Super Force Surge Signals free of charge, as I send them to paid
subscribers. Thank you!
The Super Force Proprietary SURGE index SIGNALS:
25 Super Force Buy or 25 Super Force Sell: Solid Power.
50 Super Force Buy or 50 Super Force Sell: Stronger Power.
75 Super Force Buy or 75 Super Force Sell: Maximum Power.
100 Super Force Buy or 100 Super Force
Sell: “Over the Top” Power.
Stay alert for our Super Force alerts, sent by email to subscribers, for both the daily charts on Super Force Signals at www.superforcesignals.com and for the 60 minute charts at www.superforce60.com
About Super Force Signals:
Our Super Force signals are created thru our proprietary blend of the highest quality technical analysis and many years of successful business building. We are two business owners with excellent synergy. We understand risk and reward. Our subscribers are generally successful business owners, people like yourself with speculative funds, looking for serious management of your risk and reward in the market.
Frank Johnson: Executive Editor, Macro Risk Manager.
Morris Hubbartt: Chief Market Analyst, Trading Risk Specialist.
Email:
Mail:
SFS Web Services
1170 Bay Street, Suite #143
Toronto, Ontario, M5S 2B4
Canada


-
I know Mike is a very solid investor and respect his opinions very much. So if he says pay attention to this or that - I will.
~ Dale G.
-
I've started managing my own investments so view Michael's site as a one-stop shop from which to get information and perspectives.
~ Dave E.
-
Michael offers easy reading, honest, common sense information that anyone can use in a practical manner.
~ der_al.
-
A sane voice in a scrambled investment world.
~ Ed R.
Inside Edge Pro Contributors

Greg Weldon

Josef Schachter

Tyler Bollhorn

Ryan Irvine

Paul Beattie

Martin Straith

Patrick Ceresna

Mark Leibovit

James Thorne

Victor Adair