
Stocks & Equities
Twitter Inc’s shares fell almost 25 percent on Thursday, wiping out about $9.8 billion in market value, after the company reported a sharp slowdown in user growth.
The stock, which debuted at $26 in November, hit a low of $50 in early trading. The shares hit a peak of $74.73 in late December as investors bet that the social media platform could become as ubiquitous as Facebook.
Analysts, unlike investors, were divided on the company’s outlook a day after it reported fourth-quarter results. – full article HERE

Figure 1 is a weekly chart of the SP500 with the $VIX data hidden. The indicator in the lower panel assesses the current value of the $VIX relative to pass swing points in that data. There are two points worth making.
TACTICAL BETA is 100% FREE — QUANTITATIVE STRATEGIES on GOLD, BONDS, EQUITIES — GO NOW!
WEEKLY
Since April, 2013 the indicator has been diverging negatively from the price action. (I have been making this point since September, 2013; see this video.) The failure of the $VIX to break below a value of 12 and the failure of the indicator to confirm the highs in price are noteworthy. These distortions are now being corrected. The indicator is rolling over, and a bottom in prices won’t be achieved until the indicator hits bottom as well. This is several weeks away. Thus the trend in prices is down.
(For the record this is what I said on January 14: “The $VIX has failed to break 12 or rather more importantly, a level of 12 continues to be where selling in the equity markets takes place. I have contended that the inability of the $VIX to break below the 12 level is a sign that the current market rise is not sustainable, and this divergence has been going on for over 6 months now. In essence, the $VIX has failed to confirm the price action. More importantly, it appears that the rocky start by the equity markets this week will see the $VIX close above a prior key pivot point. This always suggests caution as the possibility of a trend change in the equity markets is very real.”)

DAILY
But there is hope!!
Figure 2 is a daily chart of the SPY with the $VIX data in the lower panel. The $VIX is sitting at a level where 4 out of the 6 short term/ intermediate term bottoms took hold in 2013. Will 2014 be the same? This is the test for the $VIX and the markets. Look for the markets to put up a fight, but from this perspective, the tide has already turned.
TACTICAL BETA is 100% FREE — QUANTITATIVE STRATEGIES on GOLD, BONDS, EQUITIES — GO NOW!

Understanding the charts:
Due to popular demand, we have added Palladium to the list of Analytical Charts that Metals Analyst Jim Wyckoff features.
Sharpening Your Trading Skills: Using Bollinger Bands
Sharpening Your Trading Skills: The MACD Indicator
Sharpening Your Trading Skills: Moving Averages
Sharpening Your Trading Skills: The Relative Strength Index (RSI)
“Wyckoff’s Market Rating” System Explained

By Jim Wyckoff, contributing to Kitco News; jwyckoff@kitco.com

Hedge funds raised bullish gold (COMEX:GCJ14) wagers by the most since July and sold copper (COMEX:HGH14) holdings as emerging-market turmoil boosted concern the global economy will slow and increased demand for precious metals as a haven.
The net-long position in gold jumped 40% to 60,672 futures and options in the week ended Jan. 28, U.S. Commodity Futures Trading Commission data show. Long wagers rose 5.5% to the highest since September, and short bets dropped 16%. Net-bullish copper holdings tumbled 62% as shorts gained by the most in 11 weeks.
About $1.9 trillion was erased from the value of global equities last month as China’s economy slowed and the Federal Reserve further cut stimulus on Jan. 29. South Africa’s central bank increased interest rates, Turkey more than doubled them and Argentina’s peso dropped 19% against the dollar in January, more than any other currency tracked by Bloomberg. The tumult drove gold to its first monthly gain since August and copper to the worst start to a year since 2010.
“China rules the copper market, and it’s obvious that there are no reasons for this market to move higher as supply is ample, and demand is sluggish,” said Peter Jankovskis, who helps oversee $3.5 billion as co-chief investment officer of Lisle, Illinois-based OakBrook Investments LLC. “Gold, on the other hand, is seeing some buying given the turmoil in many countries, but what remains to be seen is if the rally can sustain in the face of tapering.”
Gold Rally
Gold futures gained 3.1% last month to $1,239.80 an ounce, while copper dropped 5.9% on the Comex in New York. The Standard & Poor’s GSCI Spot Index of 24 commodities fell 1.6%. The MSCI All-Country World Index of equities declined 4.1%. The Bloomberg Dollar Spot Index, a gauge against 10 major trading partners, rose 1.2%. The Bloomberg Treasury Bond Index climbed 1.8%.
Net wagers across 18 U.S.-traded commodities rose 6.5% to 782,818 contracts last week, the highest since October, the CFTC data showed.
The U.S. Mint sold 91,500 ounces of gold coins last month, the most since April, joining counterparts from Australia to Europe in reporting higher demand. Prices rebounded more than 5% since reaching a 34-month low in June as physical buying rose. Bullion shipments to China from Hong Kong in 2013 more than doubled to a record 1,108.8 metric tons from a year earlier, according to customs data. Gold futures for April delivery rose 1.6% to $1,259.50 at 1:48 p.m. in New York.
Copper Supplies
 Copper stockpiles monitored by the Shanghai Futures Exchange jumped 18% last month, the first increase since October. Global production will outstrip use by 167,000 tons this year, following a deficit of 137,000 tons in 2013, Barclays Plc estimates. The London Metal Exchange Index of the six main metals traded on the bourse fell 3.7% last month, the worst start to a year since 2010.
The economy in China, the world’s biggest consumer of everything from copper to cotton to pork, will expand 7.4% this year, the slowest pace since 1990, a Bloomberg survey showed.
Robust growth in the U.S. will help stem declines for industrial metals, and the rally in gold will be short-lived, according to James Paulsen, the Minneapolis-based chief investment strategist at Wells Capital Management, which oversees about $340 billion in assets.
Fed Stimulus
U.S. household purchases, which account for about 70% of the economy, climbed more than expected in December, Commerce Department figures showed Jan. 31. The Fed last week cut its monthly bond purchases to $65 billion from $75 billion, a second straight $10 billion cut. Goldman Sachs Group Inc. is forecasting more declines for gold after it fell 28% last year. Prices will reach $1,050 in the next 12 months, the bank said in a Jan. 12 report.
Bullion holdings through exchange-traded products fell 33% in the past year, erasing about $71 billion from the value of the funds.
“What we are seeing is broadening of economic growth, and and China is not contracting — the growth rate has slowed, but it’s still growing,” Paulsen said. “Industrial metals may slowly see an upturn once the turmoil in emerging markets calms. At that point, there will not be much upside for gold.”
Goldman View
Banks from Goldman to Citigroup say raw materials are heading for more losses in 2014 as rising supplies and slowing demand compound slumps that led to bear markets last year in gold, copper and corn. The super cycle that led commodities to almost quadruple since 2001 is reversing, with prices set to drop 3% in 12 months, Jeffrey Currie, Goldman’s head of commodities research, said in the Jan. 12 report. The asset class will be a “wallflower” compared with equities, Citigroup said in a Jan. 6 note.
Bullish bets on crude oil climbed 13% to 260,282 contracts, the biggest gain since July, government data show. Prices dropped 0.9% in January, the fourth loss in five months. The U.S. is extracting the most oil since 1989 as producers tap shale-rock formations, cutting costs for refiners and driving fuel prices at the pump down 9.7% since March.
A measure of speculative positions across 11 farm goods slid 0.3% last week, the CFTC data show. The S&P GSCI Agriculture Index of eight components dropped 1.3% in January, after a 22% decline in 2013 that was the biggest annual slump since 1981.
Wheat Bears
Investors became more bearish on wheat, boosting their net- short position, or bets on a decline, to 62,501 contracts. That compares with 56,571 a week earlier. Global production will reach 707 million tons in the season that ends in 2014, higher than a November forecast of 698 million tons, because of improving harvests from Canada to China, the London-based International Grains Council said Jan. 30.
The net-short coffee position reached 5,454 contracts, compared with 2,755 a week earlier. Arabica-coffee prices surged 9.4% last week, entering a bull market on Jan. 31, as dry weather threatened production in Brazil, the world’s top grower and exporter.
“The time when people were buying anything has moved, and now people are taking a view on individual commodities,” said Frances Hudson, a strategist at Standard Life in Edinburgh, which oversees $294 billion. “The super cycle has ended. The story for copper is neutral. The days of seeing high numbers from China may be ending. People saw gold was oversold last year, and money was moving to equities. There has been some reshuffle, but I don’t think there has been a reversal of fortune for gold.”

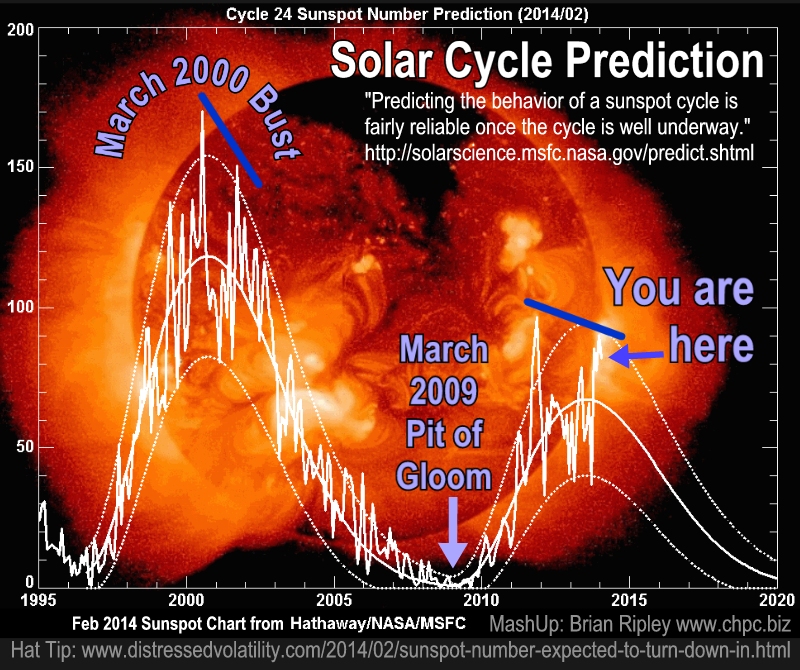
“Predicting the behavior of a sunspot cycle is fairly reliable once the cycle is well underway.” MSFC-NASA
“My opinion is that we are heading into a Maunder Minimum,” saidMark Giampapa, a solar physicist at the National Solar Observatory (NSO) in Tucson, Arizona. “I’m seeing a continuation in the decline of the sunspots’ mean magnetic field strengths and a weakening of the polar magnetic fields and subsurface flows.”
Meanwhile a sudden flight to lower yields via up ticking CPI and global equity valuation fear. Notice the TSX Real Estate index has been in a trading range since the summer of 2012 and has failed to break through the spring 2013 top. It’s similar to the Canadian real 10 year yield and if that plunges with more CAD dollar sell off, we will probably see more unwillingness to subsidize equity positions, and real estate appraisers (and margin clerks) will become busy again. DIY here.

…more articles HERE


-
I know Mike is a very solid investor and respect his opinions very much. So if he says pay attention to this or that - I will.
~ Dale G.
-
I've started managing my own investments so view Michael's site as a one-stop shop from which to get information and perspectives.
~ Dave E.
-
Michael offers easy reading, honest, common sense information that anyone can use in a practical manner.
~ der_al.
-
A sane voice in a scrambled investment world.
~ Ed R.
Inside Edge Pro Contributors

Greg Weldon

Josef Schachter

Tyler Bollhorn

Ryan Irvine

Paul Beattie

Martin Straith

Patrick Ceresna

Mark Leibovit

James Thorne

Victor Adair