
Stocks & Equities
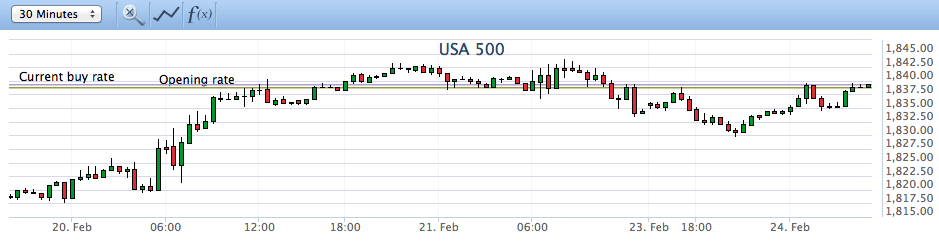
The S&P 500 has hit new All Time Highs this morning trading up to 1851.50 this morning. The S&P broke through the high of 1846.50 set on the last day of trading in 2013.
Drew Zimmerman
Investment & Commodities/Futures Advisor
604-664-2842 – Direct
604 664 2900 – Main
604 664 2666 – Fax
800 810 7022 – Toll Free

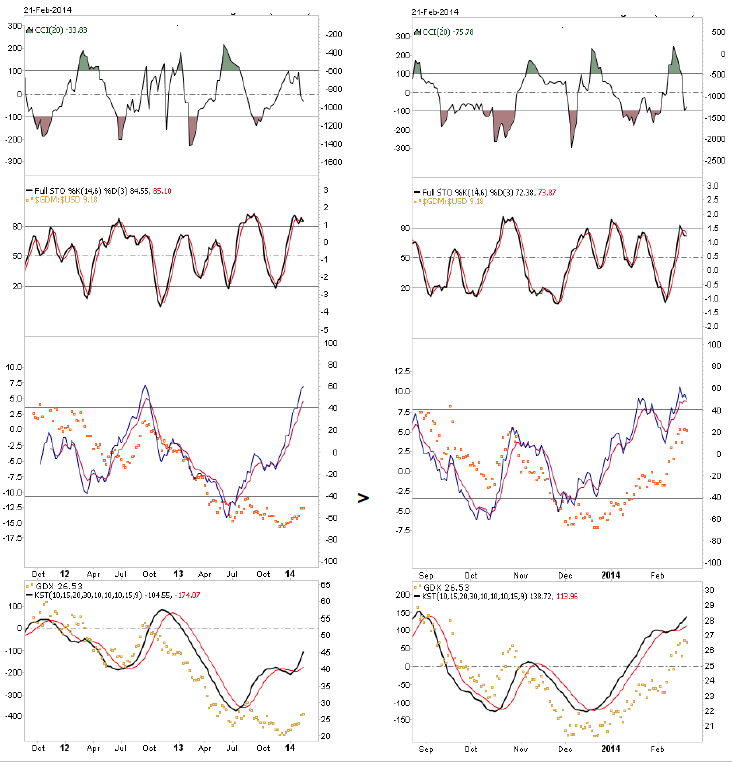
Below (LEFT) the WEEKLY, about 5X more powerful, than the DAILY BELOW (RIGHT)
Thus we see that BOTH are in HIGH position but not BLOWING off as 1 of the momentum measures has already topped out
and moved down in both the Weekly & Daily charts, giving both relative and absolute room upside. Thus, the picture
to me, hints that corrections will be flat, lazy and meandering without serious downward penetrations. So far, so good!!
(click on chart for larger view)
….for the entire 2 page analysis go HERE

Over the past few weeks, emerging markets have taken a hit. Currencies from the Russian ruble and the Thai baht to the Brazilian real have fallen sharply against the U.S. dollar.
Stock markets from Mexico and Asia to South Africa have also taken a nosedive, with the CBOE Emerging Market ETF losing as much as 24 percent of its value since the end of January.
As a result, everyone is now expecting another emerging market crisis, one they say will throw the entire globe into financial panic.
I disagree. 100 percent. The reasons are simple:
First, at its root, past emerging market crises were largely the result of large external debts, little or no foreign exchange reserves, very weak economic growth, intentional currency depreciation, and corporate and bank failures.
 Most of those forces aren’t present today. Most emerging markets have reduced their external debts, which are now far less a percentage of gross domestic product (GDP) than they are in the developed countries of Europe and the United States.
In addition, most emerging market economies now have healthy foreign exchange reserves, even after the recent bout of selling and capital outflows.
As to currency depreciation, naturally, there’s been some of that. But it’s entirely different from the currency collapses of the last emerging market crisis.
Most emerging market currencies now float. During the last crisis, most currencies were pegged to the dollar and were seriously overvalued. So when emerging markets could no longer defend the pegs, naturally, massive devaluations occurred.
Second, most emerging market stock markets have already experienced rather large setbacks, anticipating the current market turbulence in the developed markets.
As a result, key equity markets in China, Brazil, Vietnam, India, Indonesia, Malaysia and even Thailand are bouncing along the bottom, forming long-term support levels, from which they can vault higher.
In fact, the MSCI Emerging Markets Index is trading at roughly 11 times reported earnings — a 40 percent discount versus the MSCI World Index, according to recent data from Bloomberg. That’s the widest gap since October 2008, which indicates emerging markets are undervalued.
Meanwhile, the equity markets of the U.S. and especially Europe, are largely overvalued and in topping formations.
Third, most emerging countries have budget surpluses and trade surpluses. In addition, their foreign currency debt as a percentage of GDP is way below levels seen during the emerging market crisis of 1997-98.
According to the most recent data, for instance, Brazil’s foreign currency debt as a percentage of GDP has fallen from 26 percent in 1996 to 17 percent today.
Indonesia’s, from 30 percent to 20 percent. Thailand’s, from 51 percent to 19 percent. Russia’s, from 19 percent to 13 percent.
This is not the kind of foreign currency debts that are indicative of a full-blown crisis, especially given the fact that in general, emerging market economies have far healthier balance sheets than the Western developed economies of the U.S and Europe.
Another important consideration: In past emerging market crises, the U.S. dollar soared against all currencies. That is not happening today. Indeed, the U.S. dollar remains weak against the euro, the Swiss franc, the British pound and even against the stronger Norwegian currencies.
Bottom line: Though there have certainly been capital outflows out of emerging markets, I do not see an emerging market crisis on the horizon.
Instead, I see buying opportunities shaping up.
I particularly like Singapore and believe it or not, Thailand. Singapore is forming a nice bottom, while in Thailand, even in the midst of its political crisis, the Thai Set has held major monthly support at the 1271 level.
Lastly, there’s another key market that I watch that often signals an emerging market crisis in advance: Gold. Yes, gold has rallied. But on my systems, gold has not even generated a weekly buy signal yet, nor a monthly buy signal.
In addition, the recent gold rally occurred with declining volume, and declining open interest in the futures market. That, and a host of other indicators I watch, tell me that gold’s recent rally is a bear market rally, and not the start of a new bull market.
If we were truly seeing an emerging market crisis, gold would be performing better.
Overall, market volatility in nearly all asset classes around the world will certainly be rising in the months ahead, but not because of the emerging markets. Instead, it will be due to what’s happening in the Western world, especially Europe.
Make no mistake about it: Though it may not seem that Europe is the problem, I can assure you it is. Just look at what’s happening in the Ukraine, where a full-blown civil war has broken out.
Europe is sinking deeper and deeper into a depression. Unemployment continues to rise, banks in Europe are getting weaker and weaker, and the strength in the euro is not a sign of health. Rather, it’s a sign of severe deflation taking root in Europe, a force that will eventually cause Europe to meltdown.
I urge all investors to stay out of European equity and bond markets. That’s where the real crisis is. When everyone begins to realize it, capital outflows from emerging markets will turn into capital inflows.
Stay safe right now. Several markets are reaching critical turning points and once the trends clear up, there will be wonderful trading opportunities.
Best wishes,
Larry
– See more at: http://www.swingtradingdaily.com/2014/02/24/emerging-market-crisis-not-likely/#sthash.rQF5Wnkb.dpuf
Dave Lutz of Stifel, Nicolaus talks about the big things traders are talking about today:
Good Morning! US Futures are slightly higher, but off best levels as E-Minis failed 1840 overnight. Headlines from the G20 are equity supportive over the weekend, as they shift from Austerity to growth, while blessing the BOJ’s easing operations as ECB’s Draghi sparks a dovish tone into their next meeting. Focus remains on EM, where Ukraine is in rally mode on bailout indications – which has CDS dropping for all the EM markets on my monitor. UK/European markets are mixed this AM, with the FTSE under pressure as HSBC is hit (#s) – The DAX is off small, but volumes there are almost 30% below recent averages. The EU fins are in rally mode, as Spain is upgraded by Moody’s, and Soros indicates he’s a buyer of the sector. In Asia, Japan was off small – but Shanghai posts it’s biggest loss in 2 months as concerns about a cooling property market weighed. While ever sector in China was under pressure, globally Banks staged a decent overnight, Industrials in Germany outperformed (better Ifo), and the miners down under continue their recent outperformance.
The 10YY is lower in the US, and back below the 100dma, despite headlines from FT and Barron’s about the “cooling” sentiment towards the bond market. While the Yen has a slight bid, the $ is in rally mode against € (Draghi Comments as EU’s CPI prints weak). With the DXY flat, no impact on commodities- but fresh “polar vortex” headlines has Nat Gas surging 5% into Wednesday’s expiry as traders scramble to get inventory for March delivery. The G20 growth headers have a bid under metals – with Silver adding 1.4% and gold hitting 4month peaks. Copper is having it’s worst day in a month on headlines from China talking reduced credit for housing. Coffee remains in moonshot, adding another 3% (up 55% over the last week) as Brazil drought continues the upward momentum. Scheduled Catalysts today include Chicago and Dallas Fed at 8:30, Greenspan Speaks at 8:45, a decent size POMO at 11 – and EM eyes will be on Brazil’s Trade Balance at 1. This week brings Multiple Fed Speakers, including Yellen at Senate; Heavy Japan Data – PMI, Employment, CPI, Retail, IP, Housing; Housing Data – Case Shiller, New and Pending Home Sales; the Monthly Russell Rebalance, and the MSCI Quarterly Review on Friday, ahead of China Manufacturing late Friday night
“The trade has been profitable in 16 of the past 18 periods including nine of the last ten periods” – Don Vialoux
Gasoline prices are hitting their ‘sweet spot’. Boost your exposure with this ETF
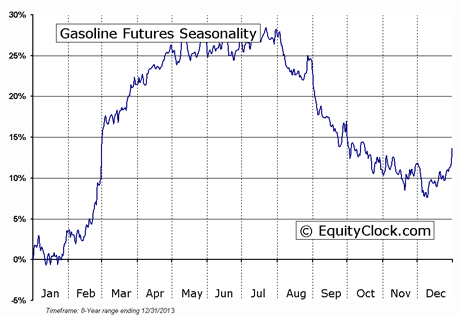
Gasoline prices traditionally move higher from the end of January to the end of May. What are prospects this year?
Gasoline prices move higher during their period of seasonal strength mainly because of two annual recurring events. North American refiners switch their production from heating oil into gasoline for the summer driving season. During this period, production temporarily is shut down and inventories drop. In addition, refiners normally complete their annual maintenance during the conversion period. If something is going to go wrong, it usually happens during the annual maintenance period. North American refineries are old and require an increasing amount of maintenance.
The “sweet spot” for wholesale U.S. gasoline prices is from the end of January to the end of April. The trade has been profitable in 16 of the past 18 periods including nine of the last ten periods. Average gain per period during the past 18 “sweet spots” was 16.8 per cent.
Tip off for timing of the start of “sweet spot” is a seasonal peak in gasoline inventories normally between the last week in January and the second week in February. This year, gasoline inventories peaked in the last week in January.
Prospects for an upside move in gasoline prices this year are above average despite a decline in demand due to the improving fuel efficiency of North American autos. Feedstock for gasoline is crude oil. Crude oil prices already have increased by almost 5 percent since the end of January and established an intermediate uptrend earlier this week. On average, crude oil prices during the past 20 periods from the end of January to the end of April have increased 10 per cent. In addition, a colder-than-average winter will prompt refiners to postpone timing for conversion from heating oil production to gasoline, thereby increasing the possibility of a gasoline shortage this spring.
Look for the average retail price of gasoline in the U.S. to advance from $3.35 (U.S.) to over $3.75 per gallon by the official start of the U.S. driving season on the U.S. Memorial Day holiday near the end of May. An equivalent change in the price of gasoline in Canada is also anticipated. Assuming no change in the Canadian dollar relative to the U.S. dollar, the price of gasoline in the Greater Toronto Area is expected to rise from $1.31 (Cdn) to $1.45 per litre.
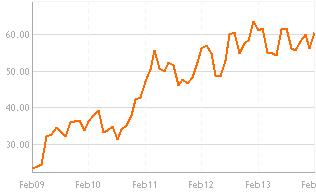
On the charts, wholesale gasoline prices at $2.85 (U.S.) per gallon and their related ETF have a positive technical profile. Yesterday, the ETF broke above resistance on higher than average volume to reach a six month high. Last week, gasoline moved above its 20, 50 and 200-day moving average. Strength relative to the S&P 500 index turned positive at the beginning of February.
A direct way to invest is through the United States Gasoline Fund, LP (UGA), an exchange-traded note based on gasoline futures and short term notes.
Ed Note: Don’s Monday report is highly recommended to read/scan, as it lays out all of the economic news for the week and analyses 45 different markets and charts.

Don and Jon Vialoux are the authors of free daily reports on equity markets, sectors, commodities and Exchange Traded Funds. They are also research analysts at Horizons Investment Management, offering research for the Horizons Seasonal Rotation ETF (HAC-T). All of the views expressed herein are their personal views, although they may be reflected in positions or transactions in the various funds managed by Horizons Investment. Horizons Investment is the investment manager for the Horizons family of ETFs. Daily reports are available at http://TimingTheMarket.ca/ andhttp://EquityClock.com.

-
I know Mike is a very solid investor and respect his opinions very much. So if he says pay attention to this or that - I will.
~ Dale G.
-
I've started managing my own investments so view Michael's site as a one-stop shop from which to get information and perspectives.
~ Dave E.
-
Michael offers easy reading, honest, common sense information that anyone can use in a practical manner.
~ der_al.
-
A sane voice in a scrambled investment world.
~ Ed R.
Inside Edge Pro Contributors

Greg Weldon

Josef Schachter

Tyler Bollhorn

Ryan Irvine

Paul Beattie

Martin Straith

Patrick Ceresna

Mark Leibovit

James Thorne

Victor Adair