
Gold & Precious Metals
Gold’s strong rebound upleg this year has been driven by big gold-futures buying. After abandoning gold last year, American futures speculators are returning to the yellow metal in droves. These capital inflows are a very bullish harbinger, as major futures buying is the primary fuel for young gold uplegs before investors return to take the baton. And this big gold-futures buying is likely less than half done!
From a pure fundamental supply-and-demand standpoint, gold’s crushing losses last year were solely attributable to record gold-ETF selling by stock traders. The World Gold Council’s comprehensive 2013 data showed that global gold-ETF outflows from epic share selling was actually a third greaterthan the total worldwide drop in gold demand! Without those extreme gold-ETF liquidations, gold wouldn’t have plunged.
Thankfully stock traders are just starting to buy gold-ETF shares again, resulting in capital inflows from the stock markets to gold for the first time in over a year. This critical mean reversion of investor interest in gold has barely even begun. So far, the flagship American GLD gold ETF has only recovered 1/25th of its bullion hemorrhaged in 13 months ending in January! Investors are driving this new gold-ETF holdings recovery.
But a major secondary factor in gold suffering its worst loss in a third of a century last year was record futures selling. In the first half of 2013, American futures speculators dumped gold at blistering sustained rates. Provocatively as soon as their outsized selling peaked mid-year, gold prices stabilized even though the heavy gold-ETF liquidations continued. Futures trading dominates global gold-price action!
There are multiple reasons for this. While gold trades universally in physical form, the actual prices vary slightly. The American gold-futures market provides one centralized price quotation that the rest of the markets can cue off. Actual gold bullion is costly and cumbersome to trade, but futures allow instant leveraged gold-price exposure to large hedgers and speculators. And gold futures have been around for decades.
American gold futures started trading in late 1974, when gold ownership finally became legal again for Americans after being banned for four decades by a Democratic president. Meanwhile GLD wasn’t born until late 2004, three decades after US gold futures started trading. So from a real-time-price and trader-sentiment perspective, American gold futures remain the only game in town. They truly are the gold price.
So just as extreme gold-futures selling slaughtered the gold price in the first half of 2013, heavy gold-futures buying is lifting it this year. The implications of this critical shift are very bullish. Based on multi-year averages, this gold-futures buying is likely only half done at best. As futures buying continues to push gold higher, more and more investors will be enticed back to strengthen and amplify gold’s new upleg.
It’s important to remember that futures are a zero-sum game. Every futures contract has one trader on the long side and another on the short side. The former is betting the underlying price will rise, and the latter that it will fall. Every dollar won by the winner is a direct dollar loss for the loser. Because of this core structure, the total number of longs and shorts outstanding in gold futures are always perfectly equal.
But there are two distinct groups of futures traders, hedgers and speculators. Hedgers actually produce or consume the underlying commodity, so they simply use futures to lock in their future selling or buying prices to minimize market risks on their businesses. But speculators trade futures solely in the hunt for profits, they have no commercial dealings in gold. Their highly-variable buying and selling drives the gold price.
Every week the main US futures regulator releases a great report called the Commitments of Traders that breaks down the futures positions held by both hedgers and speculators. The charts in this essay are built from that CoT data, revealing how American futures speculators are betting on gold. And they have been buying it aggressively, which is why the gold price has surged so nicely in the past few months.

This chart may look complex, but it’s quite simple. The green line shows the number of gold contracts that American futures speculators hold the long side of on a weekly basis. These are leveraged bets the gold price is going to rise, so the higher this metric the more bullish traders collectively are on gold. And the red line shows their bets on the short side, where higher numbers mean they are more bearish as a herd.
In order to grasp the implications of the big gold-futures buying this year, understanding the context of the big gold-futures selling last year is essential. Gold plunged 26.4% in the first half of last year, in three distinct selloffs that all had major futures-selling components. Last February, it all started when gold fell on a futures bear raid while most Asian traders were away for week-long Lunar New Year celebrations.
American speculators triggered this 6.7% 2-week decline by aggressivelyselling short gold futures. They effectively borrowed gold from other traders, sold it, and then hoped to buy it back cheaper later to repay their debt after its price had fallen. Speculators’ total short-side bets on gold surged about 50k contracts in that time! This is truly a vast amount, as each futures contract controls 100 troy ounces of gold.
The equivalent of 5m ounces of gold hitting the markets in a couple weeks, or 155.5 metric tons, was brutal. By that point in 2013, the total gold-bullion outflows from differential GLD-share selling was just 51.6t over 7 weeks. This pushed gold down near critical multi-year support at $1550, setting it up for April’s shocking panic-like plunge. Once that technical line in the sand crumbled, all hell broke loose.
As $1550 failed in mid-April, gold plummeted 13.8% in just 2 trading days! Gold hadn’t seen anything remotely close to that for three decades, it was crazy. That critical-support break triggered stop losses on speculators’ long gold-futures contracts, so they were forced to liquidate. This sparked margin calls on other traders, spawning a vicious circle of selling. Unfortunately theweekly CoT data masks this anomaly.
The CoT reports are current to each Tuesday’s close. Gold’s panic-like plummet in mid-April happened on a Friday and Monday, right in the middle of a CoT week. While many traders were getting stopped out of long contracts, many other traders were buying them aggressively since gold’s selloff was so extreme. So despite the minor weekly CoT changes, there wasmassive volume and churn within that week.
That event was so scary that it galvanized futures speculators into a hyper-bearish outlook. Just like at all extremes, they assumed that anomaly was the start of a new trend that would persist for some time. This led them to continue dumping gold futures relentlessly, making their bet a self-fulfilling prophecy. Between late April just after that plummet and early July, speculators fled gold futures at an unprecedented rate.
You can see this on the chart, the falling green line showing long positions being sold while the rising red one shows short bets growing. In futures trading, the price impact of selling an existing long position and selling to create a new short position is identical. The shorting accelerated as gold plunged again in June after Ben Bernanke laid out the Fed’s best-case timeline for slowing its QE3 debt monetizations.
2013 was as far from a normal year in gold as you can get. Not only was it gold’s worst year in nearly a third of a century, the second quarter was gold’s worst quarter in an astounding 93 years! Epic gold selloffs like we witnessed last April and June simply don’t happen, they are exceedingly rare. So there was no doubt that both futures speculators’ extremely-bearish psychology and resulting bets weren’t normal.
As I was trying to figure out just how wildly outlying all this was in the middle of last year, I needed some baseline for normal gold markets. I decided to simply look at their post-stock-panic years before 2013, the 2009-to-2012 era, for that comparison. As the next chart shows in a little bit, both speculators’ total long and short contracts held in gold futures had radically different averages over that secular span.
The total deviation of both speculators’ gold-futures longs and shorts from their 2009-to-2012 averages is represented by the yellow line above. By early July this critical metric had ballooned over 204k contracts. This meant American futures traders had sold the equivalent of 20.4m ounces of gold that they would normally hold, or 634.8 metric tons! This dwarfed GLD’s year-to-date liquidation of 411.1t.
The sheer magnitude of this first-half-of-2013 gold-futures selling defies belief. The World Gold Council reports all the world’s mines supplied 2969t of gold in all of 2013. Since gold is produced at a constant rate, halving that yields 1484t in the first half. So American speculators’ futures selling alone was so great in that span that it was like a 43% boost in mined supply! No wonder gold wilted under such an onslaught.
But the great thing about futures and markets in general is extremes never last. Eventually after anything is sold too long, bearishness peaks and the anomalous selling burns itself out. So there was no doubt that American speculators would have to start buying gold futures again soon to reverse these hyper-bearish bets. On the short side in particular, it was mandatory. Those record shorts had to be covered!
Despite their sophistication, gold-futures traders are human just like the rest of us. They too suffer from groupthink and herd mentality, getting too greedy and bullish when prices are already too high and too scared and bearish when prices are already too low. Historically, the aggregate speculators’ gold-futures positions are actually strong contrarian indicators. Their low longs and high shorts predicted an imminent reversal.
Indeed in July and August the speculators started aggressively covering their shorts, buying about 75k contracts or 233.3t of gold. This drove a sharp 18.2% 2-month gold rally, but unfortunately it fizzled out. Major new uplegs are always born with widespread short covering, as speculators buying to close their shorts at profits are often the only buyers around near extreme lows at peak despair. But their buying is finite.
An upleg can’t continue unless the upside price action initially sparked by short covering leads to enough bullish psychology to bring in other buyers. First futures speculators need to start adding new long-side bets, and then investors must gradually return to take over the capital-inflows lead. While there were encouraging signs of both gold-futures buying and gold-ETF buying, it soon ran out of steam.
So futures speculators resumed shorting gold with a vengeance in November, as they continued to whittle down their long-side bets. By early December, the total deviation of spec long and short contracts from their 2009-to-2012 averages was back up near 201k! But just as this extreme anomaly proved unsustainable in early July, it was no more so in early December. Futures selling was simply exhausted.
Provocatively for most of 2013, futures speculators feared nothing more than the Fed slowing its QE3 money printing to buy bonds. But when the rumor became fact and the QE3 taper arrived by surprise in December, gold only slumped to modest new lows. The American futures speculators didn’t add to their high short positions, and they actually started buying longs again! Thus gold started to reverse higher.
In January and February the speculators’ short covering accelerated, they have bought back over 62k contracts (the equivalent of 194.5t of gold) since early December. Once again this major short covering has birthed what is likely to grow into a major upleg. But even more encouraging, they have also started to buy on the long side in a major way for the first time since last year’s carnage. This is a super-bullish omen!
Futures contracts have expiration dates, so speculators legally have to buy to cover their shorts to effectively repay their borrowed gold in a matter of months after selling it short. But they have no similar obligation to buy on the long side. So new long-side buying reflects a genuine shift in their collective sentiment away from the extreme bearishness that crushed gold in early 2013. And it feeds on itself.
The more futures contracts speculators buy, the higher the gold price rallies. This brings in even more buyers, both in the futures realm initially and later in the far-more-important investment realm. It also puts tremendous pressure on the remaining speculators with short positions to buy back their bleeding bets to stem their mounting losses. And incredibly, this highly-likely futures buying is only half over!
Once again that yellow data series shows the total deviation in speculators’ gold-futures long and short contracts from their respective 2009-to-2012 averages in normal markets. This deviation peaked at 204.1k contracts in early July, and again at 200.8k in early December. All this gold that was sold had to be repurchased, driving gold higher, to return to market normalcy. As of the latest CoT report, it is still at 102.0k!
Gold has run 15.0% higher in the past several months or so almost solely on American futures buying. While stock-market capital has just started returning to gold via GLD, that is just 23.1t so far compared to 317.6t of futures buying. And these futures speculators still need to buy another 102.0k contracts, or 317.2t more gold, merely to mean revert to their secular-average levels of bets in normal market conditions!
This final chart extends this same CoT data back to 2008, to show those critical long-term averages. And the word average is key. It’s certainly not like speculators’ long-side gold-futures bets have to hit new record highs, or their short-side ones have to fall to zero. Between 2009 and 2012, before 2013’s craziness, speculators averaged 288.5k long gold contracts and 65.4k short ones on a weekly basis per the CoTs.

As of the latest CoT report, speculators’ longs were only back up to 208.6k contracts. This is still 79.9k, or the equivalent of 248.6t of gold, below their long-term post-panic average. By mid-December 2013, these bullish bets on gold had fallen to their lowest level in 5 years, since the also extreme and short-lived anomaly of 2008’s stock panic. Just take a look at what speculator longs did after that crazy event!
They rocketed dramatically higher over the subsequent year or so, catapulting the gold price 54% higher and paving the way psychologically for investors to return en masse. This is all but certain to happen again after today’s extreme, as that’s just the way mean reversions out of extremes work universally in the financial markets. Once buying after extreme selling starts, it takes a long time for it to run its course.
There is less gold-buying fuel left on the short side, with speculators total shorts now at 87.4k contracts. This is only 22.1k or 68.6t above their pre-2013 post-panic average. Still, that certainly isn’t a trivial amount of gold. Most short covering happens early on, before long-side buying. Back in early July, speculators’ total shorts hit 178.9k contracts! That was their highest level in at least 14.5 years, if not ever.
Another 102k contracts of gold-futures buying, as much as has already happened, is bullish enough for gold. But one of the greatest things about mean reversions is they seldom merely return to averages after hitting extremes. They nearly always overshoot to the opposite side! Like a pendulum pulled too far to one side, the momentum built in the reversion is so strong that the pendulum can’t just stop mid-arc.
So there is nearly a certainty that we are going to see way more than another 102k contracts or 317t of gold-futures buying by speculators. The odds are overwhelming that their total longs will not stop mid-arc at their 288.5k 2009-to-2012 average, but soar well beyond that up towards 375k or so like after the stock panic. And their shorts are likely to fall far below their 65.4k average, likely challenging 40k again.
Run these numbers, and we’re looking at potentially 214k contracts of gold-futures buying or 665 metric tons in the next year or so! That much futures buying along with the investment buying the resulting gold upleg will create should easily push gold back up over $1800 again, it not much higher. Mean reversions out of extremes are the most powerful trends in all the markets, incredible profit opportunities.
At Zeal we’ve been riding this one since its birth. As battle-forged contrarians, we’ve been brave when others were afraid. We’ve been aggressively buying dirt-cheap gold and silver stocks with outstanding fundamentals, and advising our subscribers to do the same. We’re all already sitting on big unrealized gains (up to +120% since November) that will grow far larger as gold’s recovery upleg continues to run.
You ought to enjoy the profitable fruits of our hard work! We publish acclaimed weekly and monthly newsletters for contrarians who like to buy low and sell high. They draw on our decades of hard-won experience, knowledge, wisdom, and ongoing research to explain what’s going on in the markets, why, and how to profit from it with specific trades. Since 2001, all 664 stock trades recommended in our newsletters have averaged stellar annualized realized gains of +25.7%! Join us today for just $10 an issue, a steal.
The bottom line is big gold-futures buying has fueled this year’s strong gold rally. And it wasn’t just short covering like last summer, but the first major new long-side buying since last year’s carnage as well. This greatly increases the odds that we are witnessing the birth of a major new mean-reversion upleg in gold. And incredibly, even to mean revert to average levels this futures buying is only half done so far.
But mean reversions out of market extremes never simply stop at averages, they overshoot in an often dramatic fashion. So there is likely a lot more futures gold buying coming than merely a return to normalcy would suggest. As this continues to relentlessly push gold higher, more and more investors with their far-larger pools of capital will return to take the baton. And a massive upleg will be the ultimate result.
Adam Hamilton, CPA
March 14, 2014
So how can you profit from this information? We publish an acclaimed monthly newsletter, Zeal Intelligence, that details exactly what we are doing in terms of actual stock and options trading based on all the lessons we have learned in our market research. Please consider joining us each month for tactical trading details and more in our premium Zeal Intelligence service at …www.zealllc.com/subscribe.htm
Questions for Adam? I would be more than happy to address them through my private consulting business. Please visit www.zealllc.com/adam.htm for more information.
Thoughts, comments, or flames? Fire away at zelotes@zealllc.com. Due to my staggering and perpetually increasing e-mail load, I regret that I am not able to respond to comments personally. I will read all messages though and really appreciate your feedback!
Copyright 2000 – 2014 Zeal LLC (www.ZealLLC.com)

How he did it is explained below. It is an interesting technique, as well as pretty simple and easy to replicate as described in full below. There is an offer at the bottom that invites you to sign up for a free week of usage to test it out as a stock selector. I have to assume anyone who signs up for a Free Week of usage will be followed by an automatic charge should you select to make no attempt to cancel your Free Week on time. The do offer a money back guarantee however and thus interesting to anyone who is genuinely interested in a proven stock picking technique that is easy to do – Editor Money Talks
How Peter Lynch Earned 29% a Year for 13 years
When it comes to true investing legends, Peter Lynch is in a league of his own.
The former head of Fidelity’s flagship Magellan Fund produced an annualized rate of return of 29.2% over his 13-year stint at the helm. This track record secured his place as the best mutual fund manager of all time.
So how did he do it? It’s not as complicated as you think…
In his best selling book, One Up On Wall Street, Lynch revealed a powerful charting tool that greatly simplified his investment decisions.
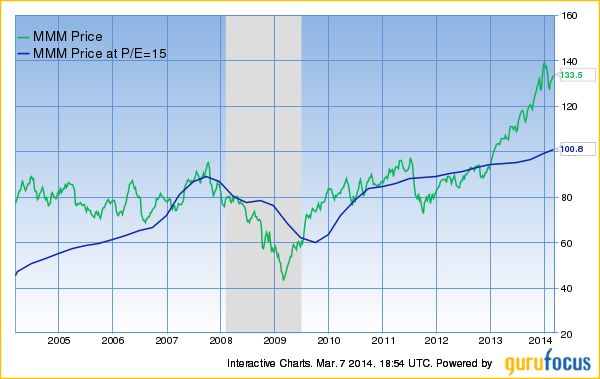
Deemed the “Peter Lynch chart”, this simple graph plots the stock price against its “earnings line” – a theoretical price equal to 15 times the earnings per share.
When a stock traded well below it, he would buy. When it rose above it, he would sell.
Not exactly rocket science, is it?
The idea behind this technique is simple. Lynch (and most other successful money managers) believe that mature, stable companies are worth roughly 15 times their annual earnings. And over the last 135 years, this has proven to be the mean valuation of the S&P 500 index.
This is known as a the P/E ratio. It is merely the price of the stock divided by its earnings per share. The resulting multiple represents how many times you are paying for last year’s earnings at today’s stock price.
All things being equal, the lower the number the better. Low P/E ratios mean that you are getting more earnings for your investment dollar. And since most large cap stocks eventually trade for at least 15 times earnings, you are more likely to see your shares appreciate as they return to the 15 P/E level.
This simple idea was the basis of Lynch’s investment approach and the reason he created his now famous chart.
The chart consists of only two lines. The first is the stock price. The second is the hypothetical stock price if it were to trade at a P/E of 15 (the earnings line). As Peter Lynch explained,
“A quick was to tell if a stock is overpriced is to compare the price line to the earnings line. If you bought familiar growth companies – such as Shoney’s, The Limited, or Marriott – when the stock price fell well below the earnings line, and sold them when the stock price rose dramatically above it, the chances are you’d do pretty well.”
Take Walgreens (WAG) for example. The Peter Lynch chart below shows a 10-year history of the stock price and the earnings line.
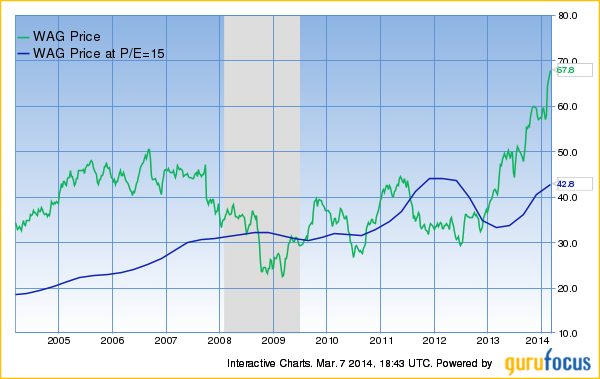
Most nvestors who bought the stock when it was trading above its earnings line experienced very small gains or even losses. However, buying Walgreens at any price below the earnings line led to sizable gains.
The same pattern can be found with almost any familiar US stock. Oracle (ORCL) and Wal-Mart (WMT) are all shown below:
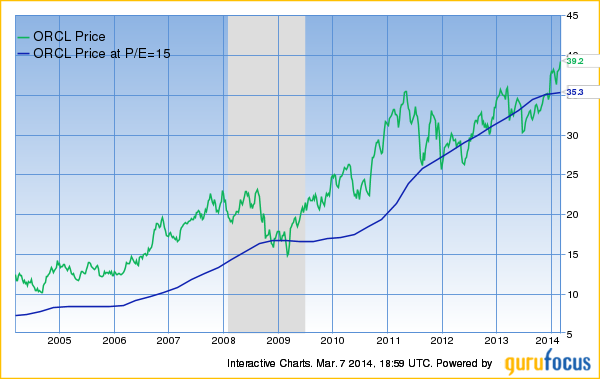
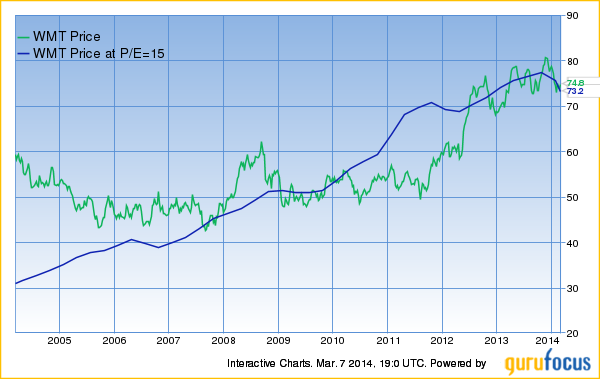
It is a well-known fact among investors that price follows earnings. Over multi-year periods, stock prices move in sync with changing company earnings.
But over the short term, stock prices are unpredictable. This creates valuable oportunities for savvy investors and turns the Peter Lynch Chart into PURE GOLD! Using the chart on any of the stocks above would have produced some very impressive gains.
GuruFocus is one of the only places to access this powerful tool.
Try it for FREE:
- Input a stock symbol in the search bar in the top left corner of the homepage.
- Select ‘Interactive Chart’ from the dropdown list.
- Just below the Interactive Chart tab is a ‘User Defined Chart’ menu.
- Select ‘Peter Lynch Chart’ and the rest is done automatically.
We encourage you to give it a try. Check your own stocks or look for new opportunities. Free members can chart up to 5 stocks at no charge.
Premium members receive UNLIMITED access to this tool along with countless other alerts, scanners, rankings and investment newsletters.
Given the potential cost of buying stocks at the wrong time, our $297 annual membership might be the safest investment you ever make.
CLICK HERE to Learn More about GuruFocus Premium Membership
GuruFocus.com Membership Services
Not a Member Yet?
Take a 7-day Free Trial of Premium Membership. It is risk FREE.
Satisfaction Guaranteed!
If you’re not 100% delighted with the Premium Membership, just let us know. There’s a money-back guarantee with this purchase!
GuruFocus.com Membership Services.

Nothing to report from Wall Street. Dow down a little yesterday. Gold up a little. The most telling stories are coming from the world economy, not its manipulated markets.
The price of copper is collapsing. The Baltic Dry Index is dragging along the bottom. Seven years after the start of the debt crisis the global economy is still struggling.
Hedge-fund-turned-family-office-manger George Soros says Europe could be in for a 25-year slump. Bloomberg reports:
Billionaire investor George Soros said Europe faces 25 years of Japanese-style stagnation unless politicians pursue further integration of the currency bloc and change policies that have discouraged banks from lending.
Europe “may not survive 25 years of stagnation,” Soros said in the interview with Francine Lacqua.
It was in the spring of 2007 that the first crack appeared in the weakest part of the debt structure: US subprime mortgages. By March 2007 the value of subprime mortgages had risen to $1.3 trillion. But mortgage rates were rising. Defaults and foreclosures followed.
The following autumn, the rate of subprime mortgage delinquencies had tripled from the year before. By January 2008, it had quadrupled. And by May it had quintupled.
It was a classic debt deflation. Homeowners had taken on more debt than they could afford. Now, the debt was going bad and investors were getting queasy.
Defaults were bad news for marginal homeowners. They lost their houses. They had to move.
They were bad news to the people who owned the mortgages, too. Wall Street had sliced and diced America’s mortgage deluge and sold it all over the world in the form of mortgage-backed securities – structured products that cleverly concealed, with the tacit backing of the ratings agencies, the junk hidden beneath the surface.
Sellers, too, seemed to forget what was in this sausage; they didn’t realize it was about to make them throw up.
First, Bear Stearns ran from the room, holding its stomach. Then it was Lehman Brothers. At that point, the feds came in with every quack cure they could think of. Bailouts, cash for clunkers, ZIRP, QE – one estimate put the total cost at more than $10 trillion, or about three times the cost of World War II.
The problem with the cures was always a fundamental one. The crisis was caused by too much debt. And all the feds had to offer was… more debt. As Bloomberg reported last week, the world’s stock of toxic sausages has exploded to $100 trillion:
The amount of debt globally has soared more than 40% to $100 trillion since the first signs of the financial crisis, as governments borrowed to pull their economies out of recession and companies took advantage of record low interest rates.
The jump in debt as measured by the Basel, Switzerland-based BIS in its quarterly review is almost twice the US economy.
Stopping the Future
Debt is an obligation laid upon the future by the past. The larger it gets, the harder it is for the future to happen.
There is a correlation between extreme levels of public debt and low economic growth. This has been demonstrated by several studies, most prominently by professors Rogoff and Reinhart. There were some errors in their math, which critics rejoiced in, but the conclusion was solid: High levels of debt-to-GDP have been historically associated with low levels of economic growth.
That is what has been happening in Japan for the last 23 years… and in Europe and the US for the last seven. These economies are still fighting deleveraging, resisting debt deflation and pretending that they can continue to add debt forever… and that somehow this will get them out of their debt traps.
But they are doomed. Without growth they can’t pay the debt. With so much debt, they can’t grow.
Regards,
Bill
These Two “C”s
Will Send Gold Higher
From the desk of Chris Hunter, Editor-in-Chief, Bonner & Partners
Two “C”s threaten widespread market instability: Crimea and China
Let’s look at each one… and why both are bullish for our favorite metal, gold.
Russian forces remain in Crimea, against international law. The government in Kiev is raising a 600,000-strong national guard to buttress its defenses against the Russians. A referendum will be held in Crimea on Sunday to determine whether the autonomous region should become part of Russia. The government in Kiev does not recognize the referendum.
The West is ratcheting up the economic tension. German chancellor Angela Merkel, who is usually relatively quiet on foreign affairs, has warned that Russia faces “massive damage” economically and politically, if it doesn’t back down over Crimea.
Meanwhile, China has gone from being the “engine of global growth” to the locus of concern over a global slowdown.
Chinese exports have collapsed 18% from a year earlier (versus expectations of a 7.5% increase). Chinese GDP growth is slowing. And there are concerns that bond defaults in the Chinese corporate sector may trigger a Chinese credit crunch.
It’s also quickly becoming clear that currency devaluation in Japan to boost exports is a zero-sum game. Japan can steal business from China and Korea, but this just prompts retaliation.
This is the “currency war” scenario many have feared Global QE would trigger. If the US and Japan are devaluing their currencies, it forces competitors to respond in kind… or lose critical export business.
Against this backdrop of uncertainty, it’s no wonder gold has been in rally mode in 2014.
Gold is not just a hedge against fiat currency debasement. It is also “disaster insurance” – a tangible asset with no counterparty risk investors seek out when return of capital, instead of return of capital, becomes a priority.
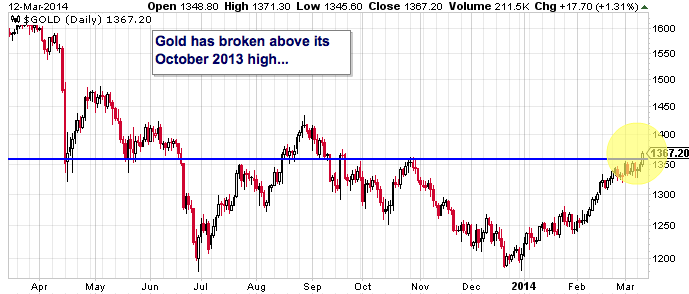
As you can see from the chart above, the spot gold price just broke above its recent October 2013 high. A break to the upside like this signals higher prices ahead.


Super Force Precious Metals Video Analysis
“Our main format is now video analysis…”
Here are today’s videos:
Thanks,
Morris
Mar 14, 2014 Super Force Signals special offer for Money Talks Readers:
Send an email to trading@superforcesignals.com and I’ll send you 3 of my next Super Force Surge Signals free of charge, as I send them to paid subscribers. Thank you!
Eddy’s Buy List containing 20 stocks contains Blue Chips like McDonalds & Ford Motor Company thru to red hot Tech Stocks like Ebay & Oracle. The list is still up on the year despite a the overall market being down at this time. Eddy’s Buy List is pretty simple, outlining Buy ranges, Current Prices and a description of each Stock. A short and sweet list of Stocks to Buy for the investor interested in adding to his or her portfolio. Editor Money Talks
Crossing Wall St. – Buy List Updates
“Don’t look for the needle in the haystack. Just buy the haystack!” – John C. Bogle
 This was a quiet week on Wall Street up until Thursday when renewed worries over Ukraine sent the S&P 500 down 1.2%. The index is once again in the red for the year, however, our trusty Buy List remains in the black.
Despite the dearth of news this week, things will get a lot more interesting next week when the Federal Reserve meets on Tuesday and Wednesday. This will be Janet Yellen’s first meeting as Fed Chair. This will also be her first post-meeting press conference. But the most important news is that there’s a very good chance the Fed will officially drop the Evans Rule.
The Evans Rule, named after Chicago Fed President Charles Evans, states that the Fed won’t raise short-term interest rates until the unemployment rate drops below 6.5%. The problem is that the jobless rate is 6.7% at last count and nearly everyone agrees that the economy is nowhere near ready for higher interest rates. The Evans Rule has been in effect since December 2012, and the Fed has been very careful to say that it’s a threshold and not a trigger.
I first talked about the Fed ditching the Evans Rule in CWS Market Review from January 10. I didn’t think it would happen at the time, but I considered the possibility of it happening later this year. Apparently, later is now.
What does the ditching of the Evans Rule mean for us? It’s very good news for investors. I’ll explain more in a bit, but it’s a clear message from the Fed that they’re going to be on the side of investors. Also in this newsletter, I’ll highlight some of the recent news from our Buy List. Plus, I’ll preview next week’s earnings report from Oracle. Larry Ellison’s firm has turned a corner and I expect more good news. I’ll also talk about the recent earnings warning from Bed Bath & Beyond. But first, let’s look at what’s on the Fed’s mind.
It’s Time to Ditch the Evans Rule
In last week’s CWS Market Review, I talked about the debate on Wall Street regarding how much of the soggy economic news was due to the soggy weather. I explained that most of the incoming data confirmed that the cold weather was in fact keeping shoppers at home.
We recently got two more important pieces of evidence that underscored the bad weather hypotheses. Last Friday, shortly after I sent out last week’s newsletter, the Labor Department reported that the economy created 175,000 new jobs in February, which beat expectations. More importantly, it snapped a two-month streak of pretty bad jobs reports. Bear in mind that the jobs report is by far the most important monthly economic report.
The other encouraging news was that retail sales showed its first increase in three months. Retail sales for February rose by 0.3%, which was 0.1% better than expectations. The numbers for December and January were pretty bad. I should add that Thursday’s initial jobless claims report was especially strong; 315,000 Americans filed first-time unemployment claims. That’s the lowest number since November, and the sixth-lowest in six-and-a-half years.
Last Friday’s jobs report showed us that the pre-weather trend of mediocre jobs growth is still in tact. When the bad data came out, some folks started to wonder if the Fed may have started tapering their bond purchases too early. But most Fed officials stuck to their guns and made it clear that unless something really dramatic happened, they were going to continue paring back their monthly bond purchases.
The plan with Quantitative Easing was that the Fed would purchase each month, $85 billion in bonds. That’s $40 billion in mortgage-backed securities and $45 billion in Treasuries. Twice now, the Fed has lowered the monthly number by $10 billion ($5 billion for each group), and they’re almost certainly going to do it again next week.
Is the Labor Market Really Getting Tight?
There are some concerns that the labor market may be getting “tight” right now, meaning there aren’t enough folks out there to fill up the job needs. As a result, wages are starting to rise. I don’t buy this argument. At least not yet. While it’s true that wage growth is starting to creep up, that’s working off a very low base.
The trouble is that the current labor market is in uncharted territory. The workforce participation rate is near its lowest level in more than 35 years. Many folks have simply walked away from the job market. Some of that is due to demographics, most specifically retiring Baby Boomers, but we don’t know exactly how much.
The unsettling aspect of the current jobs market isn’t the high level of unemployed people, but it may be the high level of unemployable people. I hate to sound so negative, but why would the economy rather pay existing employees higher wages than take on new recruits? Like I said, I’m not on board with the tight labor market idea, but the change in workforce participation has been quite startling.
Here’s the bottom line: The Fed will continue to taper. They seem pretty set on that. The Fed wants to get QE out of the way before they start raising interest rates. Right now, most folks expect the first rate increase will come around the middle of next year. The best early warning sign to watch is rising wages. Of course, that’s good news for workers, but at some point that will turn into higher inflation.
We also want to keep an eye on commodity prices which have risen very sharply in the past few months. Coffee prices, for example, have surge dramatically. For now, your local Starbucks can absorb the blow, but at some point, those commodity prices will take a bit out of consumers’ wallets.
The risk/reward ratio is still very much on the side of stocks. Consider that a Buy List stock such as McDonald’s (MCD) currently yields 3.33%. That’s 68 basis points more than a 10-year Treasury bond. In other words, investors are still vastly over-paying for safety. Until interest rise, the math is clearly on the side of stocks. Now let’s look at some of our Buy List stocks.
Oracle Is a Buy Up to $41 per Share
Oracle (ORCL), the enterprise software king, will report fiscal Q3 earnings next Tuesday, March 18. Three months ago, the company told us to expect Q3 earnings to range between 68 and 72 cents per share. That sounds about right to me. They see revenues rising between 2% and 6%.
I’m pleased to say that reports of Oracle’s demise have been greatly exaggerated. The company is far more “cloudy” than a lot of folks realize. Safra Catz, Oracle’s President and CFO, recently said, “We decided that we were really going to lean in to the cloud to get market share.” That they have.
In December, Oracle reported Q2 earnings of 69 cents per share which was at the top their range. Bookings for Oracle’s cloud enterprise offerings jumped an impressive 35%. The weak spot is new software license subscriptions; revenue there fell by 1%.
I’m in the optimistic camp on Oracle for a few reasons. One is I never go against Larry Ellison. I’ve also been impressed by their headway into the cloud sector. The company has reorganized its sales staff and strategy. I also like how Oracle has been buying back its shares. While I’m not normally a fan of buybacks, Oracle is truly reducing share count and thereby raising EPS.
I’m very curious to see what guidance Oracle offers for Q4, which ends in May. The Street expects 96 cents per share which may be a bit too high. I’ll warn you that the bears love to pounce on ORCL. Either way, Oracle continues to be a very good buy up to $41 per share.
Bed Bath & Beyond Shakes Off the Bad Weather Blues
After the closing bell last Friday, Bed Bath & Beyond (BBBY) released a statement saying that the lousy weather had zapped six or seven cents per share off their fiscal Q4 earnings. Their fourth quarter ended on March 1, and the earnings report will come out on April 9.
Let’s look at some math. The home furnishings store now says it sees Q4 coming in between $1.57 and $1.61 per share. The previous guidance has been for $1.60 to $1.67 per share. If you recall, the stock gotten beaten up in January when they lowered their initial guidance of $1.70 to $1.77 per share.
Here’s what’s interesting: I was almost convinced that the market was going to punish the shares at Monday’s open. Didn’t happen. Instead, BBBY was one of the top performers on ourBuy List. It looks like the bad-weather message finally got thru to traders.
The company said that during Q4, a store had to be closed for the entire day due to the bad weather 464 times. On top of that, there were 1,923 partial closings. Obviously people can’t shop at closed stores. There may be good news for BBBY in the future. Williams Sonoma, a close competitor, just reported earnings above expectations thanks to new home construction. That could be a lift for the industry. In fact, the entire retail sector has snapped back recently. For now, Bed Bath & Beyond remains a good buy up to $71 per share.
More Buy List Updates
I wanted to add a few quick notes on some of our other Buy List stocks. Cognizant Technology Solutions (CTSH) split 2-for-1 on Monday. The stock has been weak lately after Infosys, a competitor, gave poor guidance. For the most part, CTSH has been executing much better than Infosys so I don’t know if this is such a bad omen. CTSH is a solid buy up to $56 per share.
The Icahn Vs. eBay (EBAY) battle got even louder, if you can imagine that. This week, eBay (are you sitting down?) rejected both of Carl Icahn’s nominees for eBay’s board. eBay said they’re unqualified and urged shareholder to vote against them. This feud is getting tiresome. eBay has made it clear that they’re not going to sell PayPal. Carl, if you’re reading this, move on. eBay continues to be a good buy up to $62 per share.
McDonald’s (MCD) has made an embarrassing amount of errors recently. That’s why the stock has lagged, and partly why I like it. At BusinessWeek, Vanessa Wong takes a look at how MickeyD’s is working to right the ship. McDonald’s is a good buy up to $102 per share.
That’s all for now. In addition to next week’s Fed meeting, the government will release the industrial production report for February on Monday. Then on Tuesday, we’ll get reports on inflation and housing starts. It will be interesting to see if any of the rise in commodities shows up in consumer prices. I suspect that it’s too early. Be sure to keep checking the blog for daily updates. I’ll have more market analysis for you in the next issue of CWS Market Review!
– Eddy
Named by CNN/Money as the best buy-and-hold blogger, Eddy Elfenbein is the editor of Crossing Wall Street. His free Buy List has beaten the S&P 500 for the last seven years in a row. This email was sent by Eddy Elfenbein through Crossing Wall Street.


-
I know Mike is a very solid investor and respect his opinions very much. So if he says pay attention to this or that - I will.
~ Dale G.
-
I've started managing my own investments so view Michael's site as a one-stop shop from which to get information and perspectives.
~ Dave E.
-
Michael offers easy reading, honest, common sense information that anyone can use in a practical manner.
~ der_al.
-
A sane voice in a scrambled investment world.
~ Ed R.
Inside Edge Pro Contributors

Greg Weldon

Josef Schachter

Tyler Bollhorn

Ryan Irvine

Paul Beattie

Martin Straith

Patrick Ceresna

Mark Leibovit

James Thorne

Victor Adair