
Stocks & Equities
On the surface, the stock market was fairly subdued this week. The S&P 500 meandered lower, but the overall loss wasn’t so bad. On Thursday, the index closed a hair below 1,850, but let’s not forget that one week ago, we touched an all-time intra-day high.
Beneath the surface, however, there’s been a big shake-up in the market. Specifically, momentum names have faltered while value stocks have taken the lead. This is an important development, and investors need to understand what’s happening. High-profile sectors like biotech have gotten hammered, and former market darlings have been in a world of hurt lately.
Anyone remember a company called Netflix? That stock dropped 14 times in a 15-day span. Since March 4, NFLX is off by 20%. Stocks like Tesla and Priceline are getting dinged as well. Bespoke Investment Group recently noted that the best-performing stocks from last year are the worst performers this year.
In this week’s CWS Market Review, I’ll break down the market’s change of leadership and tell you what it means for our stocks. Speaking of our stocks, we had more good news for our Buy List stocks. DirecTV soared 8% on Wednesday after news of a possible merger with DISH. I’ll have more on that in a bit. Also on Wednesday, the stress testers at the Fed said they have no objections to Wells Fargo’s capital plan, which includes a hefty 16.7% dividend increase.
I’m pleased to see that our Buy List tech stocks are doing well. Oracle and Qualcomm are near new long-time highs, and even slumbering IBM has perked up. Big Blue just touched its highest point in six months, and I think we’ll get a dividend increase next month. But first, let’s look at the big internal shakeup on Wall Street.
 The Market’s Big Shift towards Value
An important lesson with investing is that the stock market swings in cycles, and not just the overall market, but also within the market. For example, economically cyclical stocks will lead for a few years, then lag for a few more. Financial stocks will blossom, and then another year it will be dividend stocks. There’s a loose relationship between these cycles, and it’s always dangerous to read too much into the market’s notoriously fickle mood.
In the last month, value stocks have started to lead the market, and growth stocks have been the big losers. What’s interesting is that this has happened during a mostly bullish time for stocks. Typically, we would expect value stocks to do well when the overall market is suffering. Then, as the bull market starts to age, we would expect growth stocks to come into their own. If you recall, that’s what happened during the late 1990s. What was so arresting about that market wasn’t that value stocks merely lagged — it’s that they got crushed even though growth stocks soared. Back then, the Growth/Value divergence was a yawning chasm.
Another interesting aspect about this recent shift to value has been how sharp it’s been. For my Growth proxy, I like to follow the Vanguard Growth ETF (VUG), and for Value, I look at theVanguard Value ETF (VTV). They’re like twin brothers always fighting over mom’s attention. VUG is flashier and has more popular names, while VTV is the quiet, dutiful student. The typical Value/Growth cycle has been distorted in the last few years because the value indexes have been filled with so many toxic financial stocks.
The last Value cycle topped out in mid-2006, and Growth has been in the driver’s seat ever since (with a few false starts for Value). This means that Value underperformed during both the bear market and the bull market. That’s quite a feat. A lot of people have anticipated a Value resurgence, but each attempt has failed. Or I should say each attempt so far.
Since February 27, VTV is up 1.08%, while VUG is down -2.73%. That may not sound like much, but within the ongoing battle between Value and Growth, that’s a major short-term move, and it may continue for some time. VTV has beaten VUG for the last seven days in a row, and 10 of the last 11.
So What Does This Value Shift Mean?
When the market moves towards Value, it typically means that investors are nervous and seeking safety in cheaper names. This time around, it’s not so much that investors want Value. No, it’s that they’re fleeing Growth. An orderly exit is turning into a mad dash. Probably the best example of this has been with biotech stocks. The main Biotech ETF (IBB) has dropped sharply over the past month. Since February 25, the IBB is off by 13.6%, and a lot of biotech names are down much more than that. Of course, we have to remember that biotech had been in an astounding rally over the past two years.
“So the last shall be first, and the first last” is a quote from the Bible, but it also could serve as a recent stock market report. Look a Tesla (TSLA), a high-flyer which could do no wrong. The stock went from $35 one year ago to as high as $265 last month. But the past few days have been a different story. Tesla is currently 22% off its high. On the flip side, look at boring Long-Term Treasuries (TLT). They’re supposed to be dead money, right? But the TLT is at its highest level in eight months. When the current shifts, it can be rough.
I also think the market’s shift towards Value is reflection of what I talked about last week — investors are getting prepared for the probability of higher short-term interest rates. Last week, the bond market woke up to this idea, and the shift to Value is the stock market’s turn.
Overall, the renewed emphasis on Value is benefit for our Buy List. In the short term, some of the prominent growth stocks like Cognizant Technology (CTSH) have suffered in the backlash. I don’t expect that to last. Now let’s take a look at some recent Buy List news.
Wells Fargo Raises Dividend 16.7%
Last week, the Federal Reserve said that Wells Fargo (WFC) aced its most recent stress test. I had no doubts they’d pass. It’s hardly a secret that WFC is one of the best-run big banks around.
The second part of the Fed’s test came this week to see if they’d approve their capital plans. Once again, Wells Fargo easily passed. The Federal Reserve said they had no objections to WFC’s capital plans. That includes a 16.7% increase in their dividend. The quarterly payout will rise from 30 to 35 cents per share. Last week, I said that I was expecting an increase, but only of two cents. Shows what I know!
The share jumped after the announcement. Using the new dividend and going by Thursday’s close, Wells now yields 2.85%. The board also approved a 350 million-share increase in their buyback plan.
By the way, this stress wasn’t a cakewalk. Zion’s failed, and Citigroup’s dividend request was shot down. Six years after Bear Stearns collapsed, Citi still pays a quarterly dividend of one penny per share even though Wall Street expects them to earn $5.78 per share next year. Citigroup is still a mess, and I’m glad we have a top-tier name like Wells Fargo. Look for another good earnings report in two weeks. WFC remains a very good buy up to $54 per share.
Will DirecTV Merge with Dish?
On Wednesday afternoon, news broke that the CEO of Dish Networks had spoken to the CEO of DirecTV (DTV) to talk about a possible merger. Honestly, this isn’t a big surprise. Folks have talked about a merger between the two for years. In fact, they tried to merger 12 years ago, but the Federales blocked it. Today, I think DTV is the stronger company, but I have to give credit to Dish for holding its own.
Clearly, the recent merger announcement between Time Warner Cable and Comcast has changed the game, and the two satellite guys have to start thinking seriously about their future. A merger makes sense, but at what price? That’s hard to say. I think DirecTV holds the upper hand here, and it’s interesting to note that Dish’s CEO made the call. Still, DirecTV would be wise to consider an offer. DirecTV has 20 million subscribers, while DISH has 14 million.
A lot of this will depend on how regulators rule on the Comcast/TWC deal. If the Feds say yes to that, it will be hard for them to say no to the Direct/Dish deal. DirecTV’s CEO, Mike White, has seemed hesitant about a deal, but he hasn’t ruled it out. I think that’s the right attitude. Frankly, I think these two will get together at some point. I just don’t know when.
The immediate benefit of the merger talk is that shares of DTV jumped as much as 8% on Wednesday, although the stock pulled back as the excitement wore off. DirecTV remains an excellent buy up to $84 per share.
New Buy Below Prices
I want to update a few of our Buy Below Prices. IBM (IBM) has been doing well lately. This week, the shares got above $195 for the first time since September. I’m expecting a dividend increase from Big Blue sometime next month. I’m raising my Buy Below to $197 per share.
On Thursday, Qualcomm (QCOM) closed at another multi-year high. The company raised their dividend by 20% just a few weeks ago. This week, I’m bumping up my Buy Below to $83 per share.
CR Bard (BCR) has been one of our top performers this year. I’ve already raised my Buy Below on BCR a few times, and I’ve purposely held off in the past few weeks. With the Q1 earnings season just around the bend, I feel more confident in BCR’s outlook. Bard has beaten earnings for the last six quarters, and I think they’ll do it again. I’m raising my Buy Below on BCR to $147 per share.
I’m keeping my Buy Below for Microsoft (MSFT) at $43 per share, but I wanted highlight the CEO’s plans for the company. For the first time in years, investors are optimistic for MSFT. Keep watching this story, it’s going to get better
Two of our tech stocks have had a rough month: CA Technologies (CA) and Cognizant Technology Solutions (CTSH). I still like both stocks, but I want my Buy Below to better reflect the market’s current judgment. I’m lowering my Buy Below on CA to $34 per share, and I’m lowering Cognizant to $52 per share. Going by Thursday’s close, CA’s dividend works out to 3.28%. Both stocks are very good buys.
That’s all for now. The first quarter ends on Monday; after that, we’ll get our regular beginning-of-the-month reports. ISM comes out on Tuesday. The ADP jobs report comes out on Wednesday. Then on Friday, the government releases the big jobs report for March. With the Fed committed to tapering, I actually think the monthly jobs reports aren’t quite as important as they were last year. Be sure to keep checking the blog for daily updates. I’ll have more market analysis for you in the next issue of CWS Market Review!
– Eddy
About Crossing Wall Street
Named by CNN/Money as the best buy-and-hold blogger, Eddy Elfenbein is the editor of Crossing Wall Street. His free Buy List has beaten the S&P 500 for the last seven years in a row. This email was sent by Eddy Elfenbein through Crossing Wall Street.

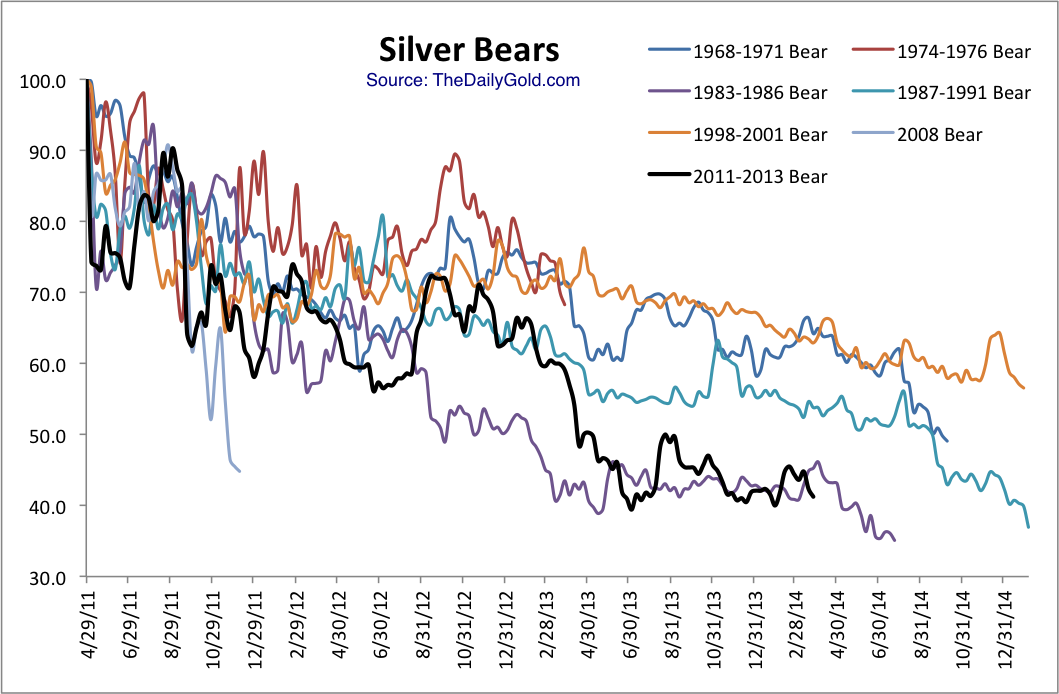
Silver has been in a bear market for almost three years and the recent lack of strength suggests the metal could be headed for new lows. New lows are always bearish until the last one. Our technical work suggests that we should watch for a final low and end to the bear market in the coming months.
This chart plots every major bear market in Silver dating back 45 years (excluding the 1980-1982 bubble bust). It plots them on the same time scale as the current bear market. Excluding the 1980-1982 bear market, we find that the current bear market is inline for being the worst bear market. It is already the fourth longest in time and close to the second worst in price. The current bear is very close to the 1983-1986 bear. This chart and the 1983-1986 bear suggest that if the current bear breaks to a new low then its final bottom could occur about one month later.
Silver has very strong trendline support on the daily chart around $17. If Silver breaks to a new low then it will run into this trendline support which dates back 11 years.
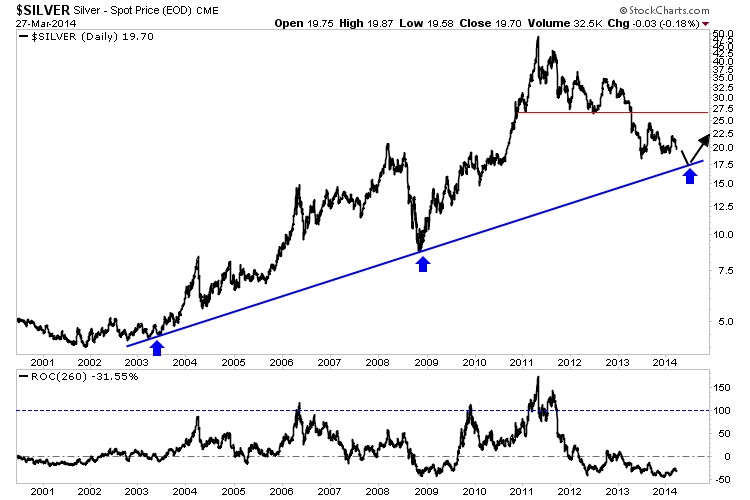
In the lower column we plot a 12-month rate of change for Silver. Note how it often reaches or comes close to 100%. After lows in 2003, 2005, 2008 and 2010 Silver gained 100% in a 12 month period. Moreover, following the 1983-1986 bear market which closely resembles the current bear, Silver rebounded 89% in 10 months. Following the 2008 low, Silver rebounded 84% in 11 months. Let’s say Silver bottoms at $17.50 and rebounds 70% in 12 months. That would take it to $30. That would create huge upside in most silver stocks.
Below is a chart of our proprietary silver producers index which contains 14 stocks and is partially weighted by market cap. It contains all of the large, important silver companies as well as junior producers. We didn’t just pick the 14 best. This index recently peaked at neckline resistance and just below the 80-week moving average. Note how the 80-week moving average marked resistance in early 2012 and late 2012. A new bull market will only be confirmed when this index is able to surpass that confluence of resistance.
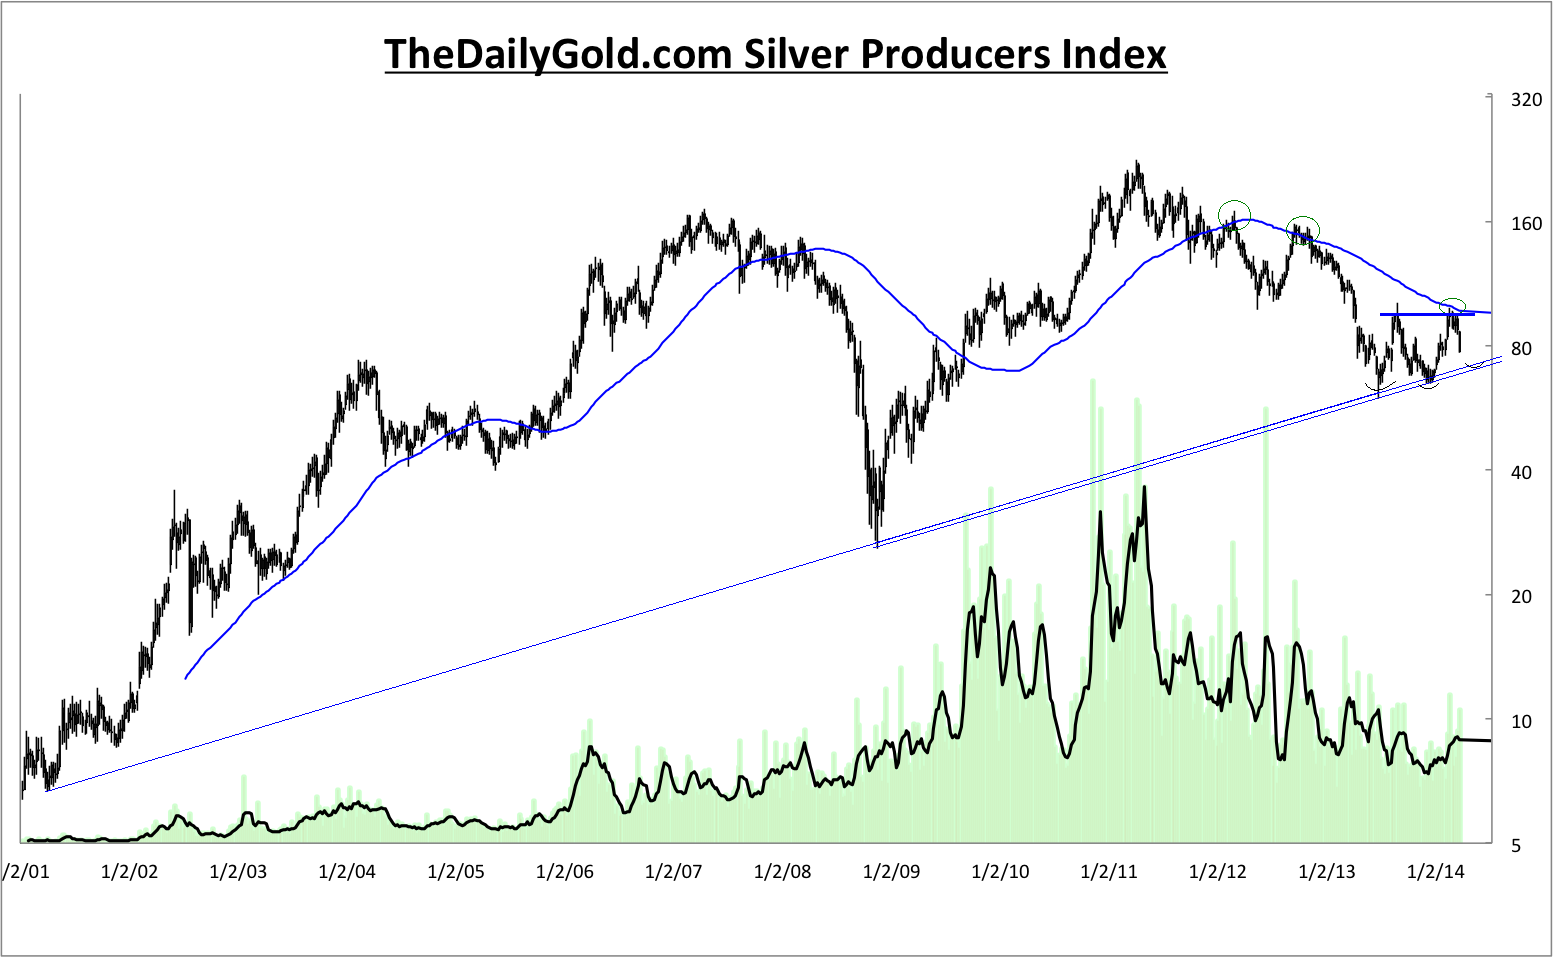
From a bird’s eye view, the bear market in Silver is just about over while the bear market in silver stocks probably is over as we don’t expect them to make a new low. However, the silver stocks won’t break resistance and confirm a new bull market until Silver has bottomed. Our analysis shows that Silver’s bear has a bit more to go in terms of price and time. We’ve laid out what we are looking for in Silver which is a new low and a bounce from 11-year trendline support. If that occurs at a time of extreme bearish sentiment then it is a buy signal. This prognosis, if correct means we have some time to research and patiently accumulate the best silver stocks which are positioned to benefit from a resumption of the secular bull market. If you’d be interested in learning about the companies poised to outperform, then we invite you to learn more about our service.
Good Luck!
Jordan Roy-Byrne, CMT
Signs Of The Times
“Fresh loans in China’s banking system evaporated to almost nothing from $160 bn in January.”
– The Telegraph, March 10
“Commodities and equities slide amid broad risk aversion.”
– Financial Times, March 11
“Italy’s biggest bank posted a $21 bn fourth quarter loss as it set aside money for bad loans and wrote down goodwill from past acquisitions.”
– Bloomberg, March 11
“China is studying the default risk to companies that use iron ore as collateral.”
– Bloomberg, March 13
“A Whole New Inflationary Threat Is On The Horizon”
– Business Insider, March 10
“But if the Fed can pull it [QE] off, it will go down as one of the greatest discoveries of our time.”
– Business Insider, March 12
 ….read all Bob’s take on the Stock Market, Currencies & commodites HERE

In a recent “Squawk Box” interview to CNBC, the publisher of “The Gloom, Boom & Doom Report” had cautioned investors that the long-running bull market in US stocks runs the risk of ending badly. “Usually these long bull markets, they end badly,” he said, pointing to the 1987 crash and the significant declines in 2000 and 2007. Speaking about EMs, he had then said that while it might be too early to buy some of the beaten-down emerging markets at these levels, investors can make money in the longer-term. “I think I can make the case that over the next five to 10 years, I will make more money by buying now in the emerging economies than in the US.”
“I think the market is way overdue for a 20 to 30 percent correction,” “nothing worries me… In fact, I’m hoping for the market to drop 40 percent so stocks will again become—from a value point of view—attractive.”
“But that is not the view of someone who is fully invested—obviously not.”
“Stocks are by-and-large fully priced”
“I think the experience with quantitative easing is a complete failure. It has lifted asset prices and created asset inflation, but it hasn’t lifted the standard of living of most people in the U.S. nor worldwide.”
On the chance of a bounce (and what next?)
“If the rebound fails around 1,820 [on the S&P 500] and then the market starts to drift again on the downside, and we see important shares for the market such as General Motors, GE, MMM, Coke … failing to make new highs, then I think we can assume that something more serious is in the offing.”
Marc Faber is an international investor known for his uncanny predictions of the stock market and futures markets around the world.Dr. Doom also trades currencies and commodity futures like Gold and Oil.
Briefly: In our opinion short speculative positions in gold (half), silver (half) and mining stocks (full) are justified from the risk/reward perspective.
The decline in the precious metals sector continues, as indicated in the previous alerts. Gold, silver and mining stocks have declined once again and appear to be headed lower also today. Did yesterday’s price action change anything? Let’s take a look (charts courtesy of http://stockcharts.com). Today we will start with silver and mining stocks.
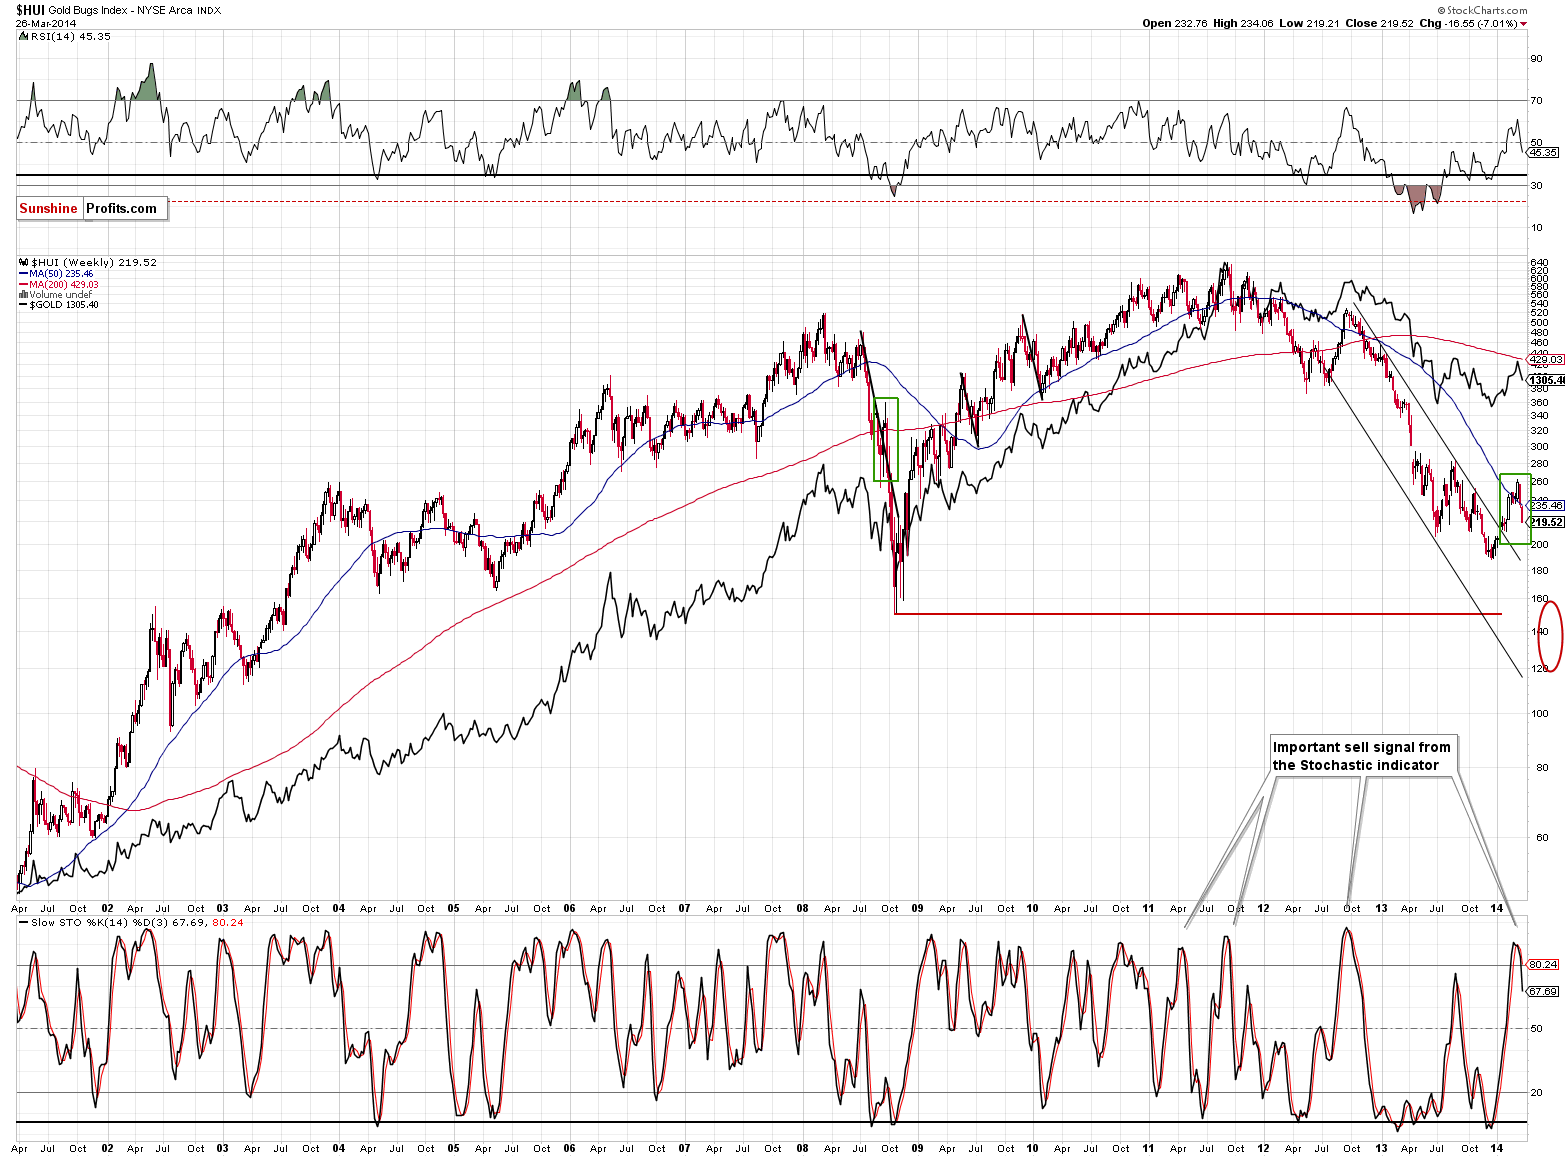
The reason that we’re starting with mining stocks is that definitely nothing changed in this picture. The situation was particularly bearish and still is. We saw another volatile drop yesterday. Actually, it might have been a little too volatile and a pause here would not surprise us.
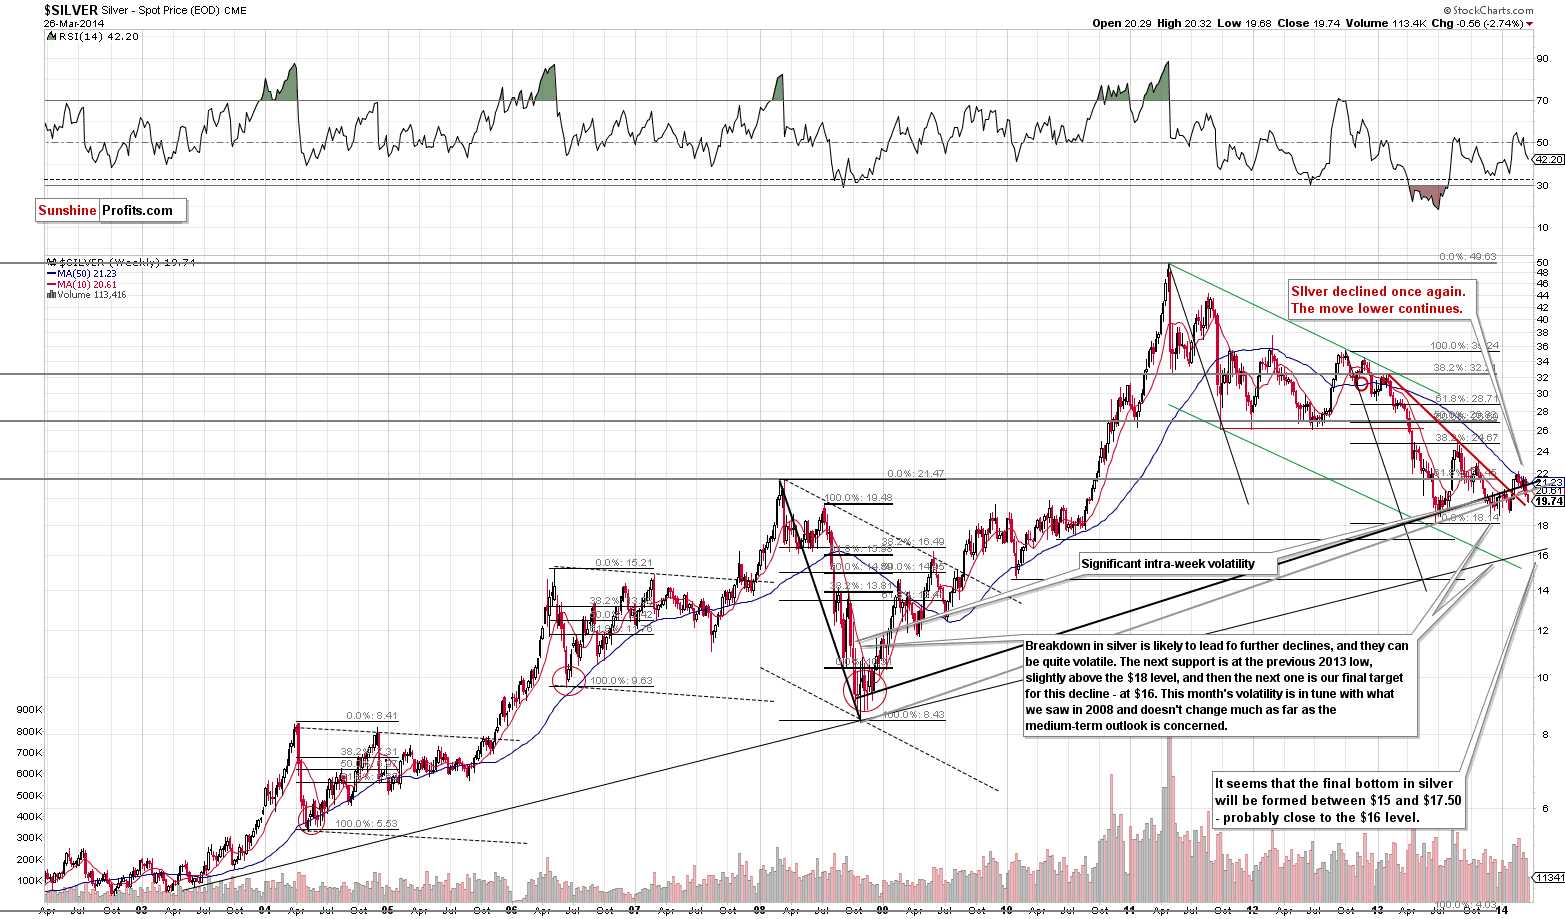
Silver is now well below the $20 level and appears to be ready to decline some more. After all, the breakdown below the rising long-term support lines has already been confirmed.
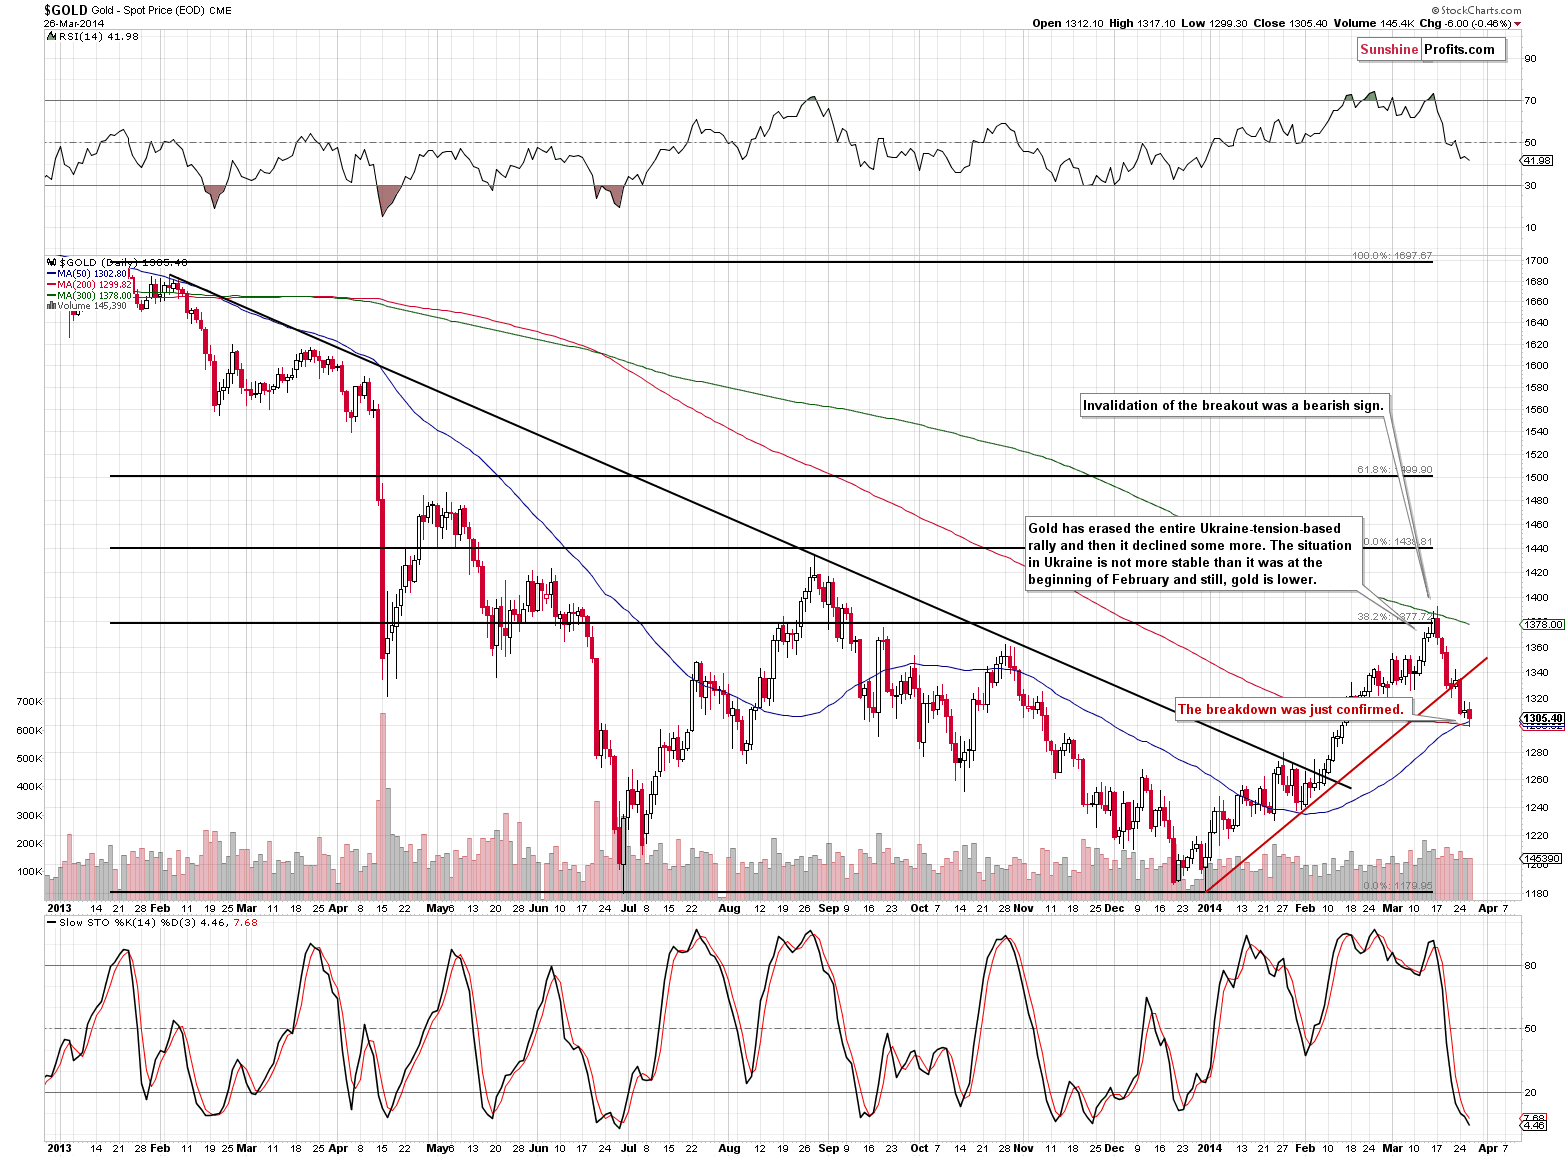
We previously commented on the gold market in the following way:

The situation in the USD Index supports the bearish case. The U.S. currency is after a short-term breakout, after a false breakdown below the rising medium-term support line and after a small consolidation. The USD Index simply looks ready to rally further. Since there has been negative correlation between precious metals and the USD Index recently, and now gold is even declining without the dollar’s help, we have a very bearish combination.
The precious metals sector appears to be likely to decline even without the U.S. dollar’s „help“, but it seems that it will receive this „help“ anyway.
Consequently, in our opinion the remaining half of the long-term investments in gold can be temporarily closed. Moreover, in our opinion a speculative short position in gold is also justified from the risk/reward perspective. We are also moving stop-loss orders lower as silver and miners are much lower than when we first outlined these positions.
To summarize:
Trading capital (our opinion): Short positions: gold (half), silver (half) and (full) mining stocks.
Stop-loss details:
– Gold: $1,342
– Silver: $20.85
– GDX ETF: $25.6
Long-term capital (our opinion): No positions
Insurance capital (our opinion): Full position
You will find details on our thoughts on gold portfolio structuring in the Key Insights section on our website.
Thank you.
Przemyslaw Radomski, CFA
Founder, Editor-in-chief
Tools for Effective Gold & Silver Investments – SunshineProfits.com
Tools für Effektives Gold- und Silber-Investment – SunshineProfits.DE
* * * * *
Disclaimer
All essays, research and information found above represent analyses and opinions of Przemyslaw Radomski, CFA and Sunshine Profits’ associates only. As such, it may prove wrong and be a subject to change without notice. Opinions and analyses were based on data available to authors of respective essays at the time of writing. Although the information provided above is based on careful research and sources that are believed to be accurate, Przemyslaw Radomski, CFA and his associates do not guarantee the accuracy or thoroughness of the data or information reported. The opinions published above are neither an offer nor a recommendation to purchase or sell any securities. Mr. Radomski is not a Registered Securities Advisor. By reading Przemyslaw Radomski’s, CFA reports you fully agree that he will not be held responsible or liable for any decisions you make regarding any information provided in these reports. Investing, trading and speculation in any financial markets may involve high risk of loss. Przemyslaw Radomski, CFA, Sunshine Profits’ employees and affiliates as well as members of their families may have a short or long position in any securities, including those mentioned in any of the reports or essays, and may make additional purchases and/or sales of those securities without notice.


-
I know Mike is a very solid investor and respect his opinions very much. So if he says pay attention to this or that - I will.
~ Dale G.
-
I've started managing my own investments so view Michael's site as a one-stop shop from which to get information and perspectives.
~ Dave E.
-
Michael offers easy reading, honest, common sense information that anyone can use in a practical manner.
~ der_al.
-
A sane voice in a scrambled investment world.
~ Ed R.
Inside Edge Pro Contributors

Greg Weldon

Josef Schachter

Tyler Bollhorn

Ryan Irvine

Paul Beattie

Martin Straith

Patrick Ceresna

Mark Leibovit

James Thorne

Victor Adair