
Stocks & Equities
 Spurred by fears on Wall Street about over-stretched stock valuations, global equity markets fell on Friday from Asia and Europe, as investors looked for safer havens. At least these were the headlines du jour.
The Nasdaq composite, which has been hit in recent days as investors bailed out of high-flying ![]() technology and biotech shares, slipped anew. The index on Thursday had recorded its biggest single-day percentage loss since November 2011. This should not come as a surprise.
technology and biotech shares, slipped anew. The index on Thursday had recorded its biggest single-day percentage loss since November 2011. This should not come as a surprise.
With the strong gains on Canadian and U.S. over the past 24-months has come a rise in the level of broader valuations. In fact, in a few specific segments including tech (social media and new tech) and biotech, valuations have been driven to lofty levels with investors chasing growth as confidence has increased.
While there are a number of companies we are very interested in buying at present, quite frankly they are not cheap. As such, this year we included 8 such companies in our Cash Rich Report which we consider to check off most of the boxes we look for in an investment including excellent balance sheets with strong net cash positions, strong cash flow generation and good to great growth in solid businesses.
The rub however, is in the fact that the valuations both individually and collectively are currently premium – and the markets are beginning to take notice. At present, we are not able to currently purchase these attractive companies on the cheap. The type of selection criteria that has led us to companies like Enghouse Systems Limited (TSX:ESL) and C-COM Satellite Systems Inc. (TSX-V:CMI) in recent years. Both technology (software and hardware) related companies that possessed strong growth and were bought at reasonable to very cheap prices. In other words, they embodied GARP.
In fact, we can reference about 15 stocks from the past 2 years that, at the recommendation date, traded at 3-10 times earnings with strong growth, great balance sheets and positive outlooks. Contrast this with the 8 companies we included in our “Cash Rich, But Not Cheap” research note to our clients where we see price earnings multiples from 50-200 times and price to cash flow which average in the range of 40, and there is reason to be wary when investing at such levels.
At times investors can be wise to “pay up” or pay a fair to premium price to purchase great companies. Many pundits will say you get what you pay for. To a point we agree, but as we have shown over time, it is possible to buy great companies at good to great value. But we do not believe in buying growth at any price or GAAP stocks. For all the Amazon’s and Twitter’s there are countless companies (tech or otherwise) who initially posted or promised growth only to fall off the proverbial investment cliff when it slowed or was not delivered. This is what unrealistic growth expectations can lead to – it is a rare company that lives up to or leaps this type of high bar long-term.
In an investment, there are often two components we are looking for to achieve price appreciation – 1) Above average annual earnings growth. 2) Multiple expansion.
You can achieve the above average earnings growth component if the company continues to grow net income at 25-100% (for example). Indeed, in recent times, the majority of the companies on this list have continued to do so which has been positive for their share prices. However, as we will noted, this can be a difficult level to sustain and when a stock trades at premium valuations, the market expectations are high and any misstep can lead to severe corrections.
For example, company A has growth of 35% and trades at 8 times earnings. Company B has growth of 35% and trades at 30 times earnings. Both could theoretically maintain the same earnings multiple and see their share prices rise by 35% (the growth in their earnings). It is far more likely that the Company A could see a doubling in the PE multiple the market awards it from 8-16 (given its growth and the fact the average stock on the market trades at 18-19 times earnings) than Company B moving from 30-60 times earnings. Remember Company B already trades at a premium to the average stock which is tough to sustain at the best of times for great companies.
We favour investing in Small-Cap Growth stocks which have the potential for both above average annual earnings growth and multiple expansion. This is difficult to do when you are paying prices that are a significant premium to the market average. While several of the 8 quality companies on our list will likely continue to grow and continue to be long-term winners. Our margin of safety on each company is less.
To give you an example of what can happen to a premium priced, albeit good company when it reports a stumble in earnings we reference the Q3 results of Lonestar West Inc. (LSI:TSX-V), which were reported at the end of November in 2013 with the stock trading at $4.00. While revenues increased smartly by 34.8% to $8.3 million in the previous year equivalent quarter, net income declined sharply to $91,981 from $664,585 in the previous year equivalent quarter. The stock subsequently lost over 32% of its market value in a few months since. When valuations are premium (PE or price to cash flow ratios are high), expectations are high. If they are not met we can see a sharp correction. Of course, when stocks with lower premiums miss expectations, they can drop as well, but there can be a floor, book or break of value at times which has the potential to hold the stock.
Another example from the list is Kelso Technologies Inc. (KLS:TSX-V), a railroad equipment supplier that designs, produces and sells proprietary tank car service equipment used in the safe loading, unloading and containment of hazardous materials during transport. This is a solid market at present and the company has posted strong revenue, cash flow and earnings growth this past year. The balance sheet is strong as well. We like the business and the growth, but in the $5.00 range at present it trades at over 100 times last year’s earnings. This multiple can shrink with further growth as we expect, but with the average stock on the TSX trading somewhere in the range of 20 times earnings the premium we are asked to pay for this growth is high. Good company, but it might not be at a price which gives us both the growth or margin of safety we are looking for long-term.
KeyStone Latest Reports
Sincere regards,
Ryan Irvine,
President & CEO

Web: www.keystocks.com
Email: rirvine@keystocks.com
Phone: 6 0 4 – 2 7 3 – 1 1 1 8

Signs Of The Times
“Runs on rural Chinese banks as rules ease”
“Regulators more tolerant of defaults”
– Financial Post, March 26
“In one corner of the U.S. equity market, investor enthusiasm is exceeding the frenzy of the Internet Bubble. Small-cap shares [Russell 2000] have rallied for seven straight quarters, the longest stretch ever.”
– Bloomberg, March 24
“Too much volatility for emerging-market currencies – and not enough in the developed world – is stinging traders – wiping out profits in the carry trade.”
– Bloomberg, March 25
“Investors just can’t get enough of exchange-traded funds that buy junk-rated bonds.”
– Bloomberg, March 27
“Is Michael Milken the buyer of $100-million Westside estate?”
– Los Angeles Times, March 31
It is worth looking at the pictures.
Like civilizations, bull markets are born stoic and die epicurean.
* * * * *
Stock Markets
The above line on bull markets is a modification of an observation by the historian Will Durant, who had many acerbic quips. And as anybody knows there is a great need for acerbic these days.
Janet Yellen has no special abilities to determine the level of interest rates. But a couple of weeks ago she mused about increasing rates some six months from now.
Markets had a one-day hit.
Then on Monday she mused about keeping the booze flowing. Being assured of continued official recklessness, risk again has become fashionable. There is an Italian proverb about what happens to the flock when the shepherd goes mad?
OK, we have had a target of S&P 1885, “or thereabouts”.
Last week’s view was that it could go further, but as it did the action would become more precarious.
Equity markets are now entering the “sweet spot” on the calendar year; more specifically with the US Mid-term Election Cycle. This calls for a tradable high in April and an equally tradable low in late September.
This is based upon the DJIA from 1888 to 2010, and is a refinement on the old “Sell in May” routine.
Of course, the distinction is that at this time of year “silly season” events are possible. And these are only possible because of “animated spirits”. Such spirits have reached levels only seen at cyclical peaks and were not a factor in the last two springs.
Very good “May” trades were evident in 2010 and 2011, well before the advent of today’s one-way-market.
The big leader on the way up has been the NDX and the zoom has generated the highest Monthly RSI since the mania that completed in March 2000. On the next bull market, the low was 1019 in March 2009 and the high was 3738 in early March. The first hit was to 3543 last week and the bounce made it to 3676 at yesterday’s open. It up-ticked to 3676 at today’s opening and slipped to 3637 at the close.
Taking out the 50-Day ma at 3620 would be interesting and taking out the last low at 3543 would turn the action down.
Within this Biotechs (IBB) have been fabulous. The high was 275 set in late February and the initial low was 229 last week and the rebound made it to 245 yesterday. Today’s close was 234.
There is support at the last low at 229 and taking this out would be a major breakdown.
And as we have been mentioning, hot action in credit spreads at this time of year has a tendency to reverse.
Commodities
Crude oil can rally into May, but it will need to stay above the 50-Day ma.
Agriculturals (GKX) enjoyed and outstanding rally, reaching a Weekly RSI of 72, which we took as enough to end the move.
ETF’s we have been using are JO and DBA.
Coffee (JO) did the huge blow-off to 42. The initial decline was to 33 and the bounce was to 36 last week. Taking out 33 resumes the downtrend and it is not oversold.
DBA soared from 24 in January to 30 two weeks ago. The Weekly RSI reached 82. This matched the big drought rally of 2012.
The initial break was to 27.82 and the rebound was to 28.58. Now at 27.80 any slip would resume the decline. There is support at the 50-Day ma, which is around 27.
In November this was very depressed and we thought it had the best chance for a rally. Commodity bulls who know the Fed is evil, but think inflation only occurs in commodities, climbed aboard. As if it was the second coming.
On the CRB, sentiment became the most bullish in two years, and the COT numbers became the most bullish – ever. That was after the very low numbers set last summer.
The overall rally became fully expressed and is correcting.
Our view is that history is in another post-bubble contraction which will be a chronic depressant to most commodity prices. The bubble in lower-grade bonds and bull market in stocks has been the “inflation” in response to Fed excess. Actually it’s more the other way around. Speculation in financial assets has assisted the Fed’s recklessness.
When the bond bubble collapses will the baton of “inflation” be picked up by commodities and other tangible assets?
In the meantime, copper’s long bear market is getting interesting.
The latest washout to 2.88 was associated with unwinding of unusual Chinese “investments”. We should look beyond this.
Momentum Peak Forecaster, which does not register all that often. But when it does a big speculation is close to ending. In that example it was in base and precious metals. In 2006 it was the housing boom.
This model does not have a built in signal for a major bottom, so we use other tools.
With the recovery in commodities copper increased from the low of 3.14 in November to 3.45 in late December. Then it weakened until it plunged in March from 3.20 to 2.88 in the middle of March.
As noted, this drove the Weekly RSI down to only 29. A rebound became possible and the price has recovered to 3.05. If it gets through this then 3.25 is possible.
With this, base metals (GYX) have recovered from the three-year low of 322 to 336.
How far can it go?
Back to where it failed at 340 seems possible, but not much more.
Financial history is close to the end of the first business expansion in a post-bubble deflation.
Link to April 4, 2014 Bob Hoye interview on TalkDigitalNetwork.com:
http://talkdigitalnetwork.com/2014/04/beware-nasdaq-loses-steam/

BOB HOYE, INSTITUTIONAL ADVISORS
E-MAIL bhoye.institutionaladvisors@telus.net
WEBSITE: www.institutionaladvisors.com
The Fed minutes were dovish and this helped push Gold above $1310 to $1320. However, the miners, which usually lead the metals did little to confirm the rise. In fact, the miners have been relatively weak in recent days and had a bearish reversal on Thursday. Their rebound from an oversold condition has petered out. Another point is Gold, during this rebound has made no progress against foreign currencies. It’s starting to show some strength against the equity market but it needs to show strength against all currencies and not function only as the inverse of the US Dollar. Be on alert as the short-term trend for precious metals (especially the miners) could resume to the downside.
Looking further out, forthcoming weakness shouldn’t last that long in the big picture. The miners have been basing for quite a while and started to gain traction in Q1. The next low at worst could be a double bottom or otherwise would mark the first higher low in this bottoming process. In the chart below we plot GDX (large caps), GDXJ (juniors), SIL (silver stocks) and GLDX (explorers). We note how much each would have to decline to test its December low.

Our gold stock bear analogs chart, which helped us call the June 2013 low and anticipate the December 2013 low, makes a strong argument that the final low (on a weekly basis) occurred in December. The low is circled but we kept the plot going for further comparison. Compared to the present, there are only two bears that lasted longer and at present both were down less than 50%. Note that at the December low when gold stocks were down 64%, the three bears which lasted longer were off no more than 50%.

The 1996-1999 bear which ended at this time down 69% is an interesting case. It did reach lower levels in 2000 before the current secular bull started. However, after the 1999 low gold stocks exploded led by the GDM index (forerunner to GDX) which surged 75% in a few months. Then the stocks consolidated for many months before popping again. During this brief 14-month respite the GDM gained 90%, the XAU 83% and the HUI 68%. After the bottom in 1999, GDM and XAU broke to new lows two years and two months later. The HUI, which was more attached to the epic junior bubble of the mid 1990s, reached new lows one year and nine months later.
Considering this history, even the most bearish person would have to admit that the market needs to consolidate for a while (as in way more than a year) to have any chance to reach new sustained lows. Gold stocks enjoyed a huge short covering rally shortly after the 1999 low. Yet even after the short covering ended the preceding bear market low wasn’t breached for roughly two years!
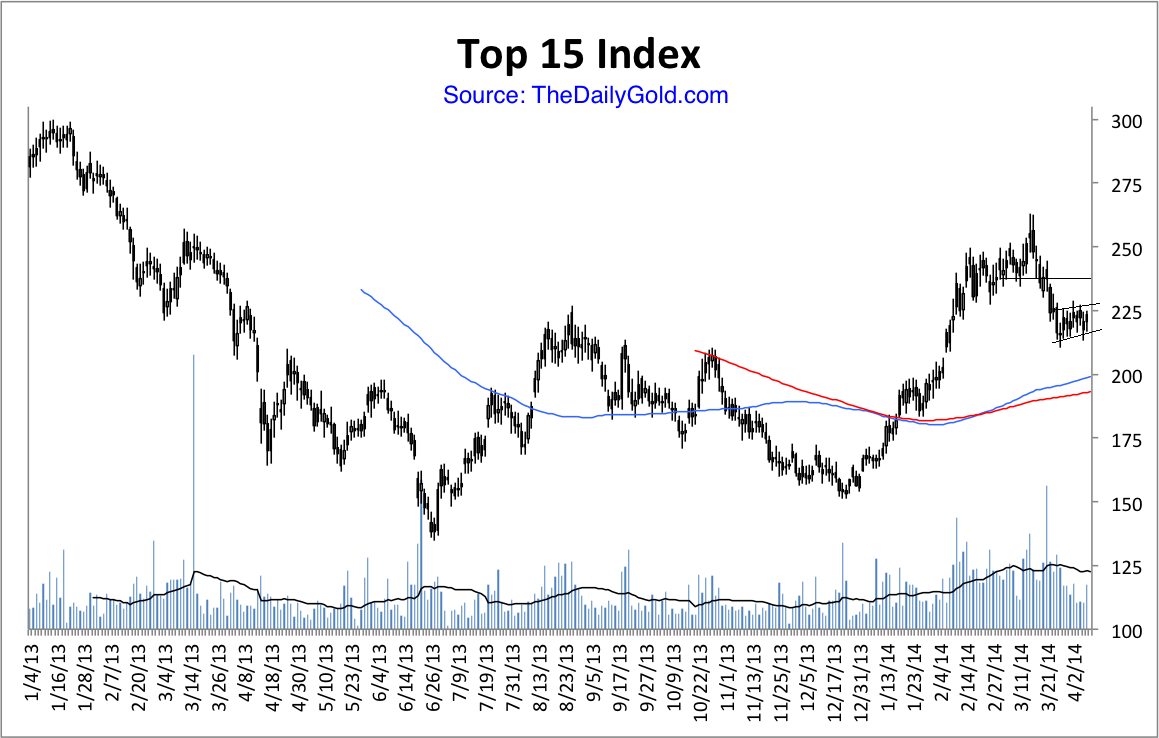
Why is this bottom taking so long? A few weeks ago we posited that it could be because of the extended topping process in 2011-2012. Perhaps that unusual topping process is giving way to an unusual bottoming process. In any event, the best plan is to wait patiently for the next oversold condition or in case we are wrong, wait for the next breakout. I don’t expect a breakout anytime soon. The indices look weak and TheDailyGold Top 15 Index (15 of our favorite companies) also appears to have downside potential in the coming days and weeks. Nevertheless, I am actively researching companies as well as watching their price action. The coming months could be your last best chance to accumulate the companies poised to benefit from the coming revival in precious metals. If you’d be interested in learning about the companies poised to outperform, then we invite you to learn more about our premium service.
Good Luck!
Jordan Roy-Byrne, CMT

As a general rule, the most successful man in life is the man who has the best information
 Imperialism Déjà Vu
Fact; The world’s resources are finite.
Fact; Supply is constrained and demand keeps growing along with the world’s population.
Fact; A sustainable and secure supply of raw materials and energy is becoming the number one priority for all countries.
Major powers are scrambling for as much of the world’s resources as they can control. Exploration and drilling intensify daily. Previously inaccessible or unprofitable areas are targeted – the days of easy access to the globe’s resources no longer exist.
Unseen wars in previously unheard of places – soon to become front page news – are beginning for resource control. Peace today, harmonious relations tomorrow are nothing but fleeting illusions.
Hydrocarbons, mineral resources, fresh water and arable land are finite.
Understand someday peak oil and gas proponents will be proven right.
Understand arable, productive farmland is disappearing from overuse, desertification and urbanization.
Understand the world’s current population of 7 billion people use 60 percent of our annual renewable freshwater supply.
The world’s population is projected to hit 10 billion by 2050 – global demand for food and water is expected to increase by 50% and 30% respectively by 2030.
“It should be pointed out that when we speak of wars in the last third of the twentieth century we are talking about civil wars. Between 1965 and 1999 if we look at those wars in which more than a thousand people were killed a year, there were seventy-three civil wars, almost all driven by greed to control resources—oil, diamonds, copper, cacao, coca, and even bananas.” William K. Tabb, Resource Wars
Try and imagine the coming pressure on governments in regards to sourcing resources on a national scale. The world’s most powerful nations are staking claims, through aggressive diplomacy, wherever vital reserves of resources can be found. It isn’t enough.
Nations are going to go to war over natural resources. Conflicts are inevitable.
South & East China Sea
China has been involved in territorial disputes with Japan and Taiwan over the Senkaku islands, and Vietnam over the Spratly islands.
China has also ramped up its naval presence in the South China Sea. Why? China’s energy starved and the areas off the coast of the Philippine province of Palawan are oil rich. In mid-2012, the Philippines and China came dangerously close to an armed conflict over the Scarborough Shoal in the South China Sea.
China’s increasingly contentious showdown with Japan in the East China Sea could prove to be even more dangerous. At issue are disputed Islands (Senkakus to the Japanese, Diaoyu to China) and the fishing rights and natural resources those islands would deliver to their owner.
The standoff has already resulted in several direct confrontations between China and Japan.
The U.S. has treaty obligations to Japan. Secretary of Defense Chuck Hagel recently warned China that any attack on the disputed islands would “fall under our security obligations.”
India-China Border
Chinese dam-building on the upper reaches of the Brahmaputra River has raised fears in India that Beijing might one day turn off critical water supplies.
India’s state oil company, Oil and Natural Gas Corp., accepted an invitation from Vietnam to explore for oil and gas in the disputed South China Sea escalating an already intense drama.
Both India and China are pushing to gain a foothold in the Arctic. Melting ice is opening passages for shipping and creating the conditions for a boom in the extraction of fossil fuels and minerals.
Both countries are building up their navies to project influence, and China’s presence in the Indian Ocean is expected to grow.
“India will be concerned by a growing Chinese naval presence in the western Indian Ocean, which it has always considered its preserve. It has tolerated a significant U.S. presence there, but it has never considered the U.S. an enemy.” David Shinn, a former U.S. ambassador in Africa
Arctic
The Arctic Council is made up of the eight Arctic nations: Canada, Denmark, Finland, Iceland, Norway, Russia, Sweden and the United States. These countries work through the Arctic Council to lay ground rules for governing the Arctic – the Council acts as a key vehicle for hashing out the not inconsiderable strategic stakes.
“With the Arctic ice melting, the region’s abundant supplies of oil, gas and minerals have become newly accessible, as have shortened shipping routes and open water for commercial fishing, setting off a global competition for influence and economic opportunities far beyond the nations that border the Arctic.” Yale.edu
China has recently won observer status on the council as has India, Italy, Japan, Singapore and South Korea.
Water War
Data scientists recently downloaded from a pair of NASA gravity-sensing Grace satellites show ground water is increasingly in short supply.
The biggest losses show up as red hotspots. Almost all of those red hotspots center on the major aquifers of the world. Grace shows us that groundwater depletion is happening at a very rapid rate in the arid and semi-arid parts of the world.
And the losses are staggering.
Parts of Turkey, Syria, Iraq and Iran along the Tigris and Euphrates rivers have lost 144 cubic kilometers of stored water. The majority of the water loss, about 60 percent, is due to reductions in groundwater.
There’s 600 million people living in the extremely dry 2,000 km stretch of land that extends from eastern Pakistan across northern India and into Bangladesh.
NASA’s Grace satellite measurements show a loss of 54km3 of groundwater a year.
At 54km3 of water loss per year, Lake Ontario (water volume of 1,639km³) would be dry in 30 years. A cubic kilometer of water equals about 264 billion gallons.
A 2005 Organization for Economic Co-Operation and Development Issues Brief suggested that conflicts and violence over access to water would likely increase because, “competition for water exists at all levels and is forecast to increase with demands for water in almost all countries. In 2030, 47% of world population will be living in areas of high water stress.”
In a 2012 report, the US director of national intelligence warned that overuse of water – as in India and other countries – was a source of conflict that could potentially compromise US national security. “Our Bottom Line: During the next 10 years, many countries important to the United States will experience water problems—shortages, poor water quality, or floods—that will risk instability and state failure, increase regional tensions, and distract them from working with the United States on important US policy objectives. Between now and 2040, fresh water availability will not keep up with demand absent more effective management of water resources. Water problems will hinder the ability of key countries to produce food and generate energy, posing a risk to global food markets and hobbling economic growth. As a result of demographic and economic development pressures, North Africa, the Middle East, and South Asia will face major challenges coping with water problems.”
The Pacific Institute, which studies issues of water and global security, found a fourfold increase in violent confrontations over water over the last decade. “There is a long history of conflicts over water resources, extending back thousands of years into myths, legends, and ancient history. But even now, in the modern world, disputes over access to water, the use of water as a weapon, and the targeting of water systems during conflicts remain all too common. It has been argued that water resources have rarely, if ever, been the sole source of violent conflict or war. But this fact has led some international security “experts” to ignore the complex and real relationships between water and security, which remain a major challenge. Indeed, our work suggests that the risks of water-related violence and conflict is growing, not diminishing, as population, resources, and economic and environmental pressures on scarce water resources increase. Many of these risks are materializing at the sub-national level rather than as disputes among nations, but even at the national level, there are growing concerns about tensions in Africa and parts of Asia that share international rivers but lack international agreements over how to manage those waters.”
Nations are going to increasingly compete for the world’s diminishing resources.
China is a surging military power, Russia is a resource powerhouse but politically corrupt and economically crippled. Japan is rebuilding its military. The U.S. is treaty bound to protect Japan and South Korea and will protect the Philippines in the face of Chinese aggression. Proxy conflicts in Africa, and elsewhere, between and among, U.S., Chinese, Indian and European backed forces will intensify in the future.
The Arctic will be an area of growing resource interest and rising conflicts.
A year ago, leading German industrial companies (to name four – BASF and Bayer who emerged from now infamous IG Farben, ThyssenKrupp, formerly two separate companies. Thyssen and Krupp both supported Hitler, the Volkswagen Group was founded on Hitler’s initiative) launched the Resource Alliance (Rohstoffallianz) for the purpose of securing the supply of selected raw materials for its shareholders and corporate members.
Germany’s Resource Alliance is advocating the use of military force to secure raw materials to keep Germany’s industrial machine chugging along.
Imperialism is the process whereby the dominant politico-economic interests of the time expropriate, for their own enrichment, the land, labor, natural resources and markets of others.
World War II gives us an excellent example of imperialism. The Nazi state gave German business cartels the opportunity to plunder the resources of occupied Europe.
Conclusion
Will future historians write that Iraq (oil), Libya (more than oil, Libya has one of the largest fresh water systems in the world contained in four major underground basins), Afghanistan and Syria, both literal gold mines of mineral wealth were the first battlegrounds in a continual war over resources?
Increasingly it’s going to be a resource centric world. Major powers will confront resource rich areas, in the left hand will be aggressive diplomacy – WE will build you bridges, schools, hospitals, transportation and power infrastructure in return for long term off take agreements for your resources. The right hand is understood to be a military club. Proxy conflicts, rebels, insurgents and civil war if you don’t agree or deal with someone else.
It isn’t if, it’s when do confrontations already underway, and the coming future conflicts spin out of control?
China’s after oil in the South China Sea and again it’s China but versus Japan in the East China Sea, both of whom are starved for energy.
India’s short of water, China controls the flow.
Russia annexes the Crimea, Putin’s eventual goal – the vast natural resources of the Ukraine. In 2008 Putin stopped NATO from signing up Georgia and Ukraine into its membership action plan. He then moved against Georgia. In 2013 he interrupted Ukraine’s signing of an association agreement with the EU. Now he’s annexed the Crimea and is on record stating that Ukraine is not a country but a territory and insists it should be divided. If Putin is successful in his bid for Ukraine what’s next? The Baltic states come to mind.
The German industrial complex, the Rohstoffallianz, is openly advocating imperialism.
An escalation in tension, and an increase in resource driven conflicts is certainly on my radar screen. Is the truth behind what’s increasingly going to drive future armed conflicts on your radar screen?
If not, it should be.
Richard (Rick) Mills
Richard lives with his family on a 160 acre ranch in northern British Columbia. He invests in the resource and biotechnology/pharmaceutical sectors and is the owner of Aheadoftheherd.com. His articles have been published on over 400 websites, including:
WallStreetJournal, USAToday, NationalPost, Lewrockwell, MontrealGazette, VancouverSun, CBSnews, HuffingtonPost, Beforeitsnews, Londonthenews, Wealthwire, CalgaryHerald, Forbes, Dallasnews, SGTreport, Vantagewire, Indiatimes, Ninemsn, Ibtimes, Businessweek, HongKongHerald, Moneytalks, SeekingAlpha, BusinessInsider, Investing.com and the Association of Mining Analysts.
Please visit www.aheadoftheherd.com
If you are interested in advertising on Richard’s site please contact him for more information, rick@aheadoftheherd.com
***
Legal Notice / Disclaimer
This document is not and should not be construed as an offer to sell or the solicitation of an offer to purchase or subscribe for any investment.
Richard Mills has based this document on information obtained from sources he believes to be reliable but which has not been independently verified.
Richard Mills makes no guarantee, representation or warranty and accepts no responsibility or liability as to its accuracy or completeness. Expressions of opinion are those of Richard Mills only and are subject to change without notice. Richard Mills assumes no warranty, liability or guarantee for the current relevance, correctness or completeness of any information provided within this Report and will not be held liable for the consequence of reliance upon any opinion or statement contained herein or any omission.
Furthermore, I, Richard Mills, assume no liability for any direct or indirect loss or damage or, in particular, for lost profit, which you may incur as a result of the use and existence of the information provided within this Report.


-
I know Mike is a very solid investor and respect his opinions very much. So if he says pay attention to this or that - I will.
~ Dale G.
-
I've started managing my own investments so view Michael's site as a one-stop shop from which to get information and perspectives.
~ Dave E.
-
Michael offers easy reading, honest, common sense information that anyone can use in a practical manner.
~ der_al.
-
A sane voice in a scrambled investment world.
~ Ed R.
Inside Edge Pro Contributors

Greg Weldon

Josef Schachter

Tyler Bollhorn

Ryan Irvine

Paul Beattie

Martin Straith

Patrick Ceresna

Mark Leibovit

James Thorne

Victor Adair