
Gold & Precious Metals
I want to make you aware of a possible major breakdown in the US dollar index and provide you with my gold forecast. If this scenario plays out then we will see the Euro explode to the upside and also see commodity based currencies like the Canadian dollar, and Aussie dollar rally. This would also be bullish for commodities in general like gold, silver, precious metals mining stocks etc…
The US dollar index chart below clearly shows a three year topping pattern with multiple price levels which when broken will trigger farther selling. These red horizontal lines on the chart show these price levels.
Critical support is around the 79.50 area which if breached should start a major wave of selling in the next few months. The initial wave of selling should take price all the way down to the 78.00 level before taking its first breather/pause.
*Trade Tip*
Most technical analysis books and traders think that the more times a support trend line has been touched the strong it becomes. That actually could not be any further from the truth.
Let me tell you how to trade trendlines.
1. You must have at least two pivot points (highs or lows) to be able to draw a trendline.
2. The 3rd and 4th touch of this line can be traded for a bounce.
3. Any touch of the trendline after the 4th is actually doing damage as it eats up the support volume.
4. A rising trendline like the one below clearly shows multiple pivot lows that when breached will trigger stops and flood the market with supply/sellers. It’s the perfect storm for a downward move.

Gold Forecast
My gold forecast has not changed in nearly a year as we wait for the gold market to bottom, then prove it’s self by breaking out of its basing pattern.
The bullish gold forecast is of the bigger picture. Most gold market traders and investors are caught up with the day to day price action and are growing tired of the range bound trading which gold has been doing for some time now.
In 2011 I pointed out the possible major topping pattern in gold, and that if price broke to new lows, then it would be lights out for at least a year if not two before the chart would build a new bullish base. And that leads us to my current gold forecast.
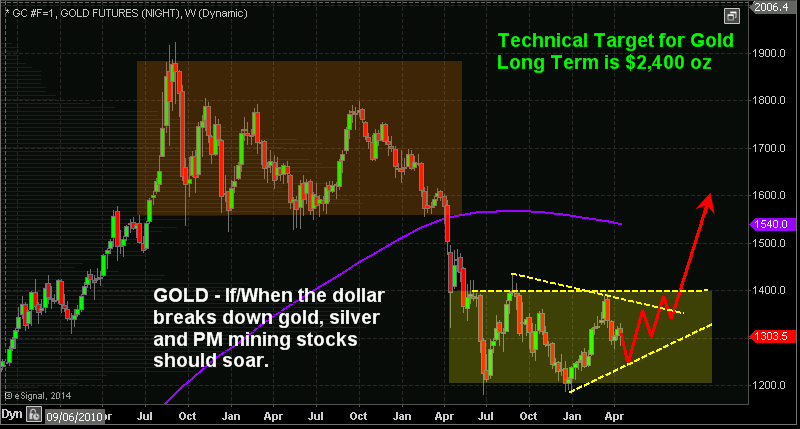
Gold Forecast & Gold Market Traders Conclusion:
In short, my gold forecast should be looked at from the big picture perspective. Getting involved in any gold stock, commodity or investment that is stuck in a range does carry more risk. It is easy to get shaken out of these positions a few times before the new bull market emerges.
The lowest risk position is to wait for the breakout of the basing pattern (yellow rectangle), only then can gold market traders get heavily involved to the long side.
Get My Weekly Gold Forecast FREE – www.GoldAndOilGuy.com
Chris Vermeulen
*******

Stocks remain under selling pressure this week as they have been since the start of the second-quarter of 2014. The Dow Jones Industrial Average reached a peak of 16,574 on April 4, and for the most part, it’s been downhill since then.
The selling appears to be mainly driven by institutions, the so-called “smart money” crowd persistently unloading shares in the late afternoon.
Interestingly, some of the stocks and sectors hit hardest with selling in recent weeks were among last year’s best performers. Meanwhile, last year’s laggards are performing well in April, despite the increased volatility.
For example, the hardest hit sectors this month include last year’s two top-performers: Biotechnology and Internet.
Just a year ago investors couldn’t own enough of the high-beta momentum stocks. Biotech shares surged 74.3 percent in 2013, the top-performing sector, while Internet retailers ranked a close second with a 73.5 percent gain. Internet software and services cracked the top 10 with a 48.8 percent gain.
Alas, momentum can cut both ways …
Since late February the Nasdaq Biotech Index has tumbled 21 percent, while the Dow Internet ETF (FDN) is down 13.9 percent.
And yet the selling hasn’t exactly been indiscriminant either. In fact, while many high-flying tech stocks have been hammered, other, more reasonably valued tech sectors are performing well.

The same pattern plays out among healthcare stocks. Sure, biotech shares have dragged the entire sector down, but health care equipment stocks and managed care providers are two sub-sectors that have been largely immune to the sharp selloff.
That tells me the recent correction in stocks is more about sector rotation within the stock market rather than broad-based selling of all stocks. The big money appears to be cashing in some of last year’s big winners, and moving money into more undervalued sectors within the market.
And who can blame them after 70 percent-plus gains in biotech and Internet stocks last year?
Now, the smart money is finally piling into some of the out-of-favor sectors from last year … stocks and sectors that I have favored since late 2013, expecting just such a reversal of fortune. Or as the astute Michael Santoli recently wrote: “The dominant themes of the sharp pullback have been a reversal of the winning investment trades of 2013 (which got very crowded and expensive).”
Case in point: Mining stocks. You can’t find a more maligned group during 2013 than precious metal stocks. The Philadelphia Gold and Silver Sector Index (XAU) of mining shares plunged 48 percent in 2013, but what a difference a few months can make. Mining stocks are up 7 percent year-to-date, even after the recent pullback in the gold price, and at the peak in mid-March XAU was up 20 percent.
In fact, commodities in general have provided positive performance for investors so far this year. In a big trend reversal from recent years, the Continuous Commodity Futures Price Index (CCI), an equal-weighted average of commodity prices, has gained 11 percent year to date. Beneath the surface, several markets are performing even better.
Besides an 8.3 percent gain in gold … natural gas is up 9 percent, corn has popped 18 percent, palladium is up 10.8 percent … and coffee is up a stunning 82.6 percent!
This rotation out of last year’s best-performing stocks and sectors has been swift, and it’s clear that hair-trigger institutional investors are behind the move. I have noticed a consistent pattern in recent weeks for stocks to trade higher in the morning only to fall victim to an afternoon swoon.
That’s a sure sign of “smart money” selling at work just prior to the close. The Smart Money Flow Index (SMFI) (see graph below) subtracts the first half-hour of emotionally driven buying and selling from the Dow and places more focus on the last hour of trading.

click for larger version
This is based on the theory that the first 30 minutes of trading is dominated by market orders from retail investors or index-tracking funds. Meanwhile, the “smart money” waits until the end of the day to make their move into, or out of, stocks in a big way.
According to Bloomberg data, the Smart Money Flow Index has plunged 8.8 percent since the beginning of March, while the Dow itself has declined just 2 percent. This means the stock market’s heavy-hitters have been eager sellers into the close.
A negative divergence like this, when the SMFI is falling faster than the Dow, is generally a sign of selling ahead and lackluster returns for stocks. That is, until the “smart money” starts buying again.
The good news is that most stocks and sectors are already approaching oversold levels now, and the recent correction is creating more attractive prices for long-term investors, especially in select biotech and internet stocks.
So keep a watchful eye on the market’s direction during the all-important last hour of trading. Look for more buying on strength into the close, rather than selling into market weakness, as a first sign that stocks are stabilizing and the correction may be ending.
Good investing,
Mike Burnick

Most investors get what they deserve, too…
In trying to beat the market, they end up underperforming it.
The reality is that most investors don’t have a clue what they’re doing. They’d be better off putting their money in a low-cost index tracking ETF and going to sleep for 20 years.
But that’s not the way human nature works. Everyone wants not just what the market gives them (beta), but also some extra helpings of returns (alpha).
The compulsion to seek alpha, and the below par results this often leads to, is writ large in the chart below from The Vanguard Group. It shows the median performance of stock funds versus their style benchmark over 36 months following a Morningstar rating.

The conclusion is clear: By chasing “hot” funds, investors underperform their benchmarks. A better strategy, based on the data set analyzed above, would be to buy the least popular funds.
As top fund manager Howard Marks wrote recently in Barron’s, “The road to above average performance runs through unconventional, uncomfortable investing.”
Our advice: Either take what the market gives you. Or choose the unconventional and uncomfortable path.
Trying to beat the market by following the crowd is a mug’s game.

The common currency declined against the U.S. dollar after stronger-than-expected U.S. economic data. Earlier yesterday, the Labor Department showed that the CPI rose 0.2% in March (above expectations for a 0.1% increase), while the core consumer price index (without volatile food and energy items) rose 0.2% last month (also above forecast of a 0.1% gain). Thanks to these better-than-expected numbers, the exchange rate tested the strength of the major support line. Will it stop sellers?
EUR/USD

From the weekly perspective, we see that EUR/USD still remains above the previously-broken long-term declining resistance line and the lower border of the rising trend channel (marked with brown). So, what we wrote in our previous Forex Trading Alert is still up-to-date.
(…) These two important lines still serve as major support. As you see on the above chart, the exchnge rate remains below the 2014 high and the rising resistance line (marked with red), which succesfully stopped growth in the previous month. From this perspective, it seems that as long as these key lines are in play, a bigger upward or downward move is not likely to be seen.
Let’s take a look at the daily chart. (click for larger chart)

As you see on the daily chart, EUR/USD slipped below the upper line of the declining trend channel and reached the 50% Fibonacci retracement level (based on the recent rally) earlier today. Although this support level encouraged buyers to act (which resulted in a corrective upswing), the pair still remains quite close to this important line. If it holds, we may see another corrective upswing in the near future. However, if it is broken, we will likely see further deterioration in the coming days and the initial downside target will be around 1.3777, where the long-term declining line is (please note that in this area is also the 50-day moving average). Additionally, the position of the indicators (sell signals remain in place) favors sellers at the moment.
Very short-term outlook: bearish
Short-term outlook: bearish
MT outlook: bearish
LT outlook: bearish
Trading position: In our opinion no positions are justified from the risk/reward perspective. We are not opening short positions just yet, because of the divergence on the long-term charts (we wrote more about this situation in our Forex Trading Alert posted on Thursday), however we will quite likely open it once we see some kind of confirmation.
GBP/USD

![]() Larger Image (all charts are linked for larger images – Ed)
Larger Image (all charts are linked for larger images – Ed)
From the weekly perspective, we see that the situation hasn’t changed much. So, what we wrote in our last Forex Trading Alert is still up-to-date.
(…) GBP/USD still remains below the strong resistance zone created by the 2009, 2011 and 2014 highs, which suggests that further deterioration should not surprise us. In fact, it’s likely enough to justify having a speculative short position open (the one that was opened yesterday is already profitable).
To have more complete picture of the current situation in GBP/USD, let’s take a look at the daily chart.

In our Forex Trading Alert posted on Thursday, we wrote the following:
(…) GBP/USD (…) reached the 2014 high earlier today. If this strong resistance level holds, we will likely see a bearish double top pattern. In this case, the initial downside target will be the medium-term rising green line (currently around 1.6676). If it is broken, we may see a drop to the lower border of the orange rising trend channel (around 1.6550), which corresponds to the April low. (…) Please note that the current position of the indicators suggests that correction is just around the corner (…)
As you see on the above chart, GBP/USD extended declines and broke below the medium-term rising green line earlier today. Although this deterioration was only temporarily and the exchange rate came back above this line, sell signals remain in place, which suggests that another attempt to move lower should not surprise us. If this is the case, the above-mentioned downside target will be in play.
Very short-term outlook: mixed with bearish bias
Short-term outlook: bearish
MT outlook: bearish
LT outlook: mixed
Trading position (short-term; our opinion): Short. Stop-loss order: 1.6855. Please note that even if GBP/USD breaks above the 2014 high (and stop-loss order works), we’ll consider re-opening short positions around the 2009 high. At this time, however, it seems that these levels will not be reached before we see another sizable downswing – and thus the current short positions are still justified.
USD/JPY

Looking at the USD/JPY from the monthly perspective, we see that the exchange rate remains below the long-term declining resistance line. Therefore, even if the pair erases losses and climbs above the April high, it seems that further gains will be limited around 105.80, where the major long-term resistance is. We might open a speculative long or short position after the currency pair breaks above the long-term resistance line, or invalidates such breakout.
Having discussed the above, let’s move on to the daily chart.

From this perspective, we see that there was another attempt to break above the upper green line, but the buyers failed, which resulted in a drop to the lower support line. If it holds, we may see another try to close the day above the upper support/resistance line. However, if it is broken, we will likely see a drop to the March 14 low or even to the February low. Nevertheless, we should keep in mind that the CCI and Stochastic Oscillator generated buy signals, which suggests that the pro growth scenario is more likely at the moment.
Very short-term outlook: mixed with bullish bias
Short-term outlook: mixed
MT outlook: bullish
LT outlook: bearish
Trading position (short-term): In our opinion no positions are justified from the risk/reward perspective at the moment.
USD/CAD

As you see on the above chart, USD/CAD extended gains and approached the previously-broken green support line earlier today. Despite this improvement, we noticed similar price action to the one that we saw yesterday – the exchange rate gave up some gains and declined. If the pair extends losses, we may see a pullback to around 1.0909 (where the Feb.19 low is) or even to the April low of 1.0857. On the other hand, if the buyers manage to push the exchange rate higher, we may see an increase to the major resistance line (currently around 1.1026). Please note that the pro growth scenario is reinforced by the current position of the indicators (the RSI bounced off the level of 30, while buy signals generated by the CCI and Stochastic Oscillator remain in place).
Very short-term outlook: mixed with bullish bias
Short-term outlook: mixed
MT outlook: bullish
LT outlook: bearish
Trading position (short-term): In our opinion no positions are justified from the risk/reward perspective at the moment.
USD/CHF

As you see on the above chart, the situation hasn’t changed much as USD/CHF remains around the lower border of the blue rising trend channel. Therefore, what we wrote yesterday, is still valid.
(…) If the buyers do not give up and break above this resistance line, we may see an increase to (at least) 0.8813, where the Apr.1 low is. However, if the fail, we will likely see a pullback to the April low or even to the declining brown line (currently around 0.8718). Please note that the RSI bounced of the level of 30, while the CCI and Stochastic Oscillator generated buy signals, which suggests that another attempt to move higher should not surprise us.
Very short-term outlook: mixed with bullish bias
Short-term outlook: mixed
MT outlook: bearish
LT outlook: bearish
Trading position (short-term): In our opinion no positions are justified from the risk/reward perspective at the moment.
AUD/USD

Quoting our last Forex Trading Alert:
(…) the pair still remains below the resistance zone created by the 70.7% Fibonacci retracement (based on the entire Oct.-Jan. decline). If it holds, we may see a pullback in the coming days. In this case, the downside target for the sellers will be the previously-broken upper line of the trend channel. Taking into account the current position of the indicators (the RSI is overbought, while the CCI and Stochastic Oscillator generated sell signals), it seems that we will see another attempt to realize the bearish scenario in the following days.
Looking at the above chart, we see that AUD/USD gave up the gains and reversed earlier today. With this downswing, the sellers erased not only all yesterday’s gain, but also pushed the exchange rate below Friday low. Additionally, the current position of the indicators (sell signals remain in place) still favors sellers, which suggests that the bearish scenario from our last Forex Trading Alert is likely to be seen in the coming days.
Very short-term outlook: bearish
Short-term outlook: mixed with bearish bias
MT outlook: bearish
LT outlook: bearish
Trading position (short-term): In our opinion no positions are justified from the risk/reward perspective at the moment.
Thank you.


![]()
(1) Cash Dividend On The Way From Caledonia Mining Corp.
(TSE:CAL.CA) triggered: 04/15/2014


-
I know Mike is a very solid investor and respect his opinions very much. So if he says pay attention to this or that - I will.
~ Dale G.
-
I've started managing my own investments so view Michael's site as a one-stop shop from which to get information and perspectives.
~ Dave E.
-
Michael offers easy reading, honest, common sense information that anyone can use in a practical manner.
~ der_al.
-
A sane voice in a scrambled investment world.
~ Ed R.
Inside Edge Pro Contributors

Greg Weldon

Josef Schachter

Tyler Bollhorn

Ryan Irvine

Paul Beattie

Martin Straith

Patrick Ceresna

Mark Leibovit

James Thorne

Victor Adair