
Gold & Precious Metals
Briefly: In our opinion speculative short positions (half) in gold, silver, and mining stocks are justified from the risk/reward perspective.
The history repeats itself once again – gold just attempted to move higher but failed to ignite anything more than a small daily rally. Let’s see if there’s anything that this can tell us (charts courtesy of http://stockcharts.com).
Click HERE or chart for larger view

There’s one clue. It’s not a very strong one, but at least we have something new to comment on. The last 2 sessions were very similar to what we had seen at the beginning of the month. Back then gold declined quite visibly, so perhaps the same reaction will be seen also this time. In this case, such a decline would have more bearish consequences, as it would take gold below the previous lows and such a breakdown would likely lead to further declines.
Other than that, there’s not much that we can say about the changes in the gold market itself. What we wrote about gold in the previous alert remains up-to-date:
We wrote that the strength that we could see here would likely be temporary. It turned out that the rally that this reversal generated was indeed very small and temporary. We saw another lower intra-day high in gold, and the move higher materialized on low volume. We’re once again seeing this bearish combination. If the USD Index confirms its breakout, gold might finally break below the short-term support.
How far can it go initially? Our best guess at this particular moment (this might change as the situation develops) is the $1,200 level or close to it. One of the ways to estimate the size of a given move is to assume that the move following the consolidation (which we’ve been seeing since the beginning of April) will be similar to the one preceding it. In this case, the move following the breakdown could be similar to the March decline, and such a move would take gold close to the $1,200 level. This level is very close to the 2013 lows, so we expect gold to pause there (but not to end the decline).
There is not much to comment on in case of silver and mining stocks but the situation in the USD Index has changed more visibly.

The U.S. dollar moved higher once again and almost confirmed the breakout above the declining resistance line. Precious metals are not reacting yet. Unless metals start to react to the dollar’s strength (by declining) we will view this as a sign of their strength. For now we still think that the reaction is delayed – not really absent.
One of the reasons for the lack of reaction could be the situation in the silver market.
Click HERE or chart for larger view

Silver is right at its support line. In addition to the 2013 lows this is the key support level that prevents silver from moving much lower – to the $14 – $16 target area. Once this level is broken, silver may and likely will move sharply lower. Being this significant, it’s no wonder that this support line is not easy to break. Since gold, silver, and mining stocks are highly correlated in the short term, it’s also no wonder that silver’s refusal to move lower already is accompanied by a similar refusal in the case of gold and mining stocks.
Summing up, the outlook for gold, silver, and mining stocks remains bearish, but not extremely bearish, which means that we are not increasing the size of the short position just yet. Precious metals are not responding strongly to the dollar’s rallies so far, but it seems that investors and traders are simply waiting for a confirmation of the breakout in the USD Index (there have been cases when the metals’ reaction was delayed in the past).
To summarize:
Trading capital (our opinion): Short positions (half) in: gold, silver, and mining stocks with the following stop-loss orders:
- Gold: $1,326
- Silver: $20.30
- GDX ETF: $25.20
Long-term capital (our opinion): No positions
Insurance capital (our opinion): Full position

Or, how long does it take the Street to identify an elephant in the room? Apparently the answer to that question is a time period longer than should be the case. As portrayed in the chart below, Agri-Food prices have been rising fairly dramatically thus far this year. With an average gain of about 10% since the beginning of the year, eating is becoming far more expensive. Rather than a short-term phenomenon, higher prices for Agri-Foods over time are part of the future, an unavoidable one.

 Prices rise for Agri-Foods when demand grows faster than supply. The world wants to eat more dairy products, butter included, and broilers, or table chicken. Supply simply does not respond in short-term to that increased demand. Response to higher demand by the marketplace is simply to raise prices for the commodity. A milk cow does not check the internet each morning for wholesale price of butter, and decide to produce more milk fat in response to higher quotes. And you can be assured that laying hens to do not try to lay more eggs when chicken prices are rising.
As chart to right portrays, prices for Agri-Commodities have been rising for quite some time, and recently reached a record high. That history suggests that something different has been happening with Agri-Commodity prices. That something different is that world demand for food is beginning to bump up against the world’s long-term ability to supply food. Higher prices for beef will not change the reality that it takes about nine months for a calf to be born. The internet cannot change that fact. Higher prices for Agri-Commodities will not create another acre of arable land in either China or the U.S.
In top chart prices per pound for U.S. broilers, table chicken, are plotted. Those prices recently hit another new high. Chicken is both a price bargain relative to beef for consumers and an economic bargain to the world. To produce a kilogram of chicken requires slightly more than two kilograms of grain while with beef thirteen kilograms are required. (Agrimoney(2013), p. 150) Higher demand for chickens means that demand for feed grains should rise. As the price of soybeans shows in the second chart, strong global demand for animal feed has pushed up the prices of soybeans. Regardless of growth rate of China’s GDP, the chickens in that country still eat every day. More than half of soybean harvest is destined to become chicken feed. Soybeans
And we can assure you that the internet cannot produce a single soybean. Still requires a farmer in the field using equipment, fertilizer, and seed. Still requires someone to gather, process and move those soybeans around the world in order to feed global consumers. In that process money, our real interest, flows from consumers to farmers. Agri-Equities are the ultimate benefit of this flow of money, and they remain largely ignored by the investment community.
Ned W. Schmidt,CFA is publisher of The Agri-Food Value View, a monthly exploration of the Agri-Food Super Cycle, and The Value View Gold Report, a monthly analysis of the real alternative currency. To contract Ned or to learn more, use either of these links: www.agrifoodvalueview.com or www.valueviewgoldreport.com

The news on uranium mine closures seems to be coming regularly now.
Last week, I wrote about major producer Cameco delaying its Millennium mine in Saskatchewan. And this week we got news of another high-profile producer that’s being lost to the market.
That’s the Imouraren mine in Niger. Being developed by French nuclear major Areva.
Imouraren had been scheduled to open this year, alongside Areva’s two existing mines in Niger. But sources in Niger’s mining ministry were quoted as saying that development of the project will now be suspended–as part of a new production agreement Areva is signing in the country.
Once again, the reason for the deferral is reportedly simple economics. With Reuters noting that Imouraren won’t proceed “until uranium prices improve.”
This is another significant loss for global uranium supply. The Imouraren mine had been slated to be a sizeable one–with a total resource of more than 100 million pounds. Production capacity had been announced at over 11 million pounds of uranium yearly.
None of that will now see the light of day. At least not for the foreseeable future.
It’s possible that some of the delay is a result of politics. With Areva lately having been locking in a disagreement with Niger’s government about fiscal terms for uranium production in the country.
But it’s also completely plausible the delay is simply a matter of low prices. Fitting with the pattern we’ve seen lately of almost every major uranium development globally being shelved. From Canada to Africa to Kazakhstan, there just doesn’t seem to be any appetite for new projects in current market environment.
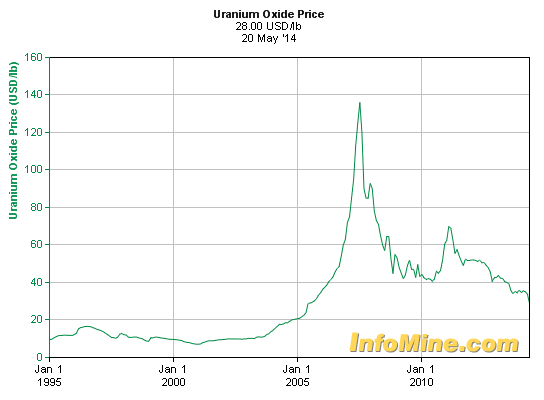
That’s not surprising at today’s prices. Which see uranium oxide sitting at an ultra-low $28 per pound on the spot market.
Few producers new or old are making money at these rates. We’ll see how long supply can hold out if mining developments keep disappearing.
Here’s to a shrinking market,
dforest@piercepoints.com / @piercepoints / Facebook
![]()

In our view, there’s a lot going on in the market, let’s take a look and make some calls:
Every weekend, we get our last weekly data then update our research. This on the surface looks pretty bullish:

But one thing I’ll caution you on is the following:

We’re at a level where the 6 month future return is likely negative. We’ll know a lot more when this indicator turns lower.
And as for the barometer, we have the market breaking out from the consolidation.

The question is will this market rally continue and is it worth playing? The fact that bonds are rallying with stocks is huge. While bonds tend to be right, if they reverse lower here, we’ll see a much larger advance than most are expecting. One is right. And we’ll generally only know in hindsight.
As for gold, I spent the weekend populating some of our blogs with arguments that gold is about to make a large move. We’re positioning for it this morning in our gold options trader service. Here are a couple of those charts: Visit www.stockbarometer.com to learn more.


Regards,

 With the United States celebrating Memorial Day, today a 40-year market veteran sent King World News an incredibly powerful piece warning that there is extraordinary complacency, even as the world’s financial system is in danger of a meltdown. This is an extremely timely and fascinating piece from Robert Fitzwilson, founder of The Portola Group. Below is what he had to say in this exclusive piece for King World News.
…continue reading HERE

-
I know Mike is a very solid investor and respect his opinions very much. So if he says pay attention to this or that - I will.
~ Dale G.
-
I've started managing my own investments so view Michael's site as a one-stop shop from which to get information and perspectives.
~ Dave E.
-
Michael offers easy reading, honest, common sense information that anyone can use in a practical manner.
~ der_al.
-
A sane voice in a scrambled investment world.
~ Ed R.
Inside Edge Pro Contributors

Greg Weldon

Josef Schachter

Tyler Bollhorn

Ryan Irvine

Paul Beattie

Martin Straith

Patrick Ceresna

Mark Leibovit

James Thorne

Victor Adair