
Gold & Precious Metals
Barry Ritholtz is out with another article spelling more doom for the precious metals sector and the gold bugs. The self proclaimed “Gold Agnostic” penned a 2500 word missive in January which followed a blog post amid the spring 2013 collapse titled “What are Gold’s Fundamentals.” For the record, Ritholtz’s calls on the markets and Gold have been very good. He was bullish during most of the 2001-2011 advance and sold out prior to the 2013 breakdown. Give credit where credit is due. Yet, while the anti-gold and anti-gold bug mainstream eat up his Gold analysis like a lap dog we have to mention some errors and a startling omission of Gold’s key driving force.
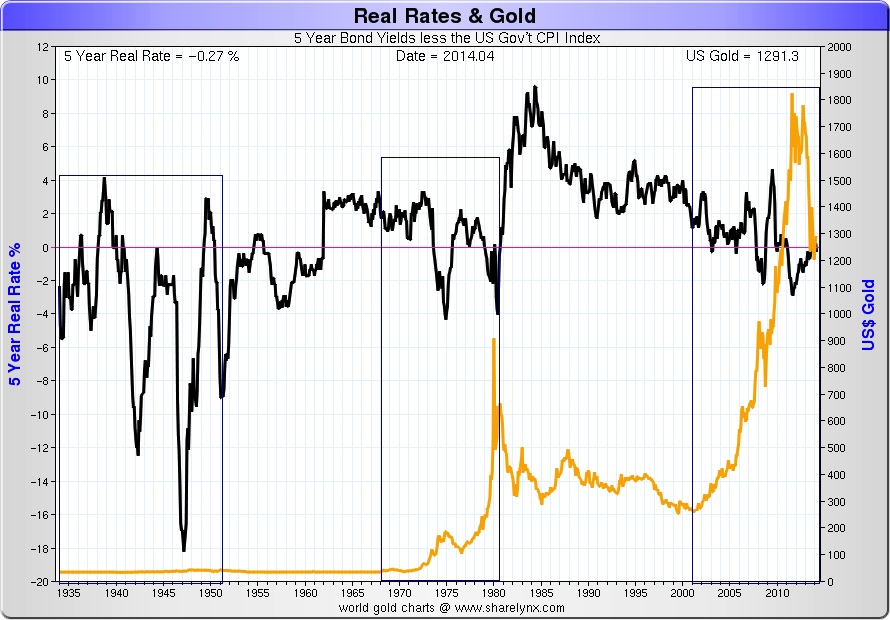
Despite having spilled tons of ink on the subject, Ritholtz has continually failed to mention the major driver of Gold which is the direction of real interest rates. Ironically, Ritholtz often writes about following the data and avoiding narratives, yet he ignores this when discussing the yellow metal. Gold rises when real interest rates are negative or declining sharply. Its simple to understand. If investors and fund managers can earn a real rate of return on a money market fund, CD, or bond then there is no need for an alternative currency. If you can’t earn a real rate of return safely then you’ll seek alternative currencies such as Gold and Silver. The following chart from Nick Laird shows real rates and Gold over the last 80 years.
The venerable Ned Davis Research, as reported in Barrons yesterday noted that real interest rates recently have turned favorable for Gold. That is probably why they concluded that the bull is alive but wounded. Capital Economics, as reported by Frank Els also notes in a report that the real yields have declined. I happen to agree with NDR’s view that the short-term technical situation is not conducive to speculative positions. Last week we wrote that Gold could fall to $1080 before the bear ends. A weekly close below $1200 would likely trigger that final washout.
Ritholtz’s arguments for the end of Gold’s secular bull are surprisingly weak. Of course none revolve around the end to negative real rates. He cites a chart and some commentary which regards the dollar rebound as potentially an epic squeeze. This Business Insider style observation bears no reality. The US Dollar index is up less than 2 points in the last month and the commitment of traders report does not show a huge speculative short interest conducive to a short squeeze. Ironically, the epic squeeze is likely to come in Silver and on a lesser scale Gold. Gross short positions in Silver reached a new all time high last week. Further weakness in both metals could setup a large short squeeze in the coming months.
By now you know that Ritholtz’s conclusion (the bullish factors from 2001-2011 are gone) is incomplete and irrelevant. His five points help explain the bear market in Gold but none of them reveal anything about an end to negative real rates, which is the key driving force. If one wants to make a case that the secular bull is over then they need to make the case that real rates have bottomed and will rise indefinitely. This is what happened following 1951 (commodity peak with gold price fixed) and 1980. With the latest uptick in inflation and decline in yields, real rates are again negative and trending favorably for Gold.
Statistically speaking inflation has almost no downside and has in fact started to trend higher. Core inflation in the OECD countries is at an 18 month high while inflation in Canada is at a two year high. The CPI and PCE in the US have started to tick up. MIT’s Billion Prices Project which has led the CPI at key turning points since 2009 has accelerated higher since December 2013. This implies the CPI has further upside. With regard to rates, we know that each 1% rise in rates equates to an additional ~$180 Billion in interest costs. That is over 6% of FY 2013 federal revenue. Policy makers want but more importantly need inflation to get the debt burden under control. Real rates were strongly negative for much of 1942 to 1949. Inflation surged while real growth stagnated but we got the debt burden under control. It led to a tremendous uninterrupted equity advance from 1949 to 1956. However, that was after a rip roaring advance in hard assets.
Hopefully this missive cut through both the bull and bear BS on Gold. Gold bugs will shamelessly promote anything as bullish while gold bears will mention anything but the only fundamental that matters, negative real interest rates. The historical bear analogs, sentiment and negative real rates argue that the precious metals complex is nearing the conclusion to a cyclical bear market within a secular bull. If you’ve followed my work you will know that I have been bearish since the hard reversal in March. Patience and discipline will be the name of the game over the coming weeks. Discipline is required to exit hedges at the right time while patience is required to buy as low as possible. I am looking at JNUG (3x long GDXJ) as well as several juniors I believe have exceedingly strong upside potential over the coming quarters and years. If you’d like to know which stocks we believe are poised to outperform after the coming low, then we invite you to learn more about our service.
Good Luck!
Jordan Roy-Byrne, CMT

 This morning the European Central Bank tried something different. As Bloomberg reported:
Draghi Takes ECB Deposit Rate Negative in Historic Move
The European Central Bank cut its deposit rate below zero and said it would announce further measures later today as policy makers try to counter the prospect of deflation in the world’s second-largest economy.
ECB President Mario Draghi reduced the deposit rate to minus 0.10 percent from zero, making the institution the world’s first major central bank to use a negative rate. Policy makers also lowered the benchmark rate to 0.15 percent from 0.25 percent.
The promise of further measures today “has stoked up hopes that the ECB is going to unleash a huge bazooka on the market in the press conference,” said Philip Shaw, chief economist at Investec Securities Ltd. in London. While he thinks that quantitative easing is “very unlikely” now, “it may well be that what the ECB just said is stoking up hopes that QE could be on the cards after all. ”
Later in the day, Draghi fleshed out his thoughts in the aforementioned press conference. From Business Insider:
Mario Draghi Explains The Decision
In his introductory statement, Mario Draghi unveiled targeted longer term refinancing operations (TLTROs). The initial size of TLTROs is about €400 billion and all TLTROs will mature in September 2018, or in about 4 years. Two successive TLTROS will be conducted in September and December 2014. “From March 2015 to June 2016 all counter parties will be able to borrow quarterly up to three times the amount of their net lending to the euro area non-financial private sector, excluding loans to households,” said Draghi.
The ECB is “intensifying preparatory work for outright purchases in the ABS [asset backed securities] market.” It will also suspend its weekly securities market program (SMP) sterilization.
The Q&A has begun. Here are the key highlights:
• There will be additional reporting requirement to ensure lending goes to real economy. For all practical purposes the ECB has reached the lower bound of rate policy, Draghi says.
• “The main reason to commit to sterilization by my predecessor first and by myself later was based on the effects that this additional liquidity might have on inflation,” says Draghi. “This decision takes place in a background characterized by low inflation, weak recovery and weak monetary and credit dynamics, that’s the reason for suspending this commitment.”
• “Being able to have unanimity on such a complex set of instruments means a very very extraordinary degree of consensus,” says Draghi. “What is in this TLTRO that makes it different? The cost obviously, it is very low, the term maturity is four years, and the termination that this money not be spent on sovereigns and on sectors that are already experienced or have just come out of a bubbly situation, that’s what in it.”
• We don’t see deflation says Draghi.
• “There is a deep misunderstanding here. The rates we’ve changed are for the banks, not for the people,” says Draghi. It’s wrong to think we want to “expropriate savers. …The concerns of savers should be taken very seriously.” Draghi however adds that the decision to lower rates for households is the decision of banks, not the ECB.
Some thoughts
Anyone who finds this surprising hasn’t been watching Europe’s inflation numbers. As most of the eurozone including, recently, Germany slipped towards deflation, it was clear that the European Central Bank would have to launch a new currency war offensive, and soon. So here it is: negative interest rates on bank excess reserves (though not yet on consumer bank accounts) along with direct infusions of cash into the banking system.
This will have a modest effect on bank lending and economic activity, but it won’t stop the eurozone’s downward spiral because liquidity doesn’t fix insolvency. In other words, if the system’s collateral isn’t as valuable as the debt it supports, then the system is in trouble. And coercing banks into making more loans against inadequate collateral will not help the situation.
So the next, equally inevitable stage in Europe’s offensive will be some form of QE, and apparently the ECB has decided that asset backed bonds will be the instrument of choice. The idea is that by buying, say, mortgage backed bonds with newly-created euros, the ECB will be able to direct those euros back into the housing market, which will in turn get people spending again. If this sounds familiar, it’s the script the US followed in the first half of the 2000s, which lead to the housing bubble and the subsequent crash.
But before this bubble bursts, the euro will fall due to soaring supply, which is the same thing as saying that the dollar will soar. This will be deflationary for the US, producing a string of “unexpected” misses in corporate earnings, GDP and inflation, and will leave Washington with no choice but to respond with renewed debt monetization and money printing and in all probability negative interest rates of its own. And so it will go, until we figure out that depreciating fiat currencies against each other is a zero-sum game that simply makes the rich richer and everyone else much poorer.
One would expect gold to be the main beneficiary of crazy policies like negative interest rates, and it did pop on Draghi’s news. But the ongoing manipulation of precious metals prices makes this far less of a sure thing than theory and common sense would indicate. Fundamentals always win in the end, but in a world of manipulated markets the timing is completely unknowable.
ALSO ON DOLLARCOLLAPSE.COM
Welcome to the Currency War, Part 14: Russia,China, India Bypass the … 36 comments
Is THIS The End? 16 comments
-
Why We’re Ungovernable, Part 9: Crime Becomes Growth 9 comments

Gold jumps 1 pct after ECB rate cut, easing measures
Dealers who had bet against gold in the run-up to the announcement rushed to cover positions as the metal held above $1,240 an ounce, traders said.- Reuters
Even investors who typically eschew precious metals have been hard-pressed to ignore the platinum industry this year. The longest strike in South African history paired with surging Asian demand is set to push the metal back into a physical deficit in 2014 – and could have repercussions for years to come. While gold remains the most conservative choice for saving, the “industrial precious metal” platinum is a compelling investment for those, like me, who are bullish on global net economic growth.
China in the Driver’s Seat
As with gold and silver, examining platinum demand takes us to the Eastern hemisphere and China’s rapidly expanding economy. In particular, the growing Chinese middle class is generating massive demand for new automobiles, which in turn is consuming plenty of platinum.
For the last ten years, autocatalysts have composed 40-50% of total global platinum demand. Autocatalysts use platinum to clean the emissions of motor vehicles, and 95% of the world’s new passenger cars come equipped with them. Both auto production and emissions standards are steadily increasing around the world, especially in the huge emerging market of China.
Global auto production grew 4% in 2013 to almost 89 million units. According to IHS, Inc., world auto sales will continue to grow to more than 100 million units by 2018 – that’s 12% growth in the next five years. And you can bet that growth won’t be coming from the US.
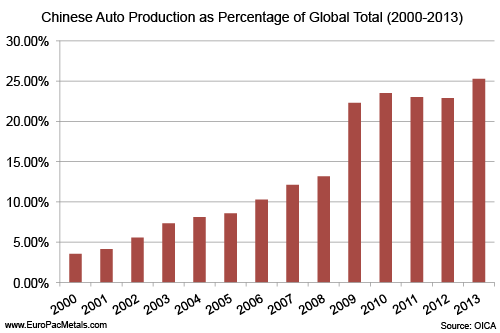
China’s share of global vehicle production has exploded from under 4% in 2000 to an astounding 25% last year. I expect this demand to keep expanding as more Chinese citizens grow wealthier and are able to enter the auto market.
Chinese vehicle production grew almost 15% in 2013 and should grow another 10% in 2014. New emissions standards that went into effect last year are already forcing Chinese auto manufacturers to use more platinum. Indeed, platinum use in Chinese autocatalysts increased 33% in 2013.
I believe this trend will continue as the Chinese government tries to tackle the country’s critical pollution crisis. Just last week, the PRC announced that it would be removing 6 million vehicles from China’s roads by the end of the year because they no longer meet emissions standards.
Platinum as an Investment
Though industrial applications have the largest impact on its price, platinum remains a sought-after precious metal with growing demand from the investment and jewelry sectors. Jewelry accounts for well over 25% of platinum demand, and that figure has been steadily increasing. Once again, we look east for the most compelling numbers.
Chinese platinum jewelry demand represents about 65% of the world’s total and is expected to expand 5% this year. But India is the real bright point – high import tariffs imposed on gold by the Indian government in 2013 have created shortages and very high premiums on the yellow metal, driving consumers to replace gold with platinum. India’s platinum jewelry market has seen 30-50% growth every year so far this decade. 2014 should continue that trend with a 35% projected growth in platinum jewelry sales.
While Eastern investors buy physical platinum in the form of jewelry, Westerners are piling into relatively young exchange-traded funds (ETFs) backed by the metal. Platinum ETFs did not exist until 2007, and the first South African-based platinum ETF began just last year. 2013 saw a 55% increase in the amount of physical platinum held by ETFs, totaling 2.5 million ounces.
As short-term traders wake up to the same supply/demand issues summarized in this commentary, the trend of increasing retail investment may well absorb a greater share of the limited supply.
Just as with gold and silver, I believe platinum ETFs are inferior to physical bullion for long-term investment. However, many investors prefer the liquidity they offer, and as a fundamental data point, they should not be ignored.
Supply Goes from Shaky to Shocked
With promising new sources of demand, platinum supplies have been under pressure. To put into perspective how little platinum is available, simply compare it to gold and silver. Over the past decade, about 13.5 times more gold and 100 times more silver have been mined than platinum. The vast majority of the meager platinum supply comes from just two countries – South Africa and Russia. Troubles in both of these countries are pushing supply constraints into a market shock.
Beginning in January, more than 70,000 South African miners went on strike against the three largest platinum producers in the world – Anglo American Platinum, Impala Platinum, and Lonmin. This is the longest strike in South African history and is estimated to have already reduced global platinum production by 40%. About 1 million ounces of platinum will not be mined this year due to the strikes.
No matter when these wage disputes are resolved, they’re going to have a deep impact on the platinum industry. Wages are already one of the biggest expenses of mining, and the Association of Mineworkers and Construction Union (AMCU) is demanding a doubling of wages by 2017. They’ve already rejected an offer of a 10% increase.
This much seems clear: wages are going to go up and the industry will have to restructure its operations to handle the extra expense. The average global all-in cost of production (including capital expenditures and indirect overhead costs) is already at about $1,595 per ounce of platinum – 10% above the current market price.
As the cost of business rises, some industry analysts are forecasting that Lonmin and perhaps other companies will be forced to keep some of their mines closed after the strikes end. This could affect the platinum market for many years into the future. Large mining operations cannot be started and stopped at the drop of a hat, and it may take a significant increase in the price per ounce to justify reopening any shuttered mines.
Meanwhile, there’s the possibility that Russia’s annexation of Crimea could draw stricter economic sanctions from the United States and the European Union. How this would affect Russia’s giant mining industry is hard to tell, though it has already put a lot of upward pressure on the price of palladium, another important platinum group metal (PGM). Russia is the world’s largest producer of palladium and is widely suspected of having exhausted its official reserves of the metal. This rumor, combined with the news that Russia has been exporting abnormally large amounts of palladium to Switzerland in anticipation of economic sanctions, helped to drive the metal’s price to its highest since 2011 in May.
The rising price of palladium and its ever-deepening physical deficit might even spur more producers to pay the extra for platinum, which can be more efficient than palladium in some autocatalysts. Generally, any limitations on Russian mining are bullish for all PGMs, and I am waiting for platinum to follow palladium’s spike.
An Opportunity to Diversify
All told, Thomson Reuters GFMS is predicting at least a 700,000-ounce physical platinum deficit this year. It projects that platinum will pass $1,700 per ounce by the end of 2014, a 18% increase from today’s price. Johnson Matthey is even more pessimistic (or optimistic, from the point of view of a platinum investor), predicting a deficit of more than 1.2 million ounces – the largest since 1975.
Even precious metals bears cannot deny the robust fundamentals for platinum this year. Investors who have already formed a bedrock for their portfolio with gold should consider adding physical platinum to increase future returns.
Peter Schiff is Chairman of Euro Pacific Precious Metals, which sells high-quality physical platinum, gold, and silver coins and bars.
Click here for a free subscription to Peter Schiff’s Gold Letter, a monthly newsletter featuring the latest gold and silver market analysis from Peter Schiff, Casey Research, and other leading experts.
And now, investors can stay up-to-the-minute on precious metals news and Peter’s latest thoughts by visiting Peter Schiff’s Official Gold Blog.

 Canadian Oil Sands is a pure investment opportunity in light, sweet crude oil. Co. indirectly owns a 36.74% interest in the Syncrude Joint Venture (“Syncrude”).
Syncrude is involved in the mining and upgrading of bitumen from oil sands near Fort McMurray.
Co. also indirectly owns 36.74% of shares of Syncrude Canada Ltd. (“Syncrude Canada”). Syncrude Canada operates Syncrude on behalf of the owners and is responsible for selecting, compensating, directing and controlling Syncrude’s employees, and for administering all related employment benefits and obligations.
Click Chart or HERE for larger view

Briefly: In our opinion speculative long positions are still favored (with stop-loss at 1,885, S&P 500 index).
Our intraday outlook is neutral, and our short-term outlook is bullish, following a breakout above consolidation:
Intraday (next 24 hours) outlook: neutral
Short-term (next 1-2 weeks) outlook: bullish
Medium-term (next 1-3 months) outlook: neutral
Long-term outlook (next year): bullish
The U.S. stock market indexes gained 0.1-0.4% on Wednesday, slightly extending their recent uptrend, as investors reacted to some mixed economic data announcements. The S&P 500 index has reached the new all-time high at 1,928.63, moving further away from the level of 1,900. The nearest important support level is at around 1,915, marked by recent local lows, and the next support is at the psychological 1,900. On the other hand, a potential level of resistance is at 1,950. There have been no confirmed trend reversal signals so far. However, a profit-taking correction cannot be excluded here:
Ed: Click Charts for Larger View

Expectations before the opening of today’s session are slightly positive, with index futures up 0.1-0.2% vs. their yesterday’s closing prices. The main European stock market indexes have been mixed between -0.1% and +0.4% so far. Investors will now wait for some economic data releases: Challenger Job Cuts report at 7:30 a.m., ECB Rate Decision at 7:45 a.m., Initial Claims at 8:30 a.m. The S&P 500 futures contract (CFD) trades close to yesterday’s high, along the level of 1,925. The support level remains at around 1,915, marked by recent local lows, as we can see on the 15-minute chart:

The technology Nasdaq 100 futures contract (CFD) is in a similar intraday consolidation, close to its recent high. The support level is at around 3,710-3,720. There have been no confirmed negative signals so far, as the 15-minute chart shows:

Concluding, we remain cautiously optimistic, expecting the continuation of the uptrend, and we continue to maintain our already profitable long position. The stop-loss is at 1,885 (S&P 500 index).
Thank you.

-
I know Mike is a very solid investor and respect his opinions very much. So if he says pay attention to this or that - I will.
~ Dale G.
-
I've started managing my own investments so view Michael's site as a one-stop shop from which to get information and perspectives.
~ Dave E.
-
Michael offers easy reading, honest, common sense information that anyone can use in a practical manner.
~ der_al.
-
A sane voice in a scrambled investment world.
~ Ed R.
Inside Edge Pro Contributors

Greg Weldon

Josef Schachter

Tyler Bollhorn

Ryan Irvine

Paul Beattie

Martin Straith

Patrick Ceresna

Mark Leibovit

James Thorne

Victor Adair