Asset protection

Dead Ahead: Big Black-Swan Events!

A subtle, but fundamental, shift — not yet widely discussed in financial circles — is sweeping the globe, with enormous potential consequences for the U.S. economy, for investors and for you personally:

The old global war on splintered terrorist cells
and ragtag militias is turning into a global war
against fully armed, well–organized armies.

This is happening in all three theaters of war that are currently at the top of the news — in Iraq and Syria, in the region surrounding Israel, and in Ukraine.

It’s causing a rapid, tectonic shift in strategy-making at the Pentagon, in the White House and in Congress.

It could cast a long shadow on nearly everything that Washington does to the U.S. economy — warping the federal budget … prodding still more Fed money printing … and creating all kinds of new excuses to pursue reckless, unsound policies.

And it’s likely to trigger a series of black-swan events — powerful, unpredictable changes that strike like a comet from distant space.

So, first, let me demonstrate for you the enormity of this change. Then, I’ll explain the economic and investment consequences.

Iraq and Syria: ISIS is Already a Full-Fledged Army

ISIS used to be viewed as just another al-Qaeda affiliate among the dozens of groups that have sprouted up like wildfire across Africa and Asia — all competing for recruits, few coordinating their activities.

Today, after months of prescient warnings that fell on deaf ears, that idea is finally being recognized for what it was: naïve and dangerous.

According to the New York Times, “ISIS’s success has alarmed American and regional security officials, who say it fights more like an army than most insurgent groups, holding territory and coordinating operations across large areas [with] a network of regional commanders who have their own subordinates and a degree of autonomy.”

ArabThe leadership structure, explains the Times, includes 25 deputies across Iraq and Syria, among which about one-third were military officers during the rule of Sadam Hussein, and nearly all were at one time imprisoned by American forces.

Behind this are the recent successes of an ISIS campaign to free hundreds of militants from Iraqi prisons, including intelligence officers and soldiers that had been leaders of Sadam’s elite Republican Guard. Moreover, many are graduates from Sadam’s military academies and are highly skilled strategists with years of experience fighting U.S. forces.

Now, with its control of large populated areas, ISIS is likely leveraging this experience to recruit and train tens of thousands of unemployed, disaffected youth. At the same time, for the global recruitment of jihadists, ISIS has turned mostly to foreigners, including Saudis and Westerners with advanced media and propaganda skills.Behind this are the recent successes of an ISIS campaign to free hundreds of militants from Iraqi prisons, including intelligence officers and soldiers that had been leaders of Sadam’s elite Republican Guard. Moreover, many are graduates from Sadam’s military academies and are highly skilled strategists with years of experience fighting U.S. forces.

Result: Both locally in the region and internationally across four continents, ISIS is like a jolt of electric-magnetic energy that’s transforming a messy, disjointed terrorist field into an aligned, singularly focused, global terrorist army. Now, mostly in Syria and Iraq; soon, also in Africa, Europe, North America and Asia.

But this isn’t the first time a terrorist organization has evolved into an army …

Lebanon and Syria: Before ISIS, Hezbollah
was the Largest Terrorist Army in the World

arab2According to The Tower Magazine, a reliable source on Israel and the Middle East, before ISIS burst onto the scene, it was Hezbollah that was “probably the world’s largest, most sophisticated, wealthiest and most militarily capable terror organization.” They explain how …

  • Hezbollah, a Shiite organization, was created, trained, funded and deployed as a proxy of the Iranian government, with operations spanning Europe, Africa, Asia, and the Americas.

  • It has effectively taken over the Lebanese government.
  • It has launched thousands of rockets at Israeli civilians.
  • It has killed more Americans than any other organization other than al-Qaeda.
  • And it is a fearsome weapon in the jihadist anti-Western arsenal.

The only saving grace: It’s vehemently opposed to the Sunni ISIS; and in the Syrian civil war, thousands of its fighters have been directly confronting ISIS armies on the battlefield.

Ukraine: Rebel Militias Replaced by Russian Army

Until just a few days ago, the Western-backed Ukrainian army was on the verge of defeating Russian-backed militias seeking to establish a break-away region aligned with Moscow.

arab3And even if Ukraine’s central government could not achieve victory, NATO and Russian forces always were two steps removed from a direct confrontation. Both were fighting a proxy war; neither involved in direct conflict.

Now, suddenly that has changed.

Now, the Western-backed Ukrainian troops are no longer making steady advances against inexperienced, oft-disorganized and extremely discouraged, local militias; they are retreating in panic from the vanguard of one of the largest, best-organized invading forces on the planet: the Russian army.

It seems, in fact, that Russian President Putin’s strategy is to escalate its penetration into Ukraine in three phases:

Phase 1 was his so-called “humanitarian convoy” that defied the International Red Cross and crossed the border into Ukraine without IRC inspection or escort two weeks ago.

Phase 2 is Russia’s stealth invasion, now under way, using unmarked armament and troops. Despite Mr. Putin’s repeated denials, evidence is now virtually conclusive that his army has crossed into Ukraine and reached the battlefields on two separate fronts.

And it looks like Phase 3 will begin soon after he publicly admits the presence of his troops — an admission that I believe will presage an unabashed, all-out invasion by the Russian armed forces.

How big is the Russian military? Nominally speaking, it’s estimated to have 766,000 active personnel, about one-half as many as the U.S. But it also has 2.5 million reservists, three timesas many as the U.S.

Meanwhile, Russia’s total tank strength is massive — over 15,000 units or nearly double America’s. And its self-propelled guns (SPGs) number close to 6,000, also triple the U.S. arsenal. Both these tanks and SPGs could be critical on the Ukrainian battlefield.

I’m not implying that the U.S. or NATO will confront Russia on an Eastern European battlefield. NATO commanders have effectively vowed not to do so unless Russia invades a NATO-member nation, such as those with large Russian-speaking minorities, like Estonia, Latvia and Lithuania.

Rather, my points are twofold:

First, Russia has tremendous military resources to spare. It could easily and quickly overwhelm the Western-backed Ukrainian army with just a small fraction of its forces. Moreover, given the West’s implicit vow not to respond militarily, it could do so with almost total impunity.

Second, the only way Western Europe and the U.S. can or will retaliate is via sanctions on Russia. But unlike any previous sanctions, they will not be constrained or contained. Nor will Russia’s response. For the first time, Western Europe and the U.S. will hit hard with actions that cripple Russian industry, gut their stock market, and set off a far more dangerous round of tit-for-tat East-West economic warfare.

Don’t Underestimate the Economic
and Investment Consequences!

That’s the mistake most analysts and investors have already made — repeatedly. But you can be different. You can step back from the trees of day-to-day trading and see what many experts have been largely ignoring, what has been obvious to Larry Edelson and our Money and Marketsteam for many months:

Consequence #1. The movement of flight capital to the United States is large and accelerating. The main reasons: Despite all of our internal troubles and fumbles, the United States …

* Still sits at the pinnacle of all military forces in the world, with no peer in terms of advanced weaponry, warships and air power.

* Still boasts the largest economy in the world.

* Still has the strongest alliances with the largest number of countries.

* Already has new drilling technologies to achieve the long-sought goal of energy independence.

If we slide further down our current fiscal and monetary path, could this change? Absolutely. But right now, the U.S. continues to be the single most secure and dominant economic/military power on the planet; and that helps explain why flight capital from all over the world continues to flow into the U.S.

Not just from frightened families in the Arab world, as I illustrated here last week, but also from …

* Major banks and other financial institutions still heavily invested in North Africa, the Middle East, Pakistan and other hot spots.

* Russian oligarchs, who have already moved a good portion of their big cash hoards out of Russian banks, and are now taking the rest …

* Japanese pension funds and institutions, who had invested heavily overseas in recent years, and are now shifting from what they consider “hot zones” (like the Persian Gulf and North Africa) to what they deem “safe zones” like the U.S. and Japan itself.

* Massive sovereign wealth funds that are so large, even small moves can have a big market impact. I’m talking about Norway’s Government Pension Fund (with $893 billion in assets), UAE’s Abu Dhabi Investment Authority ($773 billion), Saudi Arabia’s SAMA Foreign Holdings ($738 billion), and China’s three largest sovereign funds (over $1.5 trillion), just to name the largest.

* Plus many other sources of flight capital, some hidden or some not.

This helps explain why the U.S. stock market has been going up and could continue to do so.

It also helps explain why U.S. real estate, especially in key markets, is recovering.

Consequence #2. Escalating economic warfare with Russia; a closer alliance between Russia and China; and bigger efforts by both to draw unaligned developing nations into their fold.

Consequence #3. Big new strains on the shaky U.S. federal budget: In Eastern Europe, NATO members are already pleading for — and about to get — more NATO forces. In Washington, the Pentagon is already pushing for money to finance a stronger U.S. military presence globally. And all over the U.S., Americans, who, just weeks ago, were still demanding cutbacks in military spending, are now pleading for big increases.

Consequence #4. More Fed funny money, or worse! If the U.S. is waging all-out economic warfare with Russia and China … if the U.S. budget deficit is going haywire again … and if all this begins to look like a new black cloud hovering over the U.S. economy …

The Federal Reserve is not going to stand idly by. It will do everything in its authority — or evenoutside its authority — to offset the real or imagined impacts on the financial markets, the job market, the real estate market and more.

What exactly will the Fed do? Too soon to say. But at the very minimum, it could use these new threats to the economy as another in a long line of excuses to delay what it should have done long ago — sopping up some of the $4 trillion in stimulants that it has injected into the economy bloodstream since 2008.

And this is just the beginning! If military and economic warfare continue to escalate globally, there’s no crystal ball that can divine the ultimate consequences. That’s why this environment is so prone to black-swan events.

My recommendations:

1. Tomorrow, just before noon Eastern Time, click here to attend my special online video briefing.

2. Continue to seize the opportunity to profit from the select investments we’ve been pointing you to — in sectors like domestic energy and technology.

3. Keep core, long-term positions in cash and gold — not only to protect yourself against financial threats, but also to help cushion against the inevitable black swans.

Good luck and God bless!

Martin

Martin D. Weiss, Ph.D.

Dr. Weiss founded Weiss Research in 1971 and has dedicated the past 40 years to helping millions of average investors find truly safe havens and investments. He is president of Weiss Ratings, the nation’s leading independent rating agency accepting no fees from rated companies. And he is the chairman of the Sound Dollar Committee, originally founded by his father in 1959 to help President Dwight D. Eisenhower balance the federal budget. His last three books have all been New York Times Bestsellers and his most recent title is The Ultimate Money Guide for Bubbles, Busts, Recesssion and Depression.

The investment strategy and opinions expressed in this article are those of the author and do not necessarily reflect those of any other editor at Weiss Research or the company as a whole.

Martin Armstrong – Kiss Paper Money Goodbye & Stocks to Soar

Martin says beware of early September, it may be a buying opportunity and a temporary new high. The world is a complete mess and that means the flow of funds are headed to Wall Street. Where else can large institutions park their Trillions? It’s the only game in town (In this interview on 27th Aug 14 Martin states he does not think the stock market is in a frothy bubble and he sees the S&P running up to test 3000 – Ed Money Talks).

Get ready for electronic currencies. Your paper cash will literally become trash shortly and the world’s governments want it that way. Think of the billions more in taxes they’ll be able to extract. Perhaps Bitcoin will be banned as well, it all remains to be seen. Just get ready for what’s next. 

Martin’s also discusses his proprietary system Socrates, to which he’s devoted a large portion of his resources and his life. The system takes the emotion and opinion out of forecasting, tracing the flow of funds and confidence, thereby providing and unbiased forecast on what’s next.  

…also:


Gold at $2000?


QUESTION: Marty, do you think it is even possible for gold to close at $2,000 by year-end? This just seems to be the same story over and over again.

Thanks

SK

NYGOLD-Y-1264-2013-Support

(1864 high with 1992 low)

ANSWER: Sorry, no. Here is a chart of gold back to 1264. There is not even a pattern like that, which has EVER taken place. I am really at a loss why gold analysts keep proclaiming the same thing costing people their life savings. This is not how professionals trade. We have a huge professional client base because they have learned the hard way that OPINION is nonsense and not reliable. Is this not just a process of churning out novices and causing them countless losses to line the pockets of the pros? This is seriously impacting the lives of people and that needs to be respected.

Technically, this is the primary support channel in gold. It has not changed. These forecasts for gold are entirely out of context and ignore the entire world economic trends. You cannot even argue gold rises with war for that is not even true. Gold did not rally during World War II because it was fixed. Commodities did not rise because the government put in wage and price controls. This is not a simple if then do this formula. It takes a bit more – if then do this else do that.

GC-1982-Dollars

The major resistance in gold stands at $2300. That is the old 1980 high in today’s terms adjusted for inflation. Gold has NOT been the hedge against inflation as touted. If you bought gold in 1980 at $875 and the Dow Jones Industrials at 1,000, you have about $1300 for gold and 17,000 for stocks. That cannot be excused away. Gold is NOT a hedge against inflation, it is NOT money for you cannot pay your mortgage with it unless you sell it for dollars for the definition of “money” is the acceptance by society as a medium of exchange. It is not even legal tender for you cannot pay your taxes with it without converting to dollars. It is an investment – plain and simple.

romedecaureus-3

Gold remains the historical hedge against government. You should never reject all other investments waiting for gold to finally rally. I retired from the gold business after 1980BECAUSE the model projected a 19 year bear market. Sorry if that is impatient. But waiting 19 years is a bit too much for me personally. NOTHING always rises. There is a cycle to everything. You need to create databases to see what is even possible – not make up shit.

gold-fluctuated1

When gold has been money it DECLINES with inflation and rises with DEFLATION. It has never been a store of value for that would imply a communistic state where everything is fixed from assets and wages to ensure that money buys the same every day. These are simply stories for children for they cannot be real. The idea that money is a store of value is a pipe-dream for those who do not understand how to even invest so they want to prohibit everyone else from making money since they do not.

gold-1982-1991

Gold will rally when it rises in ALL CURRENCIES – not just dollars. To even claim gold will rise to $2,000 implies the dollar will crash. What about BIG MONEY that really drives the global economy? Where does it go? Rubles, Yuan, Euros? Come on. The worst is yet to come but that is a Sovereign Debt Crisis and I hate to tell these people it is at an advanced stage in Europe and Japan. We have not even gotten a taste of it yet in the USA – only a whiff with events like Detroit. Sorry, the dollar’s rise will still center stage and the will set in motion the economic decline from the outside moving in.

Gold’s role will be completely different. We are addressing this in the upcoming special report. This is covering gold in all major currencies so you can see the change in trend and when it is really due. This report is over 300 pages.

What Today’s Bond Prices Suggest About What Lies Ahead for Stocks

Interested in some data that may shed some light on the future direction of both stock as well as bond prices?

An analysis of the relationship between the annual rate of return between long-term treasury bonds and the return of the S&P 500 index during 1999 and 2013 shows a huge inverse relationship over the period.

Specifically, when long-term government bonds have done very well, the S&P has done very poorly, and vice versa. Consistent with this, somewhat average returns for bonds corresponded to near average returns for stocks. Such a strong degree of negative correspondence between stocks and bonds could have only happened by chance one time in a thousand, according to statistics.

Since long-term bonds are doing extremely well this year, if this relationship continues to hold true in 2014, one would expect that by year’s end, stocks may have lost much of their gains this year thus far. Of course, the reverse might happen as well. That is, if stocks continue to do well, it may be bonds that lose much of their gains.

Let’s cite a few examples of this negative relationship. In 2013, a Vanguard bond fund investing in long-term treasuries returned about -13% while the S&P returned over 32%. However, in 2011, while the same bond fund returned over +29%, the stock index returned about only 2%. This high-low, low-high, (and average-average) pattern was generally characteristic of the entire 15 year period with perhaps the only exception occurring in 2001.

Data for the entire period is shown in the following chart which shows the yearly returns for the bond fund from best to worst along with the corresponding return for the Vanguard 500 index fund:

table

How can you explain these results? And more importantly, do these results perhaps suggest something about where to invest in the future?

During this 15 year period, it appears that whenever investors felt they would get good on-going returns from stocks, they would dump their long-term bonds/bond funds/ETFs. Conversely, whenever it became clear the S&P was likely in a prolonged slump, investors seemed to take refuge in long-term government bonds. The pattern was so strong that whenever stocks were doing well, it could be taken as a highly reliable sign that treasury bonds would do poorly. Likewise, deep drops in stocks could be interpreted as suggesting there would be excellent bond returns.

Consequently, if one believed that it was going to be a bad year for long-term bonds, they could do well by increasing their allocation to stocks. Alternately, a good year thought to be upcoming for such bonds likely meant one might want to reduce their commitment to stocks.

If you plotted the return of stocks at the end of each year from very low (as during bear market years) to very high (as during bull markets) against the return for the bond fund, one would see close to a straight line relationship between low returns in one of these asset categories and high returns in the other, as shown in the accompanying graph, confirming the above correlational data.

34972

If there were no relationship between the two sets of graphed returns, each of the yearly return data points shown would appear more or less in a random fashion on the graph, not in close proximity to the sloping line depicted.

Narrowing down the time frame to just the last 5 years, the strong inverse relationship between stocks and bond returns can also readily be seen in a graph that overlays the ongoing price performance of both of the above two funds. Such a graph, which is updated daily, can be seen here.

As the graph shows, the two lines representing net asset values almost appear to be mirror images of each other; when one goes up, the other goes down.

But if you observe the graph more closely, you will see that since Jan. of this year, unlike the rest of the graph, both lines are not going in opposite directions, but are going up together. What this suggests is that the prior pattern going back to mid-2009 (and even to 1999) may be changing. We’ll return to why this may be the case shortly.

The Relationship Between Bond and Stock Prices Before 1999

It might seem, then, that the relationship between long-term treasury bond prices and stock prices would always run in opposition to each other, making it perhaps relatively easy to forecast stock returns assuming you could correctly anticipate bond returns. But unfortunately, like many other measures that seem to offer an important insight into how to forecast stock prices, or even allocate between stocks and bonds, things that are true over one extended period of time often fail to show the same relationships over other long periods.

The relationship between stock and bond prices offers just such a disparity.

As above, let’s look at a table comparing the same two funds’ total returns for the period 1987 through 1998, again ordered from best annual returns for the bond fund to the worst along with the corresponding returns for the Vanguard 500 index fund:

table2

Once again, we can see a strong correspondence between the two sets of funds’ yearly performances, only this time the relationship between the two total returns results nicely line up in a positive wayrather than a negative one. Over the 12 year period, only one or two years proved to be an exception to the rule, mainly in 1996, and perhaps in 1990. In fact, the relationship between the two sets of returns prove to be almost nearly as strong as the 1999 to 2013 results, with such a lined-up occurrence likely to occur merely by chance statistically in only 1 out of 100 cases.

Clearly, it would be helpful to have a more detailed explanation of why these funds’ performances line up at all, but even more so, why in a positive way between 1987 and 1998 but in a negative way from 1999 to 2013.

Why the Change?

I’m not sure anyone knows for sure why the relationship between long-term bond and stock prices changed so drastically over the last 15 years or so from, at a minimum, the prior 12 years. But let’s look at a possible explanation.

Normally, based on historical data, one would expect there to be a positive relationship between bond prices and stock prices. Why? Bond prices are very sensitive to the direction of interest rates and to subsequent inflation which tends to be highly related to this upward or downward direction. When rates are falling (or perceived to be about to soon), long-term bonds should do well. On the other hand, if rising (or perceived to be about to soon), bond performance should start to suffer.

Stock prices are also sensitive to interest rates and by consequence inflation. Stocks, like bonds, usually thrive in a low interest rate environment. Therefore, it would make sense that bonds’ and stocks’ performance should be positively related. This may have been what was happening between 1987 and 1998. That is, in the decade of the 1980s long-term interest rates were much higher as compared to more recently. In 1987, they rose anew but the high yields available helped to offset the following year’s returns. But as they began to fall in earnest starting in 1989 for the following 5 years, both stocks and bonds responded positively. As rates vacillated over the rest of the period, stock and bond prices tended to move as predicted by either rising or falling interest rates.

But starting around 1999, a pattern resembling what has been called “risk on/risk off” emerged. As stock prices became highly volatile and lurching toward extreme outcomes, investors would either embrace risky investments when they sensed that stocks were “the place to be,” or avoid them when their fear level was stoked by turmoil in the markets. Under such conditions, although still sensitive to interest rates and inflation which were both becoming very subdued, rather than keying mainly off interest rates and inflation, they tended to be influenced more by potential gains (as represented by stocks) vs. the desire for safety (as represented by bonds).

The two stock market plunges of the 2000s helped to fan fears, while market bouncebacks, especially over the last 5 years, were accentuated further by the Fed maintaining extremely low interest rates and easy policies which served to push investors out of treasuries and into stocks. This, of course, would have exacerbated the high stocks, low bond pattern. During 2011, however, as long-term interest rates dropped precipitously, investors couldn’t help but seek out the huge returns being generated in longer-term treasuries. Meanwhile, investors worried that deflation, not inflation, would hurt the economy and thus became much more cautious about stocks. Since then longer rates leveled out and subsequently began rising again through the end of 2013.

Another Change Starting in 2014?

But perhaps now over 10 years after the dot-com implosion and five years after the financial crisis, investors have begun to sense that things are finally getting back to normal. With some sense of stability returning, encouraged by the notion that the extremely easy credit conditions offered by the Federal Reserve will start to be withdrawn, investors can start focusing again on the fundamentals of interest rates and inflation as important gauges of both future stock and bond prices.

With inflation, and especially, interest rates remaining at rock bottom levels, investors are right now attracted to both stocks and long-term bonds and no longer are the two types of investments pitted so much against each other. So long as rates and inflation expectations remain this low, bonds and stocks may continue to thrive together.

But what happens when the inevitable does happen? The Fed will almost certainly start raising rates some time next year. The chances are increased that a rise in inflation is also in the wings which will certainly be one of the reasons the Fed will choose to act.

Under such conditions, bond prices are likely to react negatively. If stock investors perceive that interest rates, and especially inflation, are likely to move up faster than anticipated, they may use this occasion as a reason to take money out of the stock market, particularly in light of the extreme profits many have enjoyed and the fact that many authorities concur with my view that stocks are, by most reckoning, highly overvalued.

On the other hand, stocks might possibly continue to rise due to the assessment that rates and inflation remain well below average and economic growth prospects remain good. And if so, long-term bond prices although not likely short-term ones, could continue to do well until such time that interest rates and inflation expectations jump significantly higher than they are now.

However, I feel that the most likely scenario is that with the principle of risk on/risk off no longer in play, stocks and bonds will continue the “new” relationship that they have reverted to starting this year. That is, the correlation between stocks and bonds will likely remain positive. (This “new” relationship corresponds much more to the long-term history of the relationship between stock and bond prices prior to the data included in this article.)

This would mean that we have now re-entered the pre-1999 phase in the relationship between stocks and bonds. Thus, when bond prices start to move down, as they very likely will in response to rising interest rates and inflation, so will stock prices.


About Tom Madell

Mutual Fund Research Newsletter is a free newsletter which began publication in 1999. It has become one of the most popular mutual fund newsletters on the Internet, as shown on the Alexa.com “Top Sites” page for Mutual Funds News and Media Newsletter websites. Tom Madell, the Publisher, is a researcher/writer whose investing articles have appeared on hundreds of websites, including the Wall Street Journal and USA Today, and in the international media.

S&P 500 Hits 2000, Now What?

On Monday, the S&P 500 hit 2000 for the first time ever. This target was something I laid out very early this year following the Federal Reserve announcement in December that they would begin tapering the current Quantitative Easing (QE) program.  To wit:

“This is something that I discussed previously .  The chart below shows the historical correlation between increases in the Fed’s balance sheet and the S&P 500. I have also projected the theoretical conclusionof the Fed’s program by assuming a continued reduction in purchases of $10 billion at each of the future FOMC meetings.”

If the current pace of reductions continues, it is reasonable to assume that the Fed will terminate the current QE program by the October meeting. If we assume the current correlation remains intact, it projects an advance of the S&P 500 to roughly 2000 by the end of the year.  This would imply an 8% advance for the market for the entirety of 2014.”

(**Note: for those interested in Sector Analysis Lance’s current has 8 charts & 4 Tables HERE – Editor Money Talks )

Fed-Balance-Sheet-SP500-082614


Note: The chart has been updated to current balance sheet and market figures.)

Following last week’s conclusion of the Jackson Hole Economic Symposium, Janet Yellen did indeed confirm that current round of Quantitative Easing will be completed by October.  Via Bloomberg:

*YELLEN REITERATES ASSET BUYING TO BE COMPLETED IN OCTOBER

Next Stop 2100

Now that my target was achieved four months sooner than anticipated, and given that the Federal Reserve is on course to raise interest rates by mid-2015, the question is now “what next?

[For the record, no one really can forecast the future. These are just “best guesses” based on current data trends and are subject to exogenous shocks that change the underlying market dynamics.]

The chart below shows the current trend of the S&P 500 from the 2009 lows until present.

SP500-Trend-082614


The orange dashed line shows the trend of the market from the 2009 lows through the initial market correction in 2010 following the end of the first round of QE. Very quickly, Bernanke figured out that the economy was far too weak to operate without support, and he quickly launched a second round of QE in September of 2011. However, the damage was done as the market broke the previous bullish trend line turning that previous support into permanent resistance.

The market was able to establish a new trend (blue dashed line) which became successful support during to declines in 2012 as the markets struggled with the demise of QE2. If you reference the first chart above, you will notice the Federal Reserve’s balance sheet stagnating for several months along with the market.

At the end of 2012, the markets and the economy were faced the onset of the “dreaded fiscal cliff.” Part of the debt ceiling negotiation in the summer of 2011 was the creation of the “Budget Control Act” which contained a trigger for automatic budget cuts, and tax increases, that would be triggered in January of 2013.  Again, with the economy still running well below par, Bernanke acted quickly to provide enough liquidity to ensure financial and economic stability as the cuts and tax increases were enacted. The negative consequences of the “sequester”were much less than anticipated, and the deluge of $85 billion a month in liquidity ignited the markets into lift off establishing an accelerated trend higher (red dashed line.) Despite the successive push of liquidity into the markets, the S&P 500 has been unable to break above the overhead resistance of the longer term trend lines.

Based on this analysis, it is highly likely the markets will indeed drift higher within the current channel due solely to existing momentum. If this analysis is correct, it is likely that the markets could work their way towards 2100 by April of next year which would equate to an additional 5% gain from current levels.

Forecast Not Without Risks

1) There is no guarantee that the economy is strong enough to survive without the ongoing support of the Federal Reserve. After an extremely dismal Q1, the economy experienced a snap-back in Q2. The question of sustainability of that growth has yet to be answered.

2) Farmer’s Almanac, the 198-year-old publication that correctly predicted the past nasty winter while federal forecasters blew it, are predicting more of the same for the coming season. “Polar Vortex’s” are already likely farming and will be impacting roughly three-fourths of the U.S. this winter. Considering Q1 took more than a 2% plunge, WITH the Federal Reserve pumping in billions of dollars, it begs the question of how bad it could get without support this winter?

3) As I pointed out recently, the Mid-Term elections could pose a threat.

“The markets like ‘gridlock’ in government as it eliminates the risk of adverse fiscal policies. However, there is a rising probability that conservative Republicans could gain control of the Senate while maintaining majority control of Congress. The impact of such an outcome could be negative for the markets as it increases the probabilities of drastic cuts in government spending, reductions/reform of entitlement programs, and potential repeal, or ‘fix,’ of the Affordable Care Act (ACA).  While moves to a more fiscally responsible government would provide longer term benefits, such actions would likely trigger an economic recession and stock market correction.”

4) Geo-political risks are still very prevalent and potentially getting worse.

5) The contraction of both the Eurozone and Japanese economies, along with the slow-down in China, is likely to weigh on the domestic economy and corporate profitability.

However, beyond those risks is the realization that the markets are very extended as the current bull run has leapt ahead unabated by a correction. The first chart below shows the S&P 500 on a weekly basis versus its 50-week moving average and bands representing 2-standard deviations from its mean.

SP500-BollingerBands-Weekly-082614

The index is pushing the upper-limits of previous resistance levels which has typically led to at least a short-term correction. However, as seen in early 2012, as the Federal Reserve was winding down QE2, the correction was quite a bit larger than we have witnessed as of late. If we assume a similar pull-back following the end of QE3, a test of support at the 50-week moving average would be most likely at 1900 or a 5% decline.

Furthermore, as I have discussed in the past, moving averages act much like gravity for stocks prices. The longer the duration of the moving average, the greater the “gravitationalpull” on prices. The chart below shows the percentage deviation of the S&P 500 from its underlying 50-week moving average.

SP500-Deviation-50wk-MA-082614

At over 8%, the recent correction at the end of July did little to correct the extension of the markets currently. Also, we are in one of the longer periods in recent history where the markets have consistently remained at more than 5% above its 50-week moving average. As you can see, deviations that are more than 5% above the longer-term moving average are not infinitely sustainable, 10% extensions are even more dangerous.

Following the very mild correction in July, it would not be surprising to see the markets push higher into the fall. However, the risk of a more significant correction has not been alleviated by any means and investors should be cognizant of the inherent risks.

Importantly, the current “bullish trend” remains intact, and therefore portfolios should remain invested currently. The rising levels of bullishness and complacency in the markets are sure warning signs that something “wicked this way comes,” however, as I stated earlier this week, “timing is everything.” Despite the ongoing litany of articles that suggest that “buy and hold” is the only way to win the long term game, the reality is that participating in rising markets is only half the battle. What wins the long-term investing game is avoiding a bulk of the declines. 

Proving A Point

“I’ve had all I can stands, and I can’t stands no more.” – Popeye The Sailor

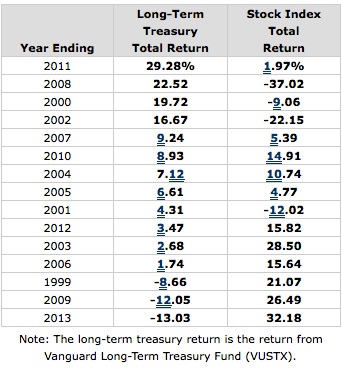
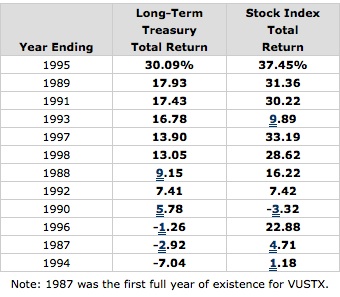
As I addressed above I have read an ongoing litany of articles about how active fund managers consistently underperform “buy and hold” index investing. However, the problem with all of these articles is that they are comparing mutual funds that have internal operating expenses with indexes. Furthermore, the vast majority of these “actively managed” mutual funds are simply closet index funds with no real sell discipline or strategy.

My premise has always been that it is entirely fine to underperform the index when prices are rising. However, it is critical not to capture the drawdowns during a market decline.

However, which theory is actually correct? I am going to put it to a live test. Now, mind you, the results of this test will not be known until after the next major correction. However, if I don’t start the test now, there will be no actual evidence to validate which theory is actually correct.

This coming week I am going to build a model portfolio that can be tracked real time with a very simple buy/sell strategy overlay. I am also going to test the theory that equal weighting a portfolio will outperform a market weighted portfolio over time as well.

In order to keep things fairly simple, reduce portfolio turnover and associated costs – I am going to use a basket of ETF’s to build a diversified portfolio. The portfolio will then be benched to the S&P 500 index, and relative performance will be tracked from there on a capital appreciation basis only.

I will post the model next week along with a discussion on the current arguments surrounding the passive/active investing debate. Going forward, I will track the results and report changes and performance along the way, along with continued discussions about the strategy, to validate which theory is actually correct.

Model Changes

Last week I stated:

“For this week, I suggest remaining “pat” and awaiting for market action to confirm the recent breakout. With the markets still on “sell signals” currently, there is a possibility that the current corrective action in the market is not over as of yet.

Investor “bullishness” and excessive complacency have quickly returned to the market which is now once again very overbought on a short term basis. Any dip in the market that does not violate short term supports, and reduces some of the short term overbought conditions, can be used to add selective exposure back to equities.”

The markets did indeed hold their ground this week and both initial “sell signals” are on the verge of turning positive. Therefore, the portfolio allocation model will revert back to full target allocations.

401k-Alloction-Change

IMPORTANT: As I stated when the initial sell signal was given, by the time that occurs the markets are usually oversold on a short-term basis, and bounces should be used to sell into. This also holds true to “buy” signals. By the time “buy” signals are issued the markets are generally overbought on a short term basis. Therefore, add exposure to equity risk selectively and on short term corrections.

Do not misunderstand me, there is a fairly high degree of risk in the markets currently and just as the recent “sell signal” was quickly reversed, it can go in the opposite direction just as quickly. As Mr. Kotok recently stated: “For today, we are back in, but we are fully prepared to change rapidly if risk premia warrant such action.”

With this, I completely agree. Pay attention, things are likely to get interesting from here.

Have a great Labor Day Weekend **note: for very professional and informative section with 8 charts & 4 Tables go to Lance’s current Sector Analysis – Editor Money Talks 


Road To Retirement – Chasing ROI (Part 2)

Wordcloud1There must be a better way

While you were out chasing rates of return a group of us were better positioning our lives to take control of our money. There is arising a greater desire to put our lives into a financial position where we can use our own money and pay ourselves back. Capital is critical but most of us lack the ability to use it wisely.

It really is three-sided

Far too much focus has been on increasing our wealth in a one-sided manner – chasing rates of return. There truly are three parts to your financial self. Accumulation surely is one but transfers are another and lastly but most importantly there is our lifestyle. All three are intricately woven into our longer lasting reality. Chasing a rate of return on the accumulation side will not win the race you run if your lifestyle erodes everything else. The rate of return on accumulation can’t significantly improve your financial picture if you are transferring dollar after dollar in the manner you make purchases whether you use someone else’s money or whether you pay cash.

Perhaps there are areas in your own life that would benefit by recapturing lost opportunities or lost wealth transfers or lost costs. Of course, to do that would require we admitted some weakness in the manner in which we handle our money. Wouldn’t recapturing bad spending increase your accumulation corner a bit? Remember the old adage, how to make 18% on your money would be to pay off then cease using credit cards?

What Am I Missing?

What are your current savings dollars earning for you? Have you any missed opportunities?

If you lose a dollar you didn’t want to lose it is not just the dollar that you will miss. You will miss what that dollar could have earned for you along the way. This is an “opportunity cost” many of us do not consider and are therefore transferring away wealth during our income-producing lifetimes. Think of all those dollars sent in monthly to pay for that car you drive to and from work every day. What if you earned a penny on every payment you have ever made?

In your current planning have you considered what impact college funding will have on your retirement dollars or other children’s education or your lifestyle money? What impact will the opportunity costs on those dollars have ultimately on your retirement years? Or have you been hypnotized into “free money match” to provide for your retirement plan while ignoring funding your children’s education? College will still occur first and you will find a source to pay for it.   A better method would be to plan for it and let retirement planning adjoin it.

What money have you spent over the years on financing automobiles? Most families experience anywhere from $300k to $500k in lost opportunity costs on the dollars they finance to drive to and from work every day in those shiny new toys.

Percent-GraphicHow about credit cards? If you do not pay them off every 25-30 days how will they offset that rate of return you were bragging about at last week’s dinner party?

Did you buy term and invest the difference? How much in premium will you pay when the term is over and insurance is gone? We refer to that as an unnecessary wealth transfer with no result. Hope your debts are completely paid when the term ends and your family has no need to replace your income.

What value is there to you if you increased the deductible on your auto insurance? Could it put more money in your pocket? What would you do with the money?

What gain could be had if you increased the deductible on your homeowner’s coverage? Are there more dollars you have not explored that could increase your wealth? Unknowingly transferring your wealth and the lost opportunity costs associated with it erode all of those returns you’ve been chasing.

Did you believe the banker when they gave you a great deal on a 15 year mortgage instead of a 30 year mortgage? There is over $9 trillion in equity in today’s homes. That is money the bank is earning on instead of you. Ever ask yourself why you want that house paid off in 15 years? What if you had the money available in 15 years but you were in control of it and it was growing without taxation? Which scenario would you choose then? Pay off or have the money to pay off?

Capitalis critical. Over the course of your lifetime in chasing rates of return your exhaustion even if quite successful will not offset the losses experienced through opportunity and interest payments.

Having money in the bank is not the answer because the banker is earning money on your money.

Having money in equity in your home is not the answer because it is the mortgage company earning money on your money.

Sending money into government sponsored savings plans is not the answer because they can sweep in with an excise tax at any time to capture what you thought were your earnings.

Increasing your wealth is an optimum motivator but focusing only on the accumulation aspect while ignoring significant transfers of wealth will greatly affect your resulting lifestyle money whether in the near future or the distant future.

For those of you saving 10-20% of your annual earnings send me an email to tell me what portion of those funds you control. Let’s somewhat define control for this conversation.


  • Control means: if the banks close their doors; you are not concerned.
  • Control means: If stock falls, your earnings do not.
  • Control means: If the market crashed you still have access – it’s your money.
  • Control means: If taxes rise you are not impacted – not now or in the future.
  • Control means: You pay no fees on the increase – no monthly fees for advice.
  • Control means: The money is not at risk.


Do yourself a favor, sit down with all of your feel-good statements and assess your total cash position. If you are a consistent saver we know you do this often. One more time will not hurt, or will it? Ask yourself these questions this time:

  1. How much of it is protected?
  2. How much of it can’t be touched by lawsuit?
  3. How much of it is insured against your death?
  4. How much of it is safe if you become disabled?
  5. How much of it is insulated from higher taxation?
  6. How much of it can you put your hands on in a pinch?
  7. How much of it can be used tax-free?
  8. How much of it will be needed to fund your life after “retirement” into old age if you live that long?

Truly, if it’s less than thirty percent you are in for a rude awakening some day. If all of your money is piled up in your taxable distributions, get ready for a wave because it’s coming. It’s a wipeout with your name on it.

Any program sponsored by the government up front, and has the IRS tagged as “it” on the backside was not designed for your benefit at all. The government has a plan and it will implement it.

Do you?

You see, most of what even one generation ago could rely upon is no longer true. What you think to be true likely has changed while you slept. How long will you pretend to be asleep continuing the status quo? It’s your life. It’s your savings. The sad news is that most of us have the lion’s share of it stacked inside a program the government owns. And they will rejoice and be glad when you retire!

Conservative * Disciplined * Different– sometimes means the message is stranger than you are accustomed to, but the history of those implementing a different system speaks for itself…successfully.

Lynette Lalanne
Please share your story at lynette@streettalkinsurance.com

Have A Happy And Safe Labor Day Weekend.

lance sig

Lance Roberts

Lance Roberts is the General Partner and Chief Portfolio Strategist for STA Wealth Management. He is also the host of “The Lance Roberts Show,” Chief editor of the X-Factor Investment Newsletter and the Streettalklive daily blog. Follow Lance on FacebookTwitter and Linked-In


#1 Most Viewed Article: Richard Russell – Current Financial System To Tear Itself Apart

shapeimage 22At 90 years old and still going strong, the Godfather of newsletter writers, Richard Russell, warned that the current financial system is going to tear itself apart.  The 60-year market veteran also discussed gold and the U.S. dollar, and warned about a possible stock market crash.

 Russell: “The Aden sisters (they flew up from Costa Rica to attend my 90th birthday party), have studied gold for decades — they are indeed gold experts. In their recent report, the Adens note that gold runs in cycles. Gold tends to form key bottoms every 7-8 years, and it forms key tops every 11 years. The Adens believe that gold is now in the process of forming an important bottom, prior to the beginning of a new bull market to start next year…….continue reading HERE

test-php-789