
Timing & trends
Briefly: In our opinion, speculative short positions are favored (with stop-loss at 2,030 and a profit target at 1,900, S&P 500 index)
Our intraday outlook is bearish, and our short-term outlook is bearish:
Intraday (next 24 hours) outlook: bearish
Short-term (next 1-2 weeks) outlook: bearish
Medium-term (next 1-3 months) outlook: neutral
Long-term outlook (next year): bullish
The U.S. stock market indexes gained 0.3-0.8% on Wednesday, extending their recent fluctuations, as investors continued to hesitate following last week’s economic data announcements, among others. The S&P 500 index remains relatively close to its all-time high of 2,011.17. The nearest important level of resistance is at around 2,000-2,010, and the support level is at 1,980-1,985, marked by recent local lows. There have been no confirmed negative signals so far. However, we still can see negative technical divergences, accompanied by overbought conditions:

Expectations before the opening of today’s session are negative, with index futures currently down 0.2-0.3%. The main European stock market indexes have lost 0.2-0.4% so far. Investors will now wait for the Initial Claims data release at 8:30 a.m. The S&P 500 futures contract (CFD) continues to fluctuate along the level of 2,000. The resistance level is at around 2,000-2,010, and the nearest important level of support is at 1,980-1,985, marked by local lows, as we can see on the 15-minute chart:

The technology Nasdaq 100 futures contract (CFD) remains in a short-term consolidation, as it moves along the level of 4,000. The nearest important level of resistance is at around 4,100-4,115, and the support level is at 4,050-4,060, marked by local lows, as the 15-minute chart shows:

Concluding, the broad stock market retraced some of its month-long advance as the S&P 500 index broke below the level of 2,000. We remain bearish, expecting a downward correction or uptrend reversal. Therefore, we continue to maintain our already profitable speculative short position with entry point at 2,000.5 (S&P 500 index). The stop-loss is at the level of 2,030 and potential profit target is at 1,900 (S&P 500 index). It is always important to set some exit price level in case some events cause the price to move in the unlikely direction. Having safety measures in place helps limit potential losses while letting the gains grow.
Thank you.

Warning… Condescension ensues…
“There are worse things that could happen than filling a gap and scattering the wrong kind of gold bugs back out. Then it would be up to the longer-term charts to do the heavy lifting if the daily does fulfill this downside potential.”
The gap was filled, the top end of the anticipated support zone was reached and indeed, the wrong [i.e. momentum players] kind of gold bugs are scattering back out. The hard sell down on Thursday was very likely due in large part to the selling by traders with a fetish about gold as a geopolitical or terror hedge.
We should continue to tune out these people and while we are at it, tune out the ‘Indian wedding season’ and ‘China demand’ pumpers in favor of real fundamentals like gold’s relationship to commodities and the stock market, the Banking sector’s relationship to the broad market, Junk Bond to Quality credit spreads and US Treasury bond yield relationships.
It’s boring stuff compared to all that demand in China, Modi’s pro-gold regime in India and of course how we are all going to go down the drain amidst war, terror and an age of global conflict unless we have a ‘crisis hedge’. The only terror gold investors should care about is that perpetrated upon paper/digital currencies by global policy makers.
So last week was good in that it blew out those who were hanging on through the 2 month long grind that did indeed turn out to be short-term topping patterns. I don’t mind telling you that my patience was tested by the bullish spirits, especially on up days with Ukraine in the headlines. I did not think it would take 2 months to resolve, but every time the sector looked like it would crack, a new geopolitical flashpoint would show up in the mainstream financial media.
That condition is now being closed out. Taking its place could be a bottom of at least short-term significance (i.e. to a bounce). We have a fundamental backdrop that is not fully formed and a big picture technical backdrop that has degraded in gold and silver and is not proven in the equities. So whether we bounce only, go bullish for an extended rally or even bull market, or (and it’s still on the table folks) fail into the ‘final plunge’ scenario, we are dealing in potentials, not confirmed trends.
Moving on let’s check sector sentiment.
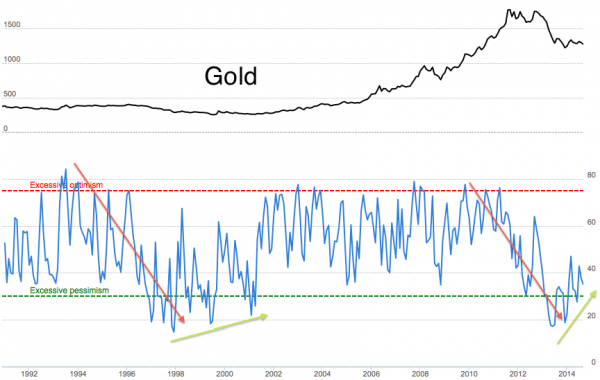
The current hook down in gold’s Optix (Sentimentrader.com’s aggregated Public Opinion data) is correcting recent surges in optimism. This is coming amidst a small positive trend. ‘Uh oh, dumb money is getting positive!’ think contrarians anxiously. But the historical view shows that the Optix rises in the initial stages of a bull market.
So I am not calling a new bull market here, but I am calling a condition to one, which is a positive trend (subject to ongoing corrections like the current one) out of deeply depressed levels by the Gold Optix.
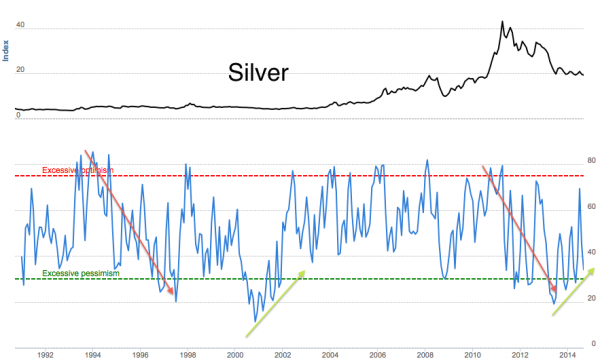
Silver is even better, as it became way over loved, conveniently right at the time we noted severely over bought technicals in nominal silver and in its relationship to gold. If we were to go strictly by this graph (which we of course will not) it looks like silver is ready to bottom and turn up.
A view of how unhealthy silver’s sentiment backdrop became recently comes from the most recent spike in the Optix to near the red line, while the price of silver barely went anywhere. Again, we cannot make foolproof claims about what lay ahead but what we can claim is that a bearish condition is gone, replaced by a more bullish one.
The bottom line is that while gold’s technical situation was compromised last week and silver is testing major support one more time (4th) than I personally find agreeable, the sentiment backdrop has become more favorable. Not shown above are the Commitments of Traders data, which improved again last week, but have room to improve further.
This segment will probably be released as a public article to maybe try and convert one or two more people away from the stuff talking about weddings and war and corresponding sentiment traps that people in this sector all too often fall into from a bullish perspective.
Gold is getting drubbed in ratio to the US stock market and in the face of a strong US economy. Those are facts and also fundamental considerations. In seeking a macro pivot phase, we are looking ahead to a potential time of change, but easy connect-the-dots analysis is not going to bring such a phase on, no matter how often the wrong kind of gold bugs click the heels of their ruby slippers.
We’ll clip it here and move on to the nuts and bolts technical and fundamental analysis.
[end excerpt, new material follows]
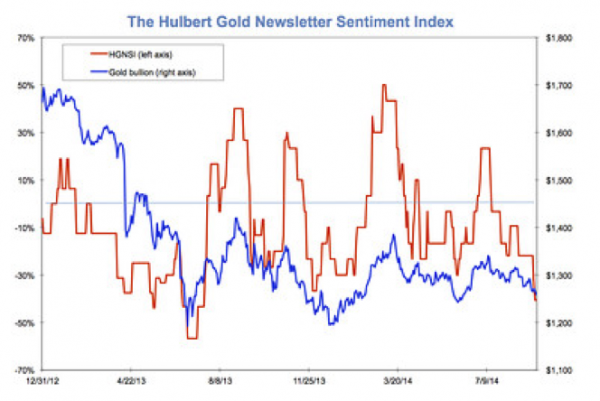
Mark Hulbert: Gold may be a buy as investors turn ever more bearish
Okay, Hulbert’s HGNSI is on board the contrary theme as well. That only reinforces matters. Gold trend followers are now hyper bearish, which is good because this is one sector you buy when it is reviled, not cheered for.
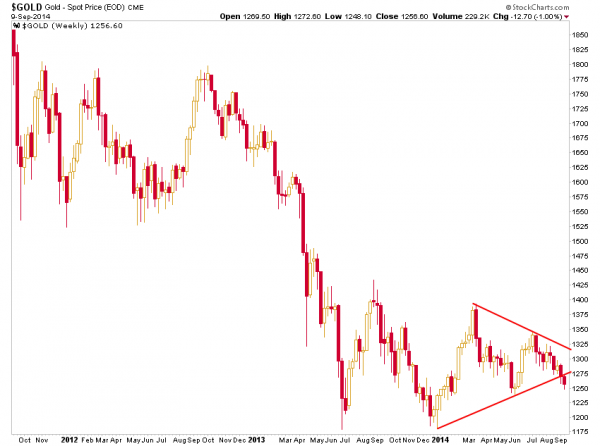
But let’s also keep in mind the reason why said trend followers lurched bearish; a very real technical breakdown per this overly simplified chart of a Symmetrical Triangle breakdown. That’s what’s got everyone freaked out. Support at 1250 must hold and gold needs to reverse back above 1275 and then we could have a view of a bear trap getting sprung amidst over done negative sentiment.
NFTRH 307’s opening segment, dated 9.7.14: From a post on the HUI at the site last week
Subscribe to NFTRH Premium for your 25-35 page weekly report, interim updates (including Key ETF charts) and NFTRH+ chart/trade ideas or the free eLetter for an introduction to our work.
 Friday’s release of disappointing August payroll numbers should have been a jarring wake-up call warning Wall Street that the economy has been treading on thin ice. Instead the alarm clock was stuffed under the pillow and Wall Street kept sleeping. The miss was so epic in fact (the 142,000 jobs created was almost 40% below the consensus estimate) that the top analysts on Wall Street did their best to tell us that it was all just a bad dream. Mark Zandi of Moody’s reacted on Squawk Box by saying “I don’t believe this data.” The reliably optimistic Diane Swonk of Mesirow Financial told Reuters the report “sure looks like a fluke, not a trend”.
But the opinions of those that really matter, the central bankers in charge of the global economy, are likely taking the report much more seriously. Given that this is just the latest in a series of moribund data releases, such as news today that U.S. mortgage applications have fallen to the lowest levels in 14 years, caution is justified. Unfortunately very little good comes from central bank activism. Recent statements from Fed officials across the United States and recent actions from ECB president Mario Draghi reveal their growing resolve to fight too low inflation, which they believe is the biggest threat to recovery. There are many things that are contributing to the global woes. But low prices are not high on the list.
Since the markets crashed in 2008, central banks around the world have worked feverishly to push up the prices of financial assets and to keep consumer prices rising steadily. They have done so in the official belief that these outcomes are vital ingredients in the recipe for economic growth. The theory is that steady inflation creates demand by inspiring consumers to spend in advance of predictable price increases. (The flip side is that falling prices “deflation,” strangles demand by inspiring consumers to defer spending). The benefits of inflation are supposed to be compounded by rising stock and real estate prices, creating a wealth effect for the owners of those assets which subsequently trickles down to the rest of the economy. In other words, seed the economy with money and inflation and watch it grow.
Thus far the banks have been successful in creating the bubbles and keeping inflation positive, but growth has been a no show. The theory says the growth is right around the corner, but like Godot it stubbornly fails to show up. This has been a tough circle for many economists to square.
Two explanations have emerged to explain the failure. Either the model is not functioning (and higher inflation and asset bubbles don’t lead to growth) or the stimulus efforts thus far, in the form of zero percent interest rates and quantitative easing, have been too timid. So either the bankers must devise a new plan, or double down on the existing plan. You should know where this is going. The banks are about to go “all in” on inflation.
Despite their much ballyhooed “independence”, central bankers have proven that they operate hand in glove with government. They are also subject to all the same political pressures and bureaucratic paralysis. There is an unwritten law in government that when a program doesn’t produce a desired outcome, the conclusion is almost never that the program was flawed, but that it was insufficient. Hence governments continually throw good money after bad. The free market discipline of cutting losses simply does not exist in government.
This is where we are with stimulus. Six years of zero percent interest rates and trillions and trillions of new public debt have failed to restore economic health, but our conclusion is that we just haven’t given it enough time or effort. My theory is a bit different. Maybe zero percent interest rates and asset bubbles hinder rather than help a real recovery. Maybe they resurrect the zombie of a failed model and prevent something viable and lasting from gaining traction? This is a possibility that no one in power is prepared to consider.
But what if they succeed in getting the inflation, but we never get the growth? What if we are headed toward stagflation, a condition that in the late 1970s gripped the U.S. more tightly than Boogie Fever? It may come as a surprise to the new generation of economists, but high inflation and high unemployment can coexist. In fact, the two were combined in the 70s and 80s to produce “the Misery Index.” But according to today’s economic thinking, the Index should not be possible. Inflation is supposed to cause growth. If unemployment is high they say there is no demand to push up prices. But it’s the monetary expansion that pushes prices up, not the healthy job market.
The tragedy is that if the policy fails to produce real growth, as I am convinced it will, the price will be paid by those elements of society least able to bear it, the poor and the old. Inflation and stagnation mean lost purchasing power. The rich can mitigate the pain with a rising stock portfolio and more modest vacation destinations. But they won’t miss a meal. Those subsisting on meager income will be hit the hardest.
Many economists are now trying to make the case that the United States had hit on the right stimulus formula over the past few years and is now reaping the benefit of our bold monetary experimentation. They continue the argument by saying Europe and Japan were too timid to implement adequate stimulus and are now desperately playing catch up. But this theory is false on a variety of fronts. First off, the U.S. is not recovering but decelerating. Annualized GDP in the first half of 2014 has come in at just a shade over one percent, which is lower than all of 2013, which itself was lower than 2012. The unemployment rate is down, but labor participation is at a 36-year low, and wages are stagnant. We have added more than $5 trillion in new public debt, but very little to show for it. We are not the model that other countries should be following but a cautionary tale that should be avoided.
It is also spectacularly wrong to assume that the problems in Europe and Japan can be solved by a little more inflation. Higher prices will just be a heavier burden for European and Japanese consumers, not an elixir that revitalizes their economies. The problems in Europe, Japan and the U.S. all have to do with an oppressive environment for savings, investment, and productivity that is created by artificially low interest rates, intractable budget deficits, restrictive business regulation, antagonistic labor laws, and high taxes. Since none of the governments of these countries have the political will to tackle these problems head on, they simply hope that more monetary magic will do the trick.
So as the Fed, the ECB, the Bank of Japan, and all the other banks that follow suit, push all their chips into the pot and hope that a little more inflation will save us from the abyss, we can wish them luck. It’s going to take a miracle.
Best Selling author Peter Schiff is the CEO and Chief Global Strategist of Euro Pacific Capital. His podcasts are available on The Peter Schiff Channel onYoutube
Catch Peter’s latest thoughts on the U.S. and International markets in the Euro Pacific Capital Summer 2014 Global Investor Newsletter!


Countless Moving Parts
One factor that makes investing such a difficult task is the almost infinite number of inputs impacting the value of any asset. For example, emerging market stocks could be negatively impacted by economic divergences between the United States and Europe. How can that be?
- Strength in the U.S economy may cause the Federal Reserve to raise interest rates in 2015.
- Higher rates in the U.S. make the U.S. dollar more attractive relative to the euro.
- Emerging market stocks tend to be negatively correlated to the U.S. dollar, meaning when the dollar strengthens, emerging markets tend to experience a currency headwind.

Fed May Raise Rates In 2015
Although economic data has been mixed recently, the trend has been improving over the last year. From Reuters:
Better U.S. economic data has boosted the view the Fed may be closer to raising rates, and the dollar’s gains have come at the same time as rising Treasury yields. Still continuing slack in the labor market is also viewed as keeping the Fed on hold for several more quarters. “People are more confident that the Fed is reaching its objectives,” Chandler said. He added, however, that “while the economy is healing, it’s not healthy.”
ECB vs. Fed
While the Fed is expected to rein in monetary policy in the coming months, the European Central Bank (ECB) has indicated a bias towards increasing their stimulative efforts. The diverging paths between the central banks are having an impact on the currency markets. From Reuters:
The dollar hit a 14-month peak against the euro on Tuesday, on optimism the U.S. economy is growing in line with expectations that the Federal Reserve may begin raising interest rates next year.
Investment Implications – The Weight Of The Evidence
On Tuesday, the S&P 500 closed inside the support band shown in the chart below (1984 to 1991). Therefore, it is too early to get overly concerned about recent weakness in equities. The blue trendline in the chart below has acted as support on numerous occasions (see green arrows). The S&P 500 bounced near the blue trendline Tuesday (see orange arrow), meaning buyers stepped in at a logical level.
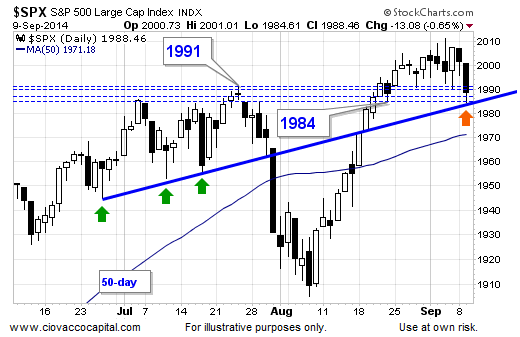
As noted via the tweet below, the chart above can be used in conjunction with other levels of possible support for the S&P 500.

Our concerns would increase with each level taken out. If support holds, we will err on the side of doing nothing in the short run. If support breaks, we will review the evidence and make any necessary adjustments to our allocations. For now, we continue to hold U.S. stocks (SPY), leading sectors (XLV), and a stake in U.S. Treasuries (TLT). We will enter Wednesday’s session with a flexible and open mind.
About Chris Ciovacco
Chris Ciovacco is the Chief Investment Officer for Ciovacco Capital Management, LLC. More on the web at www.ciovaccocapital.com.
All material presented herein is believed to be reliable but we cannot attest to its accuracy. Investment recommendations may change and readers are urged to check with their investment counselors and tax advisors before making any investment decisions. Opinions expressed in these reports may change without prior notice. This memorandum is based on information available to the public. No representation is made that it is accurate or complete. This memorandum is not an offer to buy or sell or a solicitation of an offer to buy or sell the securities mentioned. The investments discussed or recommended in this report may be unsuitable for investors depending on their specific investment objectives and financial position. Past performance is not necessarily a guide to future performance. The price or value of the investments to which this report relates, either directly or indirectly, may fall or rise against the interest of investors. All prices and yields contained in this report are subject to change without notice. This information is based on hypothetical assumptions and is intended for illustrative purposes only. THERE ARE NO WARRANTIES, EXPRESSED OR IMPLIED, AS TO ACCURACY, COMPLETENESS, OR RESULTS OBTAINED FROM ANY INFORMATION CONTAINED IN THIS ARTICLE.
Ciovacco Capital Management, LLC is an independent money management firm based in Atlanta, Georgia. CCM helps individual investors and businesses, large & small; achieve improved investment results via research and globally diversified investment portfolios. Since we are a fee-based firm, our only objective is to help you protect and grow your assets. Our long-term, theme-oriented, buy-and-hold approach allows for portfolio rebalancing from time to time to adjust to new opportunities or changing market conditions.
Copyright © 2006-2014 Chris Ciovacco

Several markets seem over-extended and about to reverse their current trends.
S&P 500 Index: It bottomed in March 2009 about 670 and is currently about 2,000. The S&P, thanks to QE, ZIRP, Central Bank purchases, and who knows what other contrivances, has levitated to the magical 2,000 level. Will it go higher?
Dollar Index: The dollar index, currently about 83, is well below its high in 2002 at about 120. However it is also well above its 2008 low around 72. Will capital flows into the US and the fear trade continue to levitate the dollar?
Gold: Gold prices peaked in August 2011 about $1,920 and today gold sells for about $1,260. However, prices have retreated to 2010 levels but are still far above the lows in 2001 at about $255. Is gold ready to rally?
What about cycles?
- I have little faith in short term cycles which can be easily overwhelmed by other forces.
- I prefer longer cycles as I believe they are more reliable.
- I think any cyclic analysis should be confirmed with additional technical and fundamental analysis.
S&P 500 Index: Consider the following graph of monthly prices for 30 years. The blue vertical lines are drawn every 81 months – about 7 years. Note the highs in 1987, 1994, 2000, 2007, and 2014, and note the current “over-bought” condition of the S&P as indicated by the MACD and TDI indicators. This graph does not conclusively inform us that the S&P is ready to correct, but it does indicate that the S&P could be forming a 7 year cyclic top with a low due perhaps in 2016 – 2019.

Dollar Index: Consider the following graph of monthly prices over nearly 30 years and the vertical blue lines every 75 months. Note the alternating high – low pattern with a high in 1989, low in 1995, high in 2002, low in 2008, and possible high in 2014. The dollar index might move higher and take longer but it could be topping now. The monthly TDI is modestly over-bought and the weekly (not shown) is strongly over-bought. The dollar index could be peaking.

Gold: The gold chart shows 20 years of prices with blue vertical lines every 56 months. Note the lows in 1999, 2004, 2008, and 2013. Gold appears to have made a long term low in 2013 – 2014 and has built a base from which another rally should appear. The MACD and TDI indicators are oversold and indicate strong rally potential. Further, my long-term empirical gold model indicates that current gold prices are too low by about 20%, which will provide a “tail-wind” for gold prices over the next several years, independent of massive QE, more wars, dollar weakness, and economic slumps that create even more unpayable debt.

Given the troublesome economic conditions in the world and potential expansion of war in the Ukraine, Iraq, Syria, North Africa, and elsewhere, there is considerable risk that the S&P could fall substantially and a strong probability that gold will rally. Furthermore, there is a growing global movement away from the use of the dollar in global trade, led by China and Russia, and that bodes poorly for long-term dollar strength, particularly as cycles indicate a potential top due in 2014. A fall in the dollar would likely be accompanied by a rise in gold prices.
Markets can move farther and take longer than most people expect, but it is certainly time to consider that the S&P is quite high and ready to reverse its five plus year uptrend, and that gold is too low and set to reverse its three year downtrend.
Gary Christenson
The Deviant Investor

-
I know Mike is a very solid investor and respect his opinions very much. So if he says pay attention to this or that - I will.
~ Dale G.
-
I've started managing my own investments so view Michael's site as a one-stop shop from which to get information and perspectives.
~ Dave E.
-
Michael offers easy reading, honest, common sense information that anyone can use in a practical manner.
~ der_al.
-
A sane voice in a scrambled investment world.
~ Ed R.
Inside Edge Pro Contributors

Greg Weldon

Josef Schachter

Tyler Bollhorn

Ryan Irvine

Paul Beattie

Martin Straith

Patrick Ceresna

Mark Leibovit

James Thorne

Victor Adair