
Asset protection

Today John Mauldin spoke with King World News about the great danger he believes may trigger a worldwide crash. Mauldin, President of Millennium Wave Securities, also warned that the problems in Europe are so enormous that it may ultimately shock the Europeans by causing the destruction of their currency.
….continue reading HERE
Ed Note: John Mauldin has a much longer article in his “Thoughts From The Frontline” posted below:
Thoughts from the Frontline – What’s on Your Radar Screen?
What’s on Your Radar Screen?
Emerging Markets Are Set Up for a Crisis
Who’s Competing with Whom?
O Canada, Where Are You Headed?
Thinking about Momentum
The Rational Bear
San Antonio, Washington DC, and Dallas
Toward the end of every week I begin to ponder what I should write about in the nextThoughts from the Frontline. Much of my week is spent in front of my iPad or computer, consuming as much generally random information as time and the ebb and flow of life will allow. I cannot remember a time in my life after I realized you could read and learn new things that that particular addiction has not been my constant companion.
As I sit down to write each week, I generally turn to the events and themes that most impressed me that week. Reading from a wide variety of sources, I sometimes see patterns that I feel are worthy to call to your attention. I’ve come to see my role in your life as a filter, a connoisseur of ideas and information. I don’t sit down to write with the thought that I need to be particularly brilliant or insightful (which is almighty difficult even for brilliant and insightful people) but that I need to find brilliant and insightful, and hopefully useful, ideas among the hundreds of sources that surface each week. And if I can bring to your attention a pattern, an idea, or thought stream that that helps your investment process, then I’ve done my job.
Sometimes I feel like an air traffic controller at “rush hour” at a major international airport. My radar screen is just so full of blinking lights that it is hard to choose what to focus on. We each have our own personal radar screen, focused on things that could make a difference in our lives. The concerns of a real estate investor in California are different from those of a hedge fund trader in London. If you’re an entrepreneur, you’re focused on things that can grow your business; if you are a doctor, you need to keep up with the latest research that will heal your patients; and if you’re a money manager, you need to keep a step ahead of current trends. And while I have a personal radar screen off to the side, my primary, business screen is much larger than most people’s, which is both an advantage and a challenge with its own particular set of problems. (In a physical sense this is also true: I have two 26-inch screens in my of fice. Which typically stay packed with things I’m paying attention to.)
So let’s look at what’s on my radar screen today.
First up (but probably not the most important in the long term), I would have to say, is Scotland. What has not been widely discussed is that the voting age was changed in Scotland just a few years ago. For this election, anyone in Scotland over 16 years old is eligible. Think about that for a second. Have you ever asked 16-year-olds whether they would like to be more free and independent and gotten a “no” answer? They don’t think with their economic brains, or at least most of them don’t. If we can believe the polls, this is going to be a very close election. The winning margin may be determined by whether the “yes” vote can bring out the young generation (especially young males, who are running 90% yes) in greater numbers than the “no” vote can bring out the older folks. Right now it looks as though it will be all about voter turnout.
(I took some time to look through Scottish TV shows on the issue. Talk about your polarizing dilemma. This is clearly on the front burner for almost everyone in Scotland. That’s actually good, as it gets people involved in the political process.)
The “no” coalition is trying to talk logic about what is essentially an emotional issue for many in Scotland. If we’re talking pure economics, from my outside perch I think the choice to keep the union (as in the United Kingdom) intact is a clear, logical choice. But the “no” coalition is making it sound like Scotland could not make it on its own, that it desperately needs England. Not exactly the best way to appeal to national instincts and pride. There are numerous smaller countries that do quite well on their own. Small is not necessarily bad if you are efficient and well run.
However, Scotland would have to raise taxes in order to keep government services at the same level – or else cut government services, not something many people would want.
There is of course the strategy of reducing the corporate tax to match Ireland’s and then competing with Ireland for businesses that want English-speaking, educated workers at lower cost. If that were the only dynamic, Scotland could do quite well.
But that would mean the European Union would have to allow Scotland to join. How does that work when every member country has to approve? The approval process would probably be contingent upon Scotland’s not lowering its corporate tax rates all that much, especially to Irish levels, so that it couldn’t outcompete the rest of Europe. Maybe a compromise on that issue could be reached, or maybe not. But if Scotland were to join the European Union, it would be subject to European Union laws and Brussels regulators. Not an awfully pleasant prospect.
While I think that Scotland would initially have a difficult time making the transition, the Scots could figure it out. The problem is that Scottish independence also changes the dynamic in England, making it much more likely that England would vote to leave the European Union. Then, how would the banks in Scotland be regulated, and who would back them? Markets don’t like uncertainty.
And even if the “no” vote wins, the precedent for allowing a group of citizens in a country within the European Union to vote on whether they want to remain part of their particular country or leave has been set. The Czech Republic and Slovakia have turned out quite well, all things considered. But the independence pressures building in Italy and Spain are something altogether different.
I read where Nomura Securities has told its clients to get out of British pound-based investments until this is over. “Figures from the investment bank Société Générale showing an apparent flight of investors from the UK came as Japan’s biggest bank, Nomura, urged its clients to cut their financial exposure to the UK and warned of a possible collapse in the pound. It described such an outcome as a ‘cataclysmic shock’.” (Source: The London Independent) The good news is that it will be over next Thursday night. One uncertainty will be eliminated, though a “yes” vote would bring a whole new set of uncertainties, as the negotiations are likely to be quite contentious.
One significant snag is, how can Scottish members of the United Kingdom Parliament continue to vote in Parliament if they are leaving the union?
I admit to feeling conflicted about the whole thing, as in general I feel that people ought have a right of self-determination. In this particular case, I’m not quite certain of the logic for independence, though I can understand the emotion. But giving 16-year-olds the right to vote on this issue? Was that really the best way to go about things? Not my call, of course.
Emerging Markets Are Set Up for a Crisis
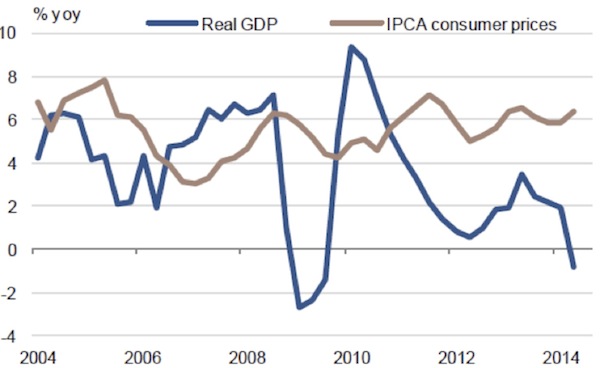
We could do a whole letter just on emerging markets. The strengthening dollar is creating a problem for many emerging markets, which have enough problems on their own. My radar screen is full of flashing red lights from various emerging markets. Brazil is getting ready to go through an election; their economy is in recession; and inflation is over 6%. There was a time when we would call that stagflation. Plus they lost the World Cup on their home turf to an efficient, well-oiled machine from Germany. The real (the Brazilian currency) is at risk. Will their central bank raise rates in spite of economic weakness if the US dollar rally continues? Obviously, the bank won’t take that action before the election, but if it does so later in the year, it could put a damper on not just Brazil but all of South America. Take a look at this chart of Brazilian consumer price inflation vs. GDP:
Turkey is beginning to soften, with the lira down 6% over the last few months. The South African rand is down 6% since May and down 25% since this time last year. I noted some of the problems with South Africa when I was there early this year. The situation has not improved. They have finally reached an agreement with the unions in the platinum mining industry, which cost workers something like $1 billion in unpaid wages, while the industry lost $2 billion. To add insult to injury, it now appears that a Chinese slowdown may put further pressure on commodity-exporting South Africa. And their trade deficit is just getting worse.
We could also do a whole letter or two on global trade. The Boston Consulting Group has done a comprehensive study on the top 25 export economies. I admit to being a little surprised at a few of the data points. Let’s look at the chart and then a few comments.
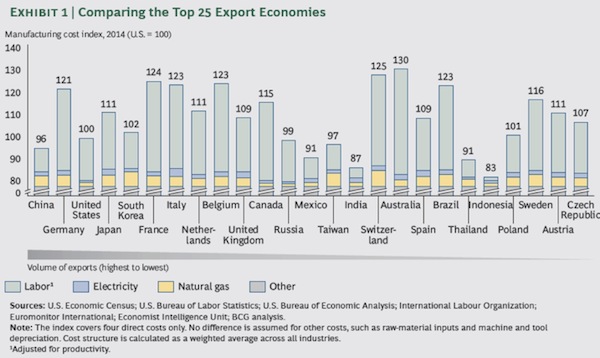
First, notice that Mexico is now cheaper than China. That might explain why Mexico is booming, despite the negative impact of the drug wars going on down there. Further, there is now not that much difference in manufacturing costs between China and the US .
Why not bring that manufacturing home – which is what we are seeing? And especially anything plastic-related, because the shale-gas revolution is giving us an abundance of natural gas liquids such as ethane, propane, and butane, which are changing the cost factors for plastic manufacturers. There is a tidal wave of capital investment in new facilities close to natural gas fields or pipelines. This is also changing the dynamic in Asia, as Asian companies switch to cheaper natural gas for their feedstocks.
(What, you don’t get newsfeeds from the plastic industry? Realizing that I actually do makes me consider whether I need a 12-step program. “Hello, my name is John, and I’m an information addict.”)
Note that Japan is about 10% cheaper than Germany, and those costs are going to drop more as the yen continues to fall. This will affect whether the European Central Bank will finally turn on the monetary spigot to try to produce a little inflation (as opposed to none). In any case, Germany would like to see the euro weakened. Note that Spain, with its aggressive labor reforms, has brought its cost of manufacturing down below that of Germany, to just about the lowest level in Europe. France is the high-cost producer in Europe with the exception of Switzerland, but they don’t do much head-to-head competing. Note, too, that China is no longer the low-cost Asian manufacturer. That’s Indonesia, by far.
O Canada, Where Are You Headed?
My friend Jared Dillian, ex-Wall Street trader and now the editor of a great newsletter humorously titled The Daily DirtNap, has been writing about the problems of Canada for the last several months. Some of it is anecdotal, as in four of the top five major bank CEOs have resigned in the last year, at relatively young ages. Just prior to the Canadian banks getting downgraded by S&P last month. Go figure.
Writes young Jared:
My thoughts: McCaughey is the – not kidding – fourth Canadian bank CEO to retire in the last year. RBC, TD, BNS, and now CIBC. And these guys are not that old. Late fifties, maybe. So it is clear what is going on here – they are cashing out on the highs. It is perfectly rational behavior. Come on – if you were a bank CEO, and you thought that your industry had years of upside left, would you get out? If you were 57? You would not.
The Canadian economy is almost entirely dependent upon its housing market for economic growth. Now, some of my Canadian readers will probably not want to acknowledge that Canadians have an obsession with housing. Debt-to-income levels in Canada are beginning to look a little toppish: $2 million is the new $1 million house. (And in Vancouver it is the half-million-dollar house.) But it has been that way for years. I haven’t written much about Canada lately, because I quite frankly don’t get it. But the country is on my radar screen. Because, I will admit, I really like Canada. At least in the summer.
Every week I get at least one email from my friend Alexander Ineichen in Zürich. He does this fabulous analysis of scores of momentum indicators all over the world. It’s a good way to get a quick read (well, not that quick, at 90 pages) on what is happening in the real world. Let me give you an example of one of his recent charts:
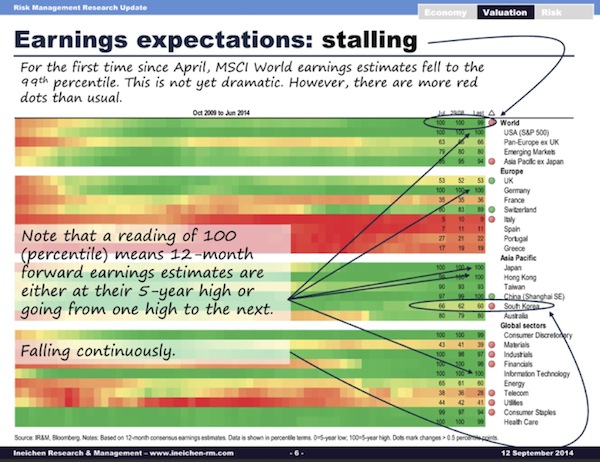
What I see when I glance through his PowerPoint is that leading indicators are beginning to stall, Eurozone economic sentiment is collapsing, and momentum is not in Germany’s favor. In general, Europe sucks (that is a technical economic term for newbies).
Recently, I’ve become aware of a fabulous young macroeconomic writer from Dubai by the name of Jawad Mian. Remember that name. I read a lot of macro letters, and his is one of the best. Rather than spend the pages that he deserves on his analysis, I just want to acknowledge that he brought to my attention a quote that I’d forgotten from my friend George Friedman of Stratfor. Friedman was responding to a comment by Louis Bacon, who had just returned $2 billion to his investors, complaining, “It is hard to figure out how to invest when actions taken by politicians can affect financial markets more than basic economic factors. The political involvement is so extreme – we have not seen this since the postwar era. What they are doing is trying to thwart natural market outcomes. It is amazing how important the decision-making of one person, Angela Merkel, has become to world markets.”
Friedman objected on the grounds that political decisions are in fact subject to analysis and constraints. He pointed out that Merkel was not acting on whims but on the basis of very real circumstances. Jawad quoted at length from George, but let me pull a few poignant paragraphs that we can all relate to:
The investors’ problem is that they mistake the period between 1991 and 2008 as the norm and keep waiting for it to return. I saw it as a freakish period that could survive only until the next major financial crisis – and there always is one. While the unusual period was under way, political and trade issues subsided under the balm of prosperity. During that time, the internal cycles and shifts of the European financial system operated with minimal external turbulence, and for those schooled in profiting from these financial eddies, it was a good time to trade.
Once the 2008 crisis hit external factors that were always there but quiescent became more overt. The internal workings of the financial system became dependent on external forces. We were in the world of political economy, and the political became like a tidal wave, making the trading cycles and opportunities that traders depended on since 1991 irrelevant. And so, having lost money in 2008, they could never find their footing again. They now lived in a world where Merkel was more important than a sharp trader. Actually, Merkel was not more important than the trader. They were both trapped within constraints about which they could do nothing. But if those constraints were understood, Merkel’s behavior could be predicted.
The real problem for the hedge funds was not that they didn’t understand what they were doing, but the manner in which they had traded in the past simply no longer worked. Even understanding and predicting what political leaders will do is of no value if you insist on a trading model built for a world that no longer exists. What is called high velocity trading, constantly trading on the infinitesimal movements of a calm but predictable environment, doesn’t work during a political tidal wave. And investors of the last generation do not know how to trade in a tidal wave. When we recall the two world wars and the Cold War, we see that this was the norm for the century and that fortunes were made. But the latest generation of investors wants to control risk rather than take advantage of new realities.
We have re-entered an era in which political factors will dominate economic decisions. This has been the norm for a very long time, and traders who wait for the old era to return will be disappointed. Politics can be predicted if you understand the constraints under which a politician such as Merkel acts and don’t believe that it is simply random decisions. But to do that, you have to return to Adam Smith and recall the title of his greatest work, The Wealth of Nations. Note That Smith was writing about nations, about politics and economics – about political economy.
It is getting close to time to hit the send button, and I must confess that this letter became overly long. Simply looking around at what was on my radar screen took me close to 15 pages, and I wasn’t even halfway through! Discretion being the better part of valor, and wishing to take pity on my ever-faithful readers, I simply cut the last half. Perhaps it will show up in some later missive.
But maybe this will give you a little understanding of the angst I go through each week, trying to decide what to write about. In 2006 I was beginning to reach for topics. Today there is literally no end of them.
In deleting half the letter, I left considerable notes on Japan and Europe on the cutting-room floor, as well as concerns about the current brouhaha over secular stagnation. Don’t even get me started on Fed policy and the cult that has developed around central bankers. I would probably start ranting about how monetary policy is about the fourth most important thing but has become an excuse for politicians to do nothing about the more important things that are at least obstensibly under their control.
So what’s on your radar screen?
I mentioned last week that my friend Tony Sagami is now publicly working for Mauldin Economics, and we can finally tell you that he has been the brains behind Yield Shark, which is our take on how to find yield in a low-interest-rate environment. Tony ranges all over the world finding those little anomalies which when put together can make a portfolio that generates reasonable yields in a tough investing environment. And every now and then he’s been able to capture some capital gains, which help the overall returns.
You will soon get an important email from Ed D’Agostino, the publisher of Mauldin Economics, telling you about the newest addition to our growing family of letters. Tony and I have been talking about this for some time, and we’ve decided to take advantage of his natural talent and launch a newsletter that will be called The Rational Bear. My good friend David Tice, who ran the successful Prudent Bear fund here in Dallas for so many years (and who lives in the same building I do) has spent a great deal of time with Tony, getting to know how he sees the world, and we agree that Tony has the right philosophy. And with the markets looking a little topping, the timing is not bad.
Just as with Yield Shark, Tony will be our international man. He will look for special situations all over the world that are just screaming “overvalued!” and work out how we go about timing what can be very difficult and sometimes dangerous trades. Shorting stocks is not for beginning investors. Seriously, don’t even think about trying to get your feet wet shorting by subscribing to The Rational Bear. Do your homework about all the risks first, before you start looking at the potential rewards!
With that caution, I think Tony will provide a very valuable service for serious traders. You will have another very astute set of eyes and ears scanning the world to help you with your portfolio research. And frankly, while we don’t talk about it much, we are building up a pretty cool team of researchers that help our writers dig deep and think wide. My partners at Mauldin Economics are handling our expansion, rapid though it is, in a very systematic and businesslike manner. We are all in good hands.
I know that some of you won’t need a letter from Ed to be persuaded to subscribe to The Rational Bear. Here is a link. Note that there is a serious discount off of the subscription price, which will last for only a short time. This is an introductory offer that will go away after launch. Also note that the letter is not cheap. The very nature of the letter means that there is a practical limit to how many subscribers we can have. Again, if you are serious, active investor, this is something you really want to look at. Subscribe now or wait for Ed’s note to tell you more, if you like.
San Antonio, Washington DC, and Dallas
I head to the Casey Research Summit in San Antonio, September 17-21. It actually takes place at a resort in the Hill Country north of San Antonio, which is a fun place to spend a weekend with friends. Then the end of the month will see me traveling to Washington DC for a few days.
I’ll be back in Dallas in time for my 65th birthday on October 4, and then I get to spend another two weeks at home before the travel schedule picks back up. I will make a quick trip to Chicago, then swing back to Athens, Texas, before I head on to Cambridge, Massachusetts, for conferences. There are a few other trips shaping up as well.
Tiffani (my oldest daughter) just sent me a text. It seems she is cleaning out her garage after accumulating a large number of boxes that have gone unopened for many moons. (That trait may be genetic.) I’m not quite sure how she got it, and neither is she, but she came across a paper that I wrote in my first year in seminary, back in 1973, entitled “Poverty and the Poor.” I have absolutely no idea what it says, but I’m looking forward to (and will probably be greatly embarrassed by) reading it. And yes, I went to seminary. I’m a full-fledged master divine or whatever they call the degree holder. I probably needed a 12-step program for that, too, for many years. Fortunately, I seem to have fully recovered. Time heals a multitude of sins, or something like that.
Taking a very full course load while also working a 40-hour week was tough, and it might have affected my academic effort. Evidently the professor who graded this paper thought so, as he or she gave me a B-. Tiffani said the prof wrote in the margin, “You need to do better research.” I’m sure there are lots of readers who concur with my professors. Now, however, my full-time job is research, so I have no excuse. If you give me a B- now, we just have to blame it on sloppy execution.
I’m really looking forward to being with so many friends in San Antonio this coming weekend. It will be my first opportunity to test my new travel resolve, which is to exercise more on the road. Having been home for more than a month and having been in the gym for at least six out of every seven days, I can see and feel a significant difference. It is tough for me to exercise on the road, but I have to figure out how to do it. Maybe I will start holding meetings on the treadmill.
I mean, last time I was in Singapore I had a morning meeting with Jim Rogers. I went to his house and sat outside while he pedaled like a madman on his exercise bike. He would have been about 70 at the time, and there is no way that I could even marginally keep up with him today (or ever!). He went for at least 90 minutes all-out. Outside in the heat and humidity. I was drenched with sweat just watching him. But he held his own in the conversation the entire time. He wasn’t even breathing hard when he got off the bike.
Have a great week and be sure and get a little exercise. You will live a little longer and feel a little better if you do.
Your always trying to think about what to write next analyst,

John Mauldin

Current Position of the Market
SPX: Long-term trend – In 1932 and 1974, the 40-yr cycle was responsible for protracted market weakness. The current phase is due this year but where is the weakness? Has man (Federal Reserve) finally achieved dominance over universal rhythms or has it simply delayed the inevitable?
Intermediate trend – We are looking for the move from 1905 to end, after which a much more serious correction should start.
Analysis of the short-term trend is done on a daily basis with the help of hourly charts. It is an important adjunct to the analysis of daily and weekly charts which discusses the course of longer market trends.
CORRECTION UNDERWAY
Market Overview
The current market profile does not fit that of a major top – although it could eventually develop into one. For now, selling is moderate and controlled. It does not exhibit a rush to the exit. Also, the correction does not look complete.
Let’s get a sense of where we are by dissecting the pattern made by the SPX:
Momentum: The weekly MACD reflects an increasing loss of upside momentum which could suggest that an important top is under construction. But there is still no confirmation that it is complete. A weekly close below 1975 would be a small red flag. A weekly close below 1940 would be a larger one, and a close below 1905 would tell us that a severe intermediate correction is underway. The dailyMACD is suggesting that the decline should continue. It has made a lower low followed by a lower high, both resulting in negative divergence to the price. Its two moving averages have made a bearish cross and the gap is getting wider. However, by closing at 8.61 on Friday, it is still strongly positive, indicating that only a correction is underway – for now!
Breadth: The McClellan Summation Index rolled over after making a secondary top at about 585 and has just started to decline, but with a reading of 433.85, it is still positive and, at this time, it only indicates that a correction is in progress. Keep in mind, however, that its primary top was above 1000; the secondary top made along with an all-time high in SPX has created severe intermediatenegative divergence. This too is a red flag! The McClellan Oscillator made a new low on Friday. This is a sign that the correction is not over.
VIX: After making a higher low when SPX made a new high (positive divergence) VIX started a controlled uptrend which made a slightly new high on Friday closing on its 200-DMA. It has now retraced 50% of its former decline, and its action reflects skepticism on the part of traders that we have started an important correction. (Perhaps this is a good reason to believe that the correction is not over!)
Structure: The best reading of EW at this time is that we are engaged in wave 4 of 5 (from 1905). But the structure could evolve into a totally different pattern, so we won’t bet the house on this analysis.
Accumulation/distribution: The SPX continues to add to its P&F formation but this may not alter the original count.
Chart Analysis
The daily SPX chart (courtesy of QCharts.com) graphically supports the observations made above.
The MACD is a good way to observe the loss of momentum in the chart, but the graph itself tells you that this is taking place.

By connecting the lows from 1343…..continue reading all markets includine Oil, Dollar, Gold, Bonds & more
, we get a good representation of the trend from that price to the present with the various lows pretty much in a straight line. But if we attempt to connect the tops, we have to adjust downward the slope of the trend lines several times. This is a sure sign that the price trend is losing its upside momentum, which means that there is shift taking place between the ratio of buyers to sellers. At some point, this ratio will achieve equilibrium and then the balance will begin to favor sellers over buyers, and we will have a market top. We are not quite there, yet!
A good representation (on a smaller scale) of this process taking place is the section which is outlined in blue lines. You can see a short but strong buying period starting at a steep angle, a consolidation, then the longer, more moderate uptrend under way which eventually starts to lose momentum, angling closer and closer to the trend line. The trend line is finally broken and the correction begins. This section (which is the mid-section of a larger pattern) can, with some slight modifications, illustrate the process which takes place as a bull market progresses. It can also, if you wish, be used as a fractal for both larger and smaller bullish patterns.
Based on this analogy, there is a good chance that our current uptrend from 1905 may not yet be complete and that a clearer pattern of deceleration needs to be formed at the top as the index eventually draws nearer to the trend line and finally breaks it. If I am correct about depicting how an uptrend begins, evolves, and eventually ends with the breaking of the principal trend line, it is not likely that we will see the top of this bull market anytime soon. The SPX is currently more than 400 points above its bull market trend line; if anything, it still appears to be accelerating upward.
What we should be looking for is an intermediate decline of a hundred and fifty points or more (primary wave IV), which could start as soon as the move from 1905 has ended (end of primary wave III), preceding the final phase of the bull market (primary wave V). This will undoubtedly take several more months to complete, so don’t expect an early end to the bull market!
Getting back to our chart, the purpose of all indicators is to identify the various phases of a market trend and its end. The MACD performs this task well, as the process of deceleration is clear in that oscillator. Divergence to price, crossing of its averages, and whether it is bullish or bearish all play a part in this analysis. According to the current position of the daily MACD, there is no indication that we are at the beginning of a major correction — nor, for that matter, that the correction is finished.
The A/D oscillator pretty much tells the same story as the MACD. By making a new low last Friday, it has said as much.
The SRSI is oversold and has made a small bullish divergence pattern. If it holds on to it for a few more days and turns up, we can look to a potential end of the correction.
Let’s see what the hourly chart (also courtesy of Q.Charts.com) tells us.
Here you can see the blue channel in more detail: the sharp start which was the trigger, the leisurely advance, and then the deceleration phase which led to the breaking of the trend line.
I have encased the current correction phase between two red trend lines. Note that on Friday, the index failed to go all the way to the bottom of the red channel, and then rallied into the close instead of closing on its low. This could be a warning that we are ready to challenge the top of the channel line; unless this turns out to be a false start and we begin to head down on Monday morning.
Also take notice of the (red) 200-hr MA. It usually provides a support or resistance level to the price. In this case, the index held just above it at the opening on the 10th and, although it dipped slightly below on Friday the 12th, prices recovered quickly. We’ll see if we open above or below it on Monday!
This is a level (1982/83) that has provided support to prices on three separate occasions. If it holds and if the index can develop enough upside momentum from here, it could be the starting point of a new uptrend. Breaking it will most likely extend the correction.
Judging by the oscillators’ performance on Friday, Monday could be an important day. All three of them either started to turn up, or showed some deceleration/divergence.

Breadth
The McClellan Oscillator and the Summation Index appear below (courtesy of StockCharts.com).
The McClellan Oscillator went from oversold to overbought, and has headed straight down to mildly oversold, again. The level marked by the green line is the area where a normal retracement occurs during short-term corrections in that index. If it stops there and turns back up, it will be an indication that the market correction may be coming to an end.
The Summation Index has turned down just before reaching its 200-day moving average. This is a sign of weakness, especially since the indicator has formed significant negative divergence with the SPX. That does not mean that we are ready for an immediate intermediate correction. As the McClellan Oscillator turns up, the current decline should be arrested and NYSI could meander upward without nullifying is divergence and negative reading.


Sentiment Indicators
The SentimenTrader (courtesy of same) long term indicator remains at 60 for the fourth consecutive week. This is another reason to believe that the SPX has not yet reached the top of wave 5 from 1905. It may have to see a reading of 70 once again before we see the top of the move.

VIX (NYSE Volatility Index) – Leads and confirms market reversals.
VIX is pretty much non-committal at this time. It made a higher low when the SPX made a new high revealing support that an important level may have been reached that the index will have difficulty overcoming, and that a decline could start from that level. However, it seems to lack conviction that this is the correct scenario, being cautious of not making a premature move, as it has in the past.
From a technical perspective, it is in a declining channel and has already tested its upper bounds. It may do so again in the near future if the market correction continues, but it will not progress into a break-out of its channel unless the prospects for a more protracted decline become clearer.

IWM (iShares Russell 2000) – Historically a market leader.
In spite of its relative weakness to the SPX over the intermediate term, IWM has handled the correction rather well. Of course it is benefiting from the support provided by both the 50 and 200-DMAs. Should it break below both and should they cross, it would be an important warning that the correction is getting worse, and that it is more than a simple consolidation in an uptrend.

TLT (20+yr Treasury Bond Fund) – Normally runs contrary to the equities market.
TLT has had quite a run since the beginning of the year and it is entitled to a rest. We can also superficially count five waves up from the beginning of the move, so this is an appropriate time to take a breather. Let’s see if what follows is simply a rest stop or something more severe.

GLD (ETF for gold) – runs contrary to the dollar index
GLD has had an extensive consolidation in a downtrend and now is showing signs of resuming its long-term decline. If the P&F chart is to be believed, GLD is likely to reach about 100, probably by the time that its 25-wk cycle makes its low in late November. As long as the dollar remains in a strong uptrend, GLD and other commodities will continue to underperform.

UUP (dollar ETF)
UUP is in a strong uptrend which is most likely a break-out from a multi-month base. However, it has reached its 22.50 initial target discussed in previous letters and is also close to the top of its consolidation channel. In other words, it is entitled to a rest before continuing on its upward journey.

USO (US Oil Fund)
Following chart courtesy of QCharts.com
USO is close to reaching the major trend line which has its start in 2009. Its performance during the bull market has been dismal, but we expected no less, as has been stated week after week. While there could be some holding action as a result of this major support line, prospects for holding above it are not bright.

Summary
SPX has started what (for now) appears to be a consolidation pattern which does not look complete. We will need at least another week to evaluate whether it deteriorates into a bona fide correction with lower targets. An accelerated decline would add to the perception that 2011 was an important top (completion of primary wave III). But then, SPX would eventually have to break below 1905 to confirm this view. Structurally, there are several possibilities which will be revealed as we move forward.
FREE TRIAL SUBSCRIPTON
Market Turning Points is an uncommonly dependable, reasonably priced service providing intra-day market updates, explanations, and commentary, plus detailed weekend reports. It is ideally suited to traders, but it can also be valuable to longer-term holders since price projections are provided using Point & Figure analysis along with best-time estimates obtained from cycle analysis.
For a FREE 4-week trial, Send an email to: ajg@cybertrails.com
For further subscription options, payment plans, weekly newsletters, and for general information, I encourage you to visit my NEW website at www.marketurningpoints.com. By clicking on “Free Newsletter” you can bring up the latest newsletter which is normally posted on Sunday afternoons (unless it happens to be a 3-day weekend; in which case it could be posted on Monday).

Recently we have come across one of those forecasts that are a dime a dozen these days, and usually escape out attention. The article at Marketwatch, entitled “Bull could run 5 more years, carry S&P 500 close to 3,000” only seemed interesting because the forecast sounded a bit extreme. We quickly scanned the headline, thinking that whoever was making this assertion surely hadn’t breathed a word about this when the SPX traded at just below 670 points in March of 2009. Such wildly bullish forecasts are strictly a function of SPX 2000 in our opinion, on a par with the “Dow 36,000” forecast, which gained some notoriety in the late 90s. One of the reasons behind the SPX 3000 forecast mentioned in the article did amuse us greatly though, namely the following:
“They cite extensive deleveraging in the U.S. as well as the uneven global recovery among other reasons why “this could prove to be the longest U.S. expansion – ever.”
(emphasis added)
Extensive deleveraging! Right. …..click the chart for larger charts & commentary

…..click HERE for 4 more charts & commentary

 “The concept of order that has underpinned the modern era is in crisis.” – Henry Kissinger
Kissinger noted that the era between 1948 and 2000 could be considered an “amalgam of American idealism and traditional European concepts of statehood and balance of power. But vast regions of the world have never shared and only acquiesced in the Western Anglosphere concept of order. These reservations are now becoming explicit, for example, in the Ukraine crisis and the South China Sea. The order established…by the West stands at a turning point.”
But fired with the heady feeling of apparent ‘victory’, the Anglosphere attempted to ‘bend’ the agreed Cold War peace terms by extending NATO membership to the Baltic States, Hungary, Slovakia, Romania, and Poland. It was no secret that the Ukraine was next on NATO’s wish list. Such an outcome would have been very difficult for Russia to accept.
Like the Germans, the Russians are a proud and tough people. While ‘acquiescing’, to use Kissinger’s term, they resented deeply this seemingly covert aggression by the Anglosphere. Under a tough, patriotic and charismatic President Putin, Russia apparently now seeks to regain some of its lost regional sphere of influence or empire. In this very limited sense, the Putin/Hitler comparison is apt.
Amazingly, the Obama Administration failed to recognize the Crimea and the land bridge to it, as a vital Russian interest. As a result, the U.S. Administration badly bungled the diplomatic response to Russia’s annexation of the territory. Far more serious is the probability that Anglo miscalculation can force greater cooperation between Russia and China and perhaps even Russia and Germany.
In his efforts to strike back at Putin, Obama’s choice of weapons defies practical sense. The trade sanctions seem to offer little except discord among the NATO allies. It was recently revealed that Germany was forced to negotiate secretly with Russia to ensure the continuation of some 40 percent of its winter energy supplies. Sensing these divisions doubtless has increased Putin’s ambitions. Now the entire Ukraine is in his sights. Over the weekend, news reports suggested a serious escalation of the conflict, which resulted in the Ukranian government shifting to a more defensive posture as Russian forces made serious territorial gains. More concerning, Obama’s misjudgments may push Germany increasingly from the Anglosphere towards the Asian sphere of Russia and China.
In the short-term, the flow of fear-money to the U.S. likely will continue and, depending on NATO’s decision, even increase. This could help drive the U.S. dollar, equities and Treasuries to new increasingly bloated highs. Over the medium term as anti-Russian trade sanctions bite harder, likely they will deepen the looming international recession. This may inspire central banks to enact still more aggressive monetary stimulation, taking financial markets yet higher.
‘Print Less But Transfer More: Why Central Banks Should Give Money Directly to the People’.
Such open signs of Keynesian desperation might magnify fears of economic recession combined with financial hyperinflation, or stagflation, and bring precious metals increasingly into play. Further, it may threaten the U.S. dollar’s Reserve status.
In short, the order that has dominated global politics for much of the past century is facing a severe test on all fronts. Unfortunately, the current leadership in Washington is woefully lacking in strategic understanding and intestinal fortitude. This is exactly the wrong combination at the wrong time. The Anglosphere’s ineptitude may even overcome the best efforts of Janet Yellen and succeed in pushing the stock market into a much needed correction.


-
I know Mike is a very solid investor and respect his opinions very much. So if he says pay attention to this or that - I will.
~ Dale G.
-
I've started managing my own investments so view Michael's site as a one-stop shop from which to get information and perspectives.
~ Dave E.
-
Michael offers easy reading, honest, common sense information that anyone can use in a practical manner.
~ der_al.
-
A sane voice in a scrambled investment world.
~ Ed R.
Inside Edge Pro Contributors

Greg Weldon

Josef Schachter

Tyler Bollhorn

Ryan Irvine

Paul Beattie

Martin Straith

Patrick Ceresna

Mark Leibovit

James Thorne

Victor Adair