
Gold & Precious Metals
Scotland voted to remain part of the United Kingdom, Alibaba (BABA) is going to become the United States largest initial public offering (IPO), U.S. stock market indexes are up nearly 2% this week, Treasury yields are near lows, and gold and silver prices are getting bludgeoned in the paper market.
While U.S. financial prognosticators are raving over Alibaba and the IPO, the price action in precious metals and in the broader U.S. equity indexes showed signs of weakness about the time it was announced that Alibaba could start trading in the low to mid eighties.
The gold and silver charts shown below demonstrates the strange price action in silver futures after the announcement regarding Alibaba’s likely price increase at the open of trading in the stock today.

The chart below shows gold futures prices during the same time frame as the silver chart above.

The hype surrounding the Alibaba IPO is almost nauseating. However, it may provide an excellent trade entry into a long position in precious metals. Both gold and silver have been under major selling pressure for several weeks.
In silver, the selling pressure started around July 15th of this year and the selling has not stopped. Silver futures prices dropped from roughly $21.50 to $18.50 an ounce in about two months. This represents a near 14% decline in the price of silver over the past 2 months.
Gold prices have also seen strong selling over the same period from July 15th to present. Gold prices fell from around $1,340 per ounce to a recent low slightly below $1,220 per ounce. Gold prices dropped nearly 9%, showing some strong relative strength against silver futures.
We have been watching the precious metals sector very carefully for several weeks and price action seems poised for a bounce as major support is underneath both silver and gold futures here. A break of these levels would trigger some potentially strong selling pushing metals prices considerably lower. The daily chart of gold futures is shown below:

The $1,180 – $1,200 price level has shown major support for gold futures prices which is clearly depicted on the weekly chart of gold futures shown above. We are contrarian traders and the price action in precious metals is ripe for a potential bounce. We view the opportunity more as a trading opportunity than an investment opportunity for now, but that could change in the longer term.
As an options trader, we will likely use a put credit spread using the gold ETF (GLD) as the underlying asset. The trade will have defined risk and will capitalize on higher gold prices, the passage of time, and reduced volatility in GLD options. Recently the options alert service from TheTechnicalTraders has put up some huge winning trades and the track record has been impressive thus far.
About Chris Vermulen
Founder of AlgoTrades Systems., internationally recognized market technical analyst and trader. Chris is also the founder of TheGoldAndOilGuy.com, a financial education and investment newsletter service. He is responsible for market research and trade alerts for of its newsletter publication. He is the author of “Technical Trading Mastery – 7 Steps To Win With Logic” and has been featured in Futures Magazine, Gold-Eagle, Safe Haven, The Street, Kitco and dozens of other financial websites.

With Michael Campbell asking Martin Armstrong tomorrow to find out “what his model says about the bond market” in will be interesting to see if Martin’s work supports this analyst’s opinion that its:
The end of tapering and government funding
Last year markets behaved nervously on rumours that QE3 would be tapered; this year we have lived with the fact. It turned out that there has been little or no damage to markets, with bond yields at historic lows and equity markets hitting new highs.
This contrasts with the ending of QE1 and QE2, which were marked by falls in the S&P 500 Index of 9% and 11.6% respectively. Presumably the introduction of twist followed by QE3 was designed at least in part to return financial assets to a rising price trend, and tapering has been consistent with this strategy.
From a monetary point of view there is only a loose correlation between the growth of fiat money as measured by the Fiat Money Quantity, and monthly bond-buying by the Fed. FMQ is unique in that it specifically seeks to measure the quantity of fiat money created on the back of gold originally given to the commercial banks by our forebears in return for money substitutes and deposit guarantees. This gold, in the case of Americans’ forebears, was then handed to the Fed by these commercial banks after the Federal Reserve System was created. Subsequently gold has always been acquired by the Fed in return for fiat dollars. FMQ is therefore the sum of cash plus instant access bank accounts and commercial bank assets held at the Fed.
The chart below shows monthly increases in the Fed’s asset purchases and of changes in FMQ.

The reason I take twice the monthly Fed purchases is that they are recorded twice in FMQ. The chart shows that the creation of fiat money continues without QE. That being the case, QE has less to do with stimulating the economy (which it has failed to do) and is more about funding government borrowing.
Thanks to the Fed’s monetary policies, which have encouraged an increase in demand for US Treasuries, the Federal government no longer has a problem funding its deficit. QE is therefore redundant, and has been since tapering was first mooted. This does not mean that QE is going to be abandoned forever: its re-introduction will depend on the relationship between the government’s borrowing needs and market demand for its debt.
This analysis is confirmed by Japan’s current situation. There, QE coincides with an economy that is deteriorating by the day. One cannot argue that QE has been good for the Japanese economy. The reality behind “abenomics” is that Japan’s government is funding a massive deficit at the same time as savers are drawing down capital to cover their day-to-day living requirements. In short, the funding gap is being covered by printing money. And now the collapsing yen, which is the inevitable consequence of monetary inflation, threatens to expose this folly.
On a final note, there appears to be complacency in capital markets about government deficits. A correction in bond markets will inevitably occur at some point and severely disrupt government fund-raising. If and when this occurs, and given that it is now obvious to everyone that QE does nothing for economic growth, it will be hard to re-introduce it as a disguised funding mechanism for governments without undermining market confidence.

The following is a plausible forecast / prediction
Despite my known disdain for time and price predictions, I base the plausible forecast for an October 2014 generational low in the dollar-denominated value of Silver upon the cyclical duration of a prior elongated bear market that occurred from May 1968 thru November 1971.
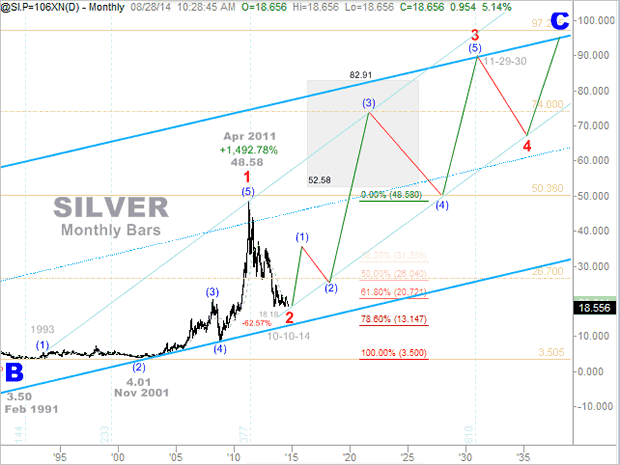
Back then, the price of Silver declined by more than 50% over the course of 3.46 years. We have already surpassed (-62.57%) the magnitude of the previous decline amid the current bear market, and we are rapidly approaching symmetry with the previous time duration – hence, the probability of a similar cyclical low soon forthcoming.
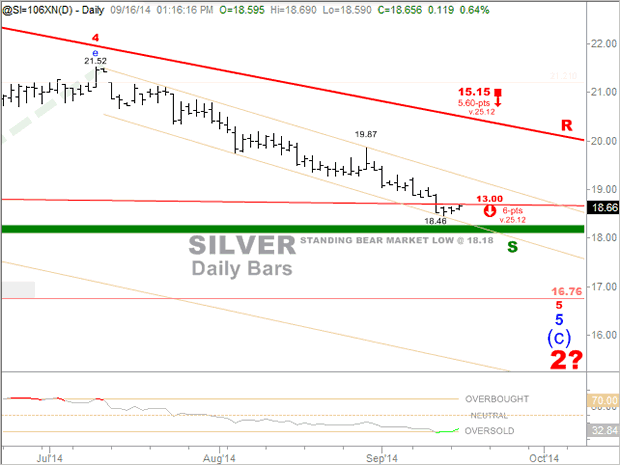
How low can the dollar-value of Silver go before the next generational bottom is in? – From my perspective, there are three such price targets following a retest and plausible breach of the standing bear-market low at $18.18. The nearest is $16.76, and so long as the price of Silver remains beneath $25.12, the second is $15.15, and the last downside price target we have on record is $13.00.
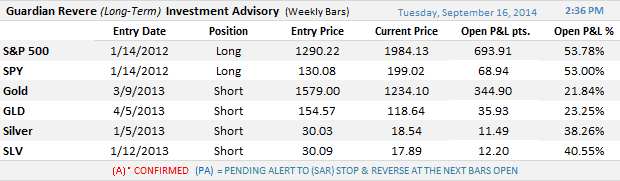
Our Long-Term Trend Monitor subscribers have been hedging their physical rather successfully for nearly two-years now. (See below stats)
Until Next Time,
Trade Better / Invest Smarter
Bottom line – Predictions and forecasting aside, all that matters to our subscribers and us – is being right more often than being wrong, and establishing prudent hedges along with winning and profitable trades in every timeframe. This is what we’ve been all about accomplishing for our members since 2005.
Do you think that you can benefit from such guidance, yes, or yes? Whatever your timeframe and objectives, we have prudent and effective solutions without all the hype and nonsense
Via real-time email alerts and daily PDF reports, the Chart-Cast Pilot conveys exclusive actual positions taken within the portfolio, which continues to sport a phenomenal performance record in every timeframe.
Updated quarterly with unlimited email alerts as market conditions dictate, the Long-Term Trend Monitorprovides the exact same type of service – but is dedicated exclusively to the self-directed long-term index investors of the equity and precious metals worlds. It too performs extremely well, and with limited downside risks.
When compared with “going it alone,” or employing an exorbitantly commissioned hedge fund for so-so results, especially after fees, the choice should be a rather simple one.
The Chart Cast Pilot and Elliott Wave Technology’s Guardian Revere Long-Term Trend Monitor are the proud sponsors of this communication.

Since last summer, investing in the mining sector has been akin to riding a mini roller coaster. There have been two huge rallies, two sudden and sharp declines while more than a handful of individual stocks have rebounded over 200% from their lows. Nevertheless, as we noted a few weeks ago the weakness of the metals won out and are dictating the terms. Since we covered the metals in our last missive we wanted to focus solely on the miners. A look at the bear market analog chart as well as a very long-term chart of GDM illustrates the coming risks and opportunities.
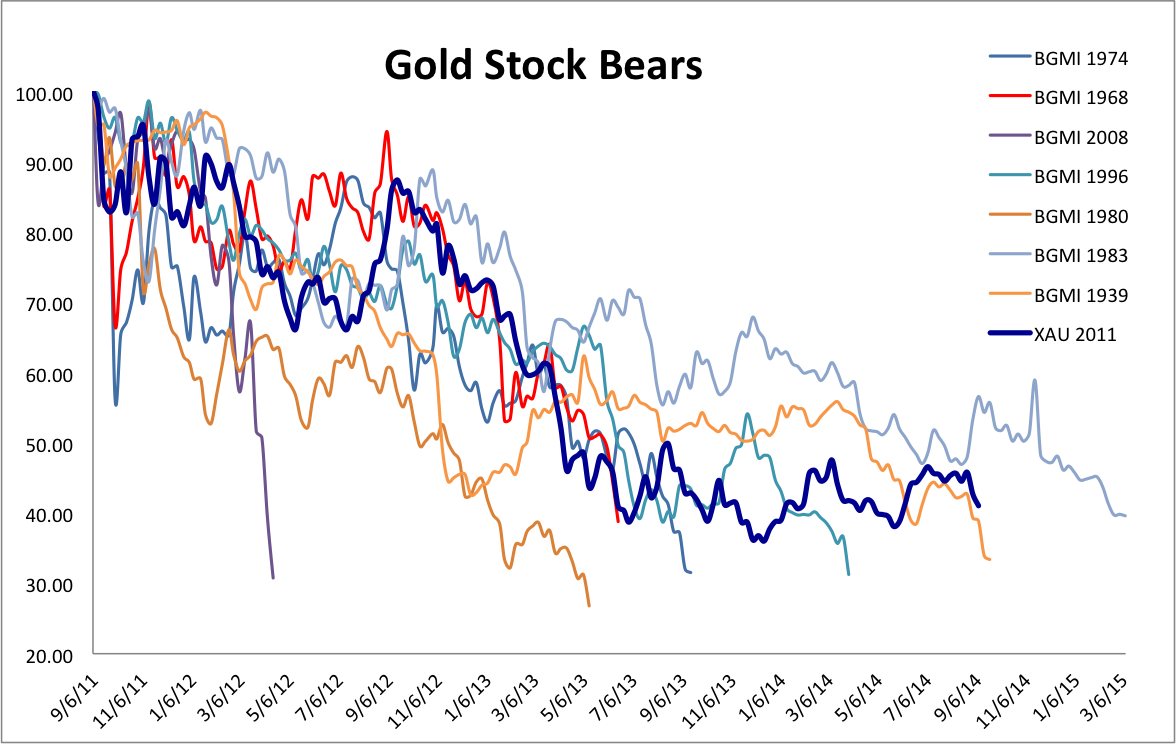
Here is the updated bear analog chart for the gold stocks. The XAU is used for the current bear market. This chart helped identify the opportunity at the June 2013 and December 2013 lows. There has been only one bear market worse than 70%. If you believe the gold stocks have not bottomed then this is the second worst bear in terms of time. The chart argues that if the December low is taken out, it would be so only marginally. A 65% loss at the December 2013 low could become 67% or 68% but probably not anything worse.
Below is a weekly line chart of GDM, the NYSE Gold Miners index and the basis for GDX. This is one of the broadest indices for miners. GDM has two levels of strong support which date back 20 years. GDM would have to decline 13% and 17% to test those supports. At the top, we plot the assets in the Rydex Precious Metals Fund which have dwindled 86%. We plot in blue a rough projection only for consideration purposes.
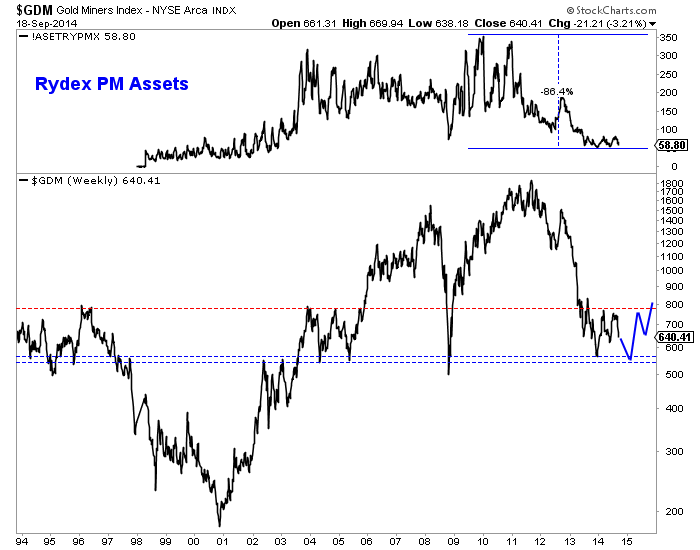
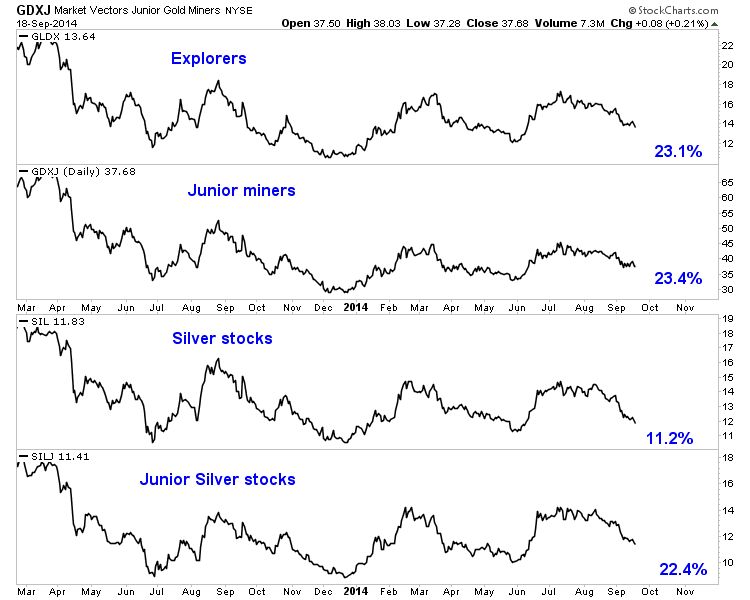
In looking at long-term charts of miners, I find that a double bottom (seen above) is definitely possible. In the chart below we plot GLDX, GDXJ, SIL and SILJ. Considering a 3% margin of error, three of the four ETFs would have to decline more than 25% to rule out a long-term double bottom.
The risk is quite clear. Failed moves produce fast moves. The miners failed to breakout and have tumbled. The late May lows mark the next support but these points do not amount to much beyond the daily charts. Furthermore, after $1200 Gold’s next strong support isn’t until $1080, the 50% retracement of the entire bull market. Hence, there is a growing risk of the miners falling to their December lows. Therein lies the opportunity. Only time will tell but that point could immediately mark a shift from risk to amazing opportunity. We invite you to learn more about our premium service in which we will soon publish a report on our top 5 buys at the bear market bottom.
Good Luck!
Jordan Roy-Byrne, CMT

Quotable
“Tape reading was an important part of the game; so was beginning at the right time; so was sticking to your position. But my greatest discovery was that a man must study general conditions, to size them so as to be able to anticipate probabilities. In short, I had learned that I had to work for my money. I was no longer betting blindly or concerned with mastering the technic of the game, but with earning my successes by hard study and clear thinking.”
Larry Livingston [taken from Reminiscences of a Stock Operator]
Commentary & Analysis
This dollar bull could have a long way to run
It is interesting others are finally noticing “the currency formerly known as the ugly step-sister,” aka the US dollar, is rallying. Even the newsletter crowd, otherwise known as “the perennial dollar disaster promoters,” is recognizing just maybe they’ve gotten it wrong, again, when it comes to the buck.
Financial TV has been reporting the dollar has made a “huge” move. It is a perspective others seem to share because they are asking: When will the Federal Reserve do something to weaken the dollar? But if what we are witnessing is a true bull market, this thing has a long way to run. Heck, we haven’t even broken out yet.
I shared the following chart with my subscribers on Tuesday night.

In the box (in the chart above) to the left it shows the most recent US dollar index bear market, which ended on the same day the US government stepped in to save Bear Sterns—March 17th 2008. The red box on the right shows price action over the last six years since the dollar put in a major bottom. We are just now testing the downtrend from the previous swing highs gong all the way back to 2006. The key drivers are growth, yield, and money flow (foreign direct investment).
My guess, based on the length of the last two US dollar index bull markets since the dollar began floating, is this bull market could run 10-years or more. Given the relative positioning of the United States vis-à-vis its major country competitors, the idea of a 10-year bull market seems to make sense.
So, to give you a bit of perspective to see the potential in a real dollar bull market, and to help explain what I mean when I say this thing could have a long way to run, below is a little matrix I put together comparing where the major pairs were back in July 2001 to where they are today; plus the % move in each of the pairs if it the dollar index were to return to its 2001 high:

Granted, this is a bit simplistic. But I wanted to provide some perspective on potential and to suggest we haven’t seen much yet if my guess about a multi-year dollar bull proves correct.
I realize there are still many out there who cling to the notion the US dollar is doomed. The major newsletter houses have been telling you that for years. I have stopped reading their nonsense on the dollar. So in that vein, I want to leave you with these comments by Michael Pettis taken from his blog—I think a very reasoned view.
Professor Pettis acknowledges the dollar as reserve currency is not a guarantee, there are real risks. But he understands an end to dollar hegemony might not be all that bad for the US. Mr. Pettis’ also makes a point the dollar doomers always ignore—other countries use the reserve currency very much to their advantage; then complain about it when it suits their story. In short, it doesn’t appear the dollar will be relegated to the dust bin of history any time soon, so you can take advantage of this dollar bull.
Professor Michael Pettis [my emphasis]:
The US dollar will remain the world’s dominant reserve currency for a very long time, partly because it is the only currency that exhibits anywhere near the needed level of credibility, mobility, and low transactional costs, and mainly because for all the huffing and puffing about “exorbitant privilege” no other country is willing to pay the considerable cost of allowing its currency to be accumulated by foreign central banks whenever these countries experience weak domestic demand. The only way this will change, I think, is if, and perhaps when, Americans decide that they are no longer willing to enjoy the “exorbitant privilege”, and Washington imposes restrictions on foreign purchases of US dollar assets, as was the case until the 1960s.
Five years ago I would have told you that this would never happen, but two things seem to have changed. First, as Americans become increasingly aware that when foreign central banks amass hoards of dollars and prevent others, including the Fed, from reciprocating, they aren’t doing the US any favors (and if they were, why are they so determined to prevent other central banks, including the Fed, from returning the favor?). Their purchases are aimed at boosting domestic employment, and unless productive investments in the US are unfunded because of a savings shortage (which is all but impossible to believe), their purchases must result either in an increase in US debt or an increase in US unemployment. This may sound surprising to many people, including, shockingly enough, to many economists, but is actually quite easy to prove, either by using balance of payments arithmetic or by looking at the historical precedents.
So the next time someone tells you the US dollar is “way overvalued” and the “Fed must do something,” just show them the weekly chart above.
Black Swan Currency Options Strategist
I beat up our subscribers pretty badly in the March and June expirations, after doing quite well for them going into the time frame. Now we are back on track, recording some nice profits and seeing some nice opportunities. We are sitting on an open profit of 136% in a Dec Aussie dollar put (FXA). And below is a look at the last three trades we closed (not ½ denotes half position in the track):
Black Swan Currency Options Strategist Closed Positions:

If you would like to subscribe to our service it is only $395 per year and you can do so at the following link:
http://www.blackswantrading.com/currency-options-strategist/
Thank you.
Jack Crooks
President, Black Swan Capital

-
I know Mike is a very solid investor and respect his opinions very much. So if he says pay attention to this or that - I will.
~ Dale G.
-
I've started managing my own investments so view Michael's site as a one-stop shop from which to get information and perspectives.
~ Dave E.
-
Michael offers easy reading, honest, common sense information that anyone can use in a practical manner.
~ der_al.
-
A sane voice in a scrambled investment world.
~ Ed R.
Inside Edge Pro Contributors

Greg Weldon

Josef Schachter

Tyler Bollhorn

Ryan Irvine

Paul Beattie

Martin Straith

Patrick Ceresna

Mark Leibovit

James Thorne

Victor Adair