


 The forecast called for overcast skies and instead we got sunshine.
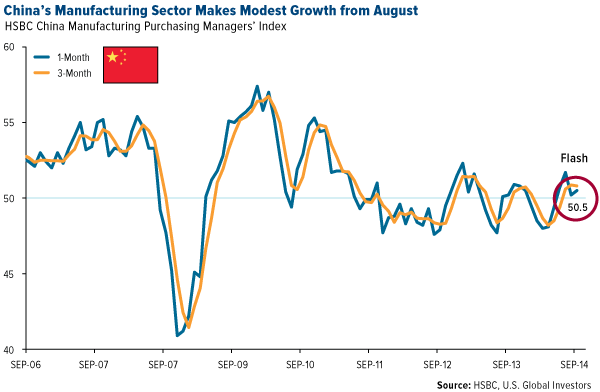


 Miners are having a tough time getting funded, and although Canadian oil and gas has performed well over the last few quarters, some companies might be overvalued. No wonder investors are confused. In this interview with
 The Mining Report: In February, you gave a speech at The Vancouver Club that acknowledged the impact of investor fatigue on the junior mining equity space. Seven months later, are investors starting to get excited again about the space?
Jason Mayer: Investors have been reacting in fits and starts, and everyone is still very cautious. I track a number of funds, and I watch how they perform on a day-to-day basis. What I have found interesting is that a number of resource funds in Canada continue to be underweight, particularly in gold equities. I notice they underperform on days that gold stocks have good moves. The generalists out there among the institutional money have little to no presence in various gold equities. For the most part, people have abandoned the space.
TMR: What will it take to get them excited again?
JM: They’ll want to see some upward trajectory. I don’t know if it’s going to be a couple of data points that confirm the arrival of an inflationary environment, or the cessation of this disinflationary environment that we’ve been in since 2009, but people would have to feel comfortable that the gold price isn’t going to resume the decline it experienced in 2013. There are still a number of analysts and commentators out there who are calling for gold in the $800–1,000/ounce ($800–1,000/oz) range.
TMR: Is it the seemingly never-ending rise of the blue chip stocks that makes people less likely to look at the juniors, whether energy or precious metals?
JM: I don’t know how much it has to do with that, but, certainly, the very strong U.S. dollar is influencing the gold price and precious metal equities. Everyone has their own opinion on what drives gold. Mine is pretty simple. I look at it as a currency investors can choose from among a number of currencies worldwide, the U.S. dollar being the primary driver of gold, because gold is typically quoted in U.S. dollars. The strength of the U.S. dollar has led people to doubt the need to hold either gold or gold-related equities in their portfolios.
TMR: What about the impact on energy stocks?
JM: We’ve had a pretty good run for a number of the energy companies here in Canada. In fact, our energy fund that is run by Eric Nuttall is up 40+%. That is an overall reflection of how the energy equities have done, both the exploration and production (E&P) companies and the service companies.
TMR: The lack of excitement has also impacted financing. You estimated that in 2011, miners raised $1 billion ($1B) in flow-through funds, and in 2012, that number was down to $700 million ($700M). In 2013, it was $350M. So far this year, it is even 15% lower than that. Why has it been so hard to raise money right now?
JM: When we look at it over a multiyear horizon, we’re at a 10-year low. The companies that have been hit the hardest are the miners. They’re the ones that have seen the appetite for flow-through decrease the most, certainly much more than energy companies, where the appetite for flow-through continues to remain pretty healthy.
 The companies that have very high-quality projects have been able to access the capital markets and issue equity. In some cases, they have turned to royalties and, in very rare cases, private equity, but for the most part, the juniors are very challenged, especially the exploration companies. They’re hanging on by a thread. Essentially, a lot of their expenditures are really on just keeping the lights on, so they’re no longer advancing projects because the capital is just not available to them.
TMR: Will this lack of capital lead to more mergers and acquisitions?
JM: I thought that would have happened by now. But that is the logical conclusion. There are two major impediments. In many cases, we see management teams that are entrenched—just there to collect a salary and a bonus. The second issue is with the acquirers, especially the majors. These are companies that went on spending sprees in 2009 and 2010; Barrick Gold Corp. (ABX:TSX; ABX:NYSE) is a good example. Although there are a number of very solid acquisition opportunities in this environment, some of these companies are gun shy because of their experience over the past couple of years, and support among the shareholder base can also be quite tentative.
TMR: You manage the Sprott Flow-Through Limited Partnership and the Sprott Resource Class Fund. The 2014 $11.7M Flow-Through L.P. is 90% in cash, correct?
JM: The 2014 fund initially raised north of $17M. It’s a process of identifying candidates, engaging them to issue flow-through and then actually consummating the transaction. So, in fact, right now, I’m 100% invested—a bit of an update, which the public documents don’t reflect at the current time. I am approximately 60% invested in energy names, 40% in mining. The three largest holdings are Tourmaline Oil Corp. (TOU:TSX), Paramount Resources Ltd. (POU:TSX) and Kirkland Lake Gold Inc. (KGI:TSX).
TMR: And Kirkland?
Tourmaline is an oil and gas E&P company. It is operated by a management team with an excellent reputation. This is the team that grew Berkley Petroleum Corp. and sold to Anadarko Petroleum Corp. (APC:NYSE). The team grew Duvernay Oil and sold to Royal Dutch Shell Plc (RDS.A:NYSE; RDS.B:NYSE). This is the third iteration. The team is led by Mike Rose, who, last I checked, didn’t take a salary and didn’t take a bonus, so he is very well aligned with shareholder priorities. His compensation is driven primarily by how the shares actually perform.
 Tourmaline is a low-cost, primarily natural gas producer located in Canada. All its properties are in Canada. It is also increasing its exposure to liquids, which is enhancing the economics. Its rates of growth, despite the fact that it is an $9B market-cap company, continue to be industry leading.
Paramount is about a $6B market-cap company. Management is incredibly well aligned. The company has a number of assets, but the primary driver is the liquids-rich natural gas-producing horizon. More recently, it has also been developing its own infrastructure capacity, which has been a bit of an issue in western Canada. This will have a big impact on the economics but, more importantly, allow it to grow production without being held hostage by midstreamers. This is the type of company where, if investors have a three- to five-year horizon, I think they will be very well rewarded for taking a longer-term approach. Some will criticize the fact that maybe this doesn’t drive quarter-to-quarter performance, but this is definitely a stock that you want to own as opposed to rent.
JM: Kirkland Lake has been a bit of a turnaround story if you pull up the stock chart. Late last year it had some management turnover and brought in George Ogilvie as CEO. Operationally, the impacts were felt almost immediately. He has taken a mine that was losing money and putting up lower-grade material and, to a certain extent, “high graded” the mine through a number of operational adjustments. The company is now on track and in the process of transitioning into a positive cash flow-producing mine. You’ll probably see that come to fruition later this year or early next year. The market has obviously recognized that, and that’s why Kirkland has been a significant outperformer over the past six to nine months.
TMR: You mentioned that the Sprott Flow-Through L.P. is 60% in energy. The Sprott Resource Class Fund flipped, from 56% energy and 42% minerals to 54% minerals and 46% energy. The energy and non-energy percentages flipped. Was that a conscious shift or a result of changes in equity valuations?
JM: That was a conscious shift. I started reducing my exposure to Canadian energy names. It was a function of both profit-taking and repositioning. Some of these companies’ valuation multiples had expanded quite dramatically. I took some profits and deployed a significant portion of that into some gold-weighted equities.
TMR: What are your projections for oil and gas prices?
JM: Gas is a tough one to call, but I think it will bounce around $3–4/thousand cubic feet ($3–4/Mcf). The upside will be predicated on very cold weather, which will drive additional demand. Without that, it’s going to be mired in a $3–4/Mcf trading environment. The part of the equation that’s a little more transparent is the supply side. The bottom line is North American natural gas production continues to hit record highs. It’s going to continue to hit record highs based on a number of projects that are in the process of being commissioned and developed. That’s going to bring new gas to market. A lot of this new gas that’s coming onstream is highly economic, so even at $3/Mcf gas, the operators of these projects are going to continue to drill.
 The wild card is the demand side of the equation. There are some longer-term developments that are going to be bullish for demand, such as gas-fired electrical generation, utilizing natural gas as a transportation fuel and liquefied natural gas exports. The problem is that these are very long-dated and uncertain demand initiatives. Because of that uncertainty, I don’t want to invest now based only on whether I think it’s going to be a cold winter or not.
TMR: That makes sense.
JM: For oil prices, I’m expecting $90–110/barrel ($90–110/bbl). The Brent benchmark is what we use. I think the demand backdrop is pretty positive. China seems to be back on track. There was a lot of concern over the past few months on where its economy was going. It looks as if the Chinese central planning authorities are committed to a 7.5% growth target, and its most recent gross domestic product number was just that.
In the U.S., the numbers have been just spectacular. The economy appears to be picking up speed and momentum, whether you’re looking at manufacturing activity, employment figures or job openings. There really don’t seem to be many negative data points right now. The one area of concern is the European Union. It looked as if it was coming out of its recession, and then it had a bit of a hiccup. The whole Russia/Ukraine situation could have an impact. But generally, demand is pretty solid.
On the supply side, it just costs a lot of money to produce oil. Some 96% of the supply growth outside of OPEC in 2013 came from the U.S. If you’re looking at the U.S. full-cycle costs, they’re about $60/bbl. You really need $70–80/bbl as an absolute floor to ensure that the U.S. will continue to drill.
TMR: What oil companies have performed best for you?
JM: Year-to-date, that would be Yangarra Resources Ltd. (YGR:TSX.V), RMP Energy Inc. (RMP:TSX), Spartan Energy Corp. (SPE:TSX.V), Delphi Energy Corp. (DEE:TSX) andBirchcliff Energy Ltd. (BIR:TSX). Birchcliff is a gas-weighted producer, but all the others have varying levels of oil production, some of them more significant than others.
TMR: Do you still own all of those, or are there some that you sold for profits?
JM: I sold Birchcliff and Delphi.
TMR: You mentioned RMP. It announced some record levels of production for Q2/14, but operating expenses decreased. How was it able to do that?
JM: A lot of RMP’s production growth has been driven by a relatively new discovery, Ante Creek, that it is in the process of developing. It has put in a pipeline to this particular property. That’s had a dramatic impact on the cost structure, lowering costs and increasing production. I see further momentum behind it. I fully expect it to once again increase its production guidance sometime later this year. Management has done a really good job of managing market expectations—underpromising and overdelivering.
TMR: What’s the story on Spartan and Yangarra?
JM: Yangarra has a very focused land position. It trades at a significant discount to the peer group. Personally, I’m always looking at valuation and growth rate. So not only is the company trading at a very significant discount to the peer group, but it also has been putting up peer-leading growth rates on a per-share basis. Its balance sheet is in good order. As the story continues to get attention, I think it will be rewarded with a multiple expansion.
 Spartan Energy’s management team has basically demonstrated to the market that it goes out, acquires assets, demonstrates concept, grows the asset base—and then sells. This is a team that has made me a lot of money in the past. It continues to make me a lot of money now. As with RMP, management has mastered the art of underpromising and overdelivering. This is very important in retaining the cost of capital advantage, which is imperative in executing acquisitions efficiently.
TMR: Do you see energy services as a less volatile way to leverage the energy space?
JM: The short answer is no. It’s a very volatile group. There are a lot of different specialties within the energy services, so it’s really dependent on which particular area you’re talking about. But if you want to get leverage to the energy space through services, then you’re probably buying something that is quite leveraged to the energy space and will do very well if the whole space does well, but it’s a double-edged sword. That leverage can also work against you if things don’t work out according to plan.
Earlier this year, I pared back some of my services holdings; I felt that these companies really got ahead of themselves. Personally, if I want that torque and leverage to energy, I’ll just play the E&P companies.
TMR: You mentioned that you are consciously shifting to the materials companies, the precious metals. What number are you using for gold and silver prices in your estimates? What companies are you picking up?
JM: I’m using around $1,300/oz. For the most part, my focus is on companies that are all-in cash flow positive. To try to capture the full picture, I like to look at the margin after adjusting not only for cash costs but also for royalties, taxes, general and administrative expenses and sustaining capital. If the gold price is under pressure, I try to pick companies that have the best chance of surviving if things get ugly.
TMR: What companies have the best chances?
JM: Some of my recent purchases are Endeavour Mining Corp. (EDV:TSX; EVR:ASX), Rio Alto Mining Ltd. (RIO:TSX.V; RIO:BVL) and Mandalay Resources Corp. (MND:TSX). Each of these companies satisfies those criteria.
TMR: Mandalay is a growth story, correct?
JM: For the most part, all of these names demonstrate some degree of growth, and Mandalay is also an all-in cash flow-positive company.
TMR: Mandalay has gold, copper, silver and antimony. Do you get into the base metals much?
JM: I can get into any sort of resource. The base metal I like right now is zinc, which is really just fundamentally driven. Over the next two years, we are going to see about 10–15% of primary mine supply in zinc come offstream, simply because of depletion. The problem is it is difficult to get pure exposure to zinc. The one pure play is Trevali Mining Corp. (TV:TSX; TREVF:OTCQX; TV:BVL), which I own. The company has a couple of properties, one in Peru, where it is partnered with Glencore International Plc (GLEN:LSE), and one in Canada that it is in the process of developing. Outside of Trevali, pure play choices get thin very quickly. That’s why there’s going to be a mine supply issue in the next two to three years.
TMR: Endeavour Mining is gold, and it’s in production in Africa. Do you have a discount because of its jurisdiction?
JM: The market typically discounts production coming out of certain jurisdictions. There is a bit of an advantage to owning this name because it has been under the radar, and it offers an attractive valuation multiple. Endeavour certainly appears to be a little less followed than most, but therein lies the opportunity.
TMR: Do you have any words of wisdom for investors who are feeling stock fatigue right now from the resource space?
JM: I think the biggest thing you need to have is conviction and fortitude when a lot of these names are volatile, and try to keep your wits about you. Try not to trade based on emotion; trade based on your logic and thought processes. If your logic has not changed, stick to the tune.
TMR: Thank you for talking with us today.
Jason Mayer joined Sprott Asset Management LP in November 2012. He has more than 10 years of investment industry experience and joined Sprott from Middlefield Capital Corp., where he acted as lead portfolio manager on a number of investment funds with a focus on growth-oriented resource equities. Mayer is an MBA graduate of the Schulich School of Business at York University and holds the Chartered Financial Analyst designation.
Read what other experts are saying about:
Want to read more Mining Report interviews like this? Sign up for our free e-newsletter, and you’ll learn when new articles have been published. To see recent interviews with industry analysts and commentators, visit The Mining Report homepage.
Related Articles
- Tell Us, Christos Doulis, Can Gold Act as a Safe Haven Again?
- Eric Coffin: Can Investors Still Find Tenbaggers?
DISCLOSURE:
1) JT Long conducted this interview for Streetwise Reports LLC, publisher of The Gold Report, The Energy Report, The Life Sciences Report and The Mining Report, and provides services to Streetwise Reports as an employee.
2) Jason Mayer: I own, or my family owns, shares of the following companies mentioned in this interview: Paramount Resources Ltd. and Tourmaline Oil Corp. I personally am, or my family is, paid by the following companies mentioned in this interview: None. My company has a financial relationship with the following companies mentioned in this interview: None. I was not paid by Streetwise Reports for participating in this interview. Comments and opinions expressed are my own comments and opinions. I determined and had final say over what companies would be included in the interview based on my research, understanding of the sector and interview theme. I had the opportunity to review the interview for accuracy as of the date of the interview and am responsible for the content of the interview.
3) The following companies mentioned in the interview are sponsors of Streetwise Reports: Royal Dutch Shell Plc, Mandalay Resources Corp. and Trevali Mining Corp. The companies mentioned in this interview were not involved in any aspect of the interview preparation or post-interview editing so the expert can speak independently about the sector. Streetwise Reports does not accept stock in exchange for its services.
4) Interviews are edited for clarity. Streetwise Reports does not make editorial comments or change experts’ statements without their consent.
5) The interview does not constitute investment advice. Each reader is encouraged to consult with his or her individual financial professional and any action a reader takes as a result of information presented here is his or her own responsibility. By opening this page, each reader accepts and agrees to Streetwise Reports’ terms of use and full legal disclaimer.
6) From time to time, Streetwise Reports LLC and its directors, officers, employees or members of their families, as well as persons interviewed for articles and interviews on the site, may have a long or short position in securities mentioned. Directors, officers, employees or members of their families are prohibited from making purchases and/or sales of those securities in the open market or otherwise during the up-to-four-week interval from the time of the interview until after it publishes.

 The European Central Bank again


