
Currency
It seems nothing can stop the US Dollar. Since its low in April it has closed higher in four out of five months and is up almost 8.00% since then. While a run like that is in need of a rest there are some big issues that need to be considered now.
DXY broke out of a six-year triangle this month. Breaking to the upside from a triangle is bullish. That triangle is essentially a six-year base and should give DXY some serious “legs” for the future.
As the world’s most important commodities are priced in US Dollars, a higher Dollar means lower commodity prices; deflation. Note in the chart below how both equities and commodities trended higher during the inflationary period associated with a falling Dollar. Note also the “Goldilocks” period while DXY has been forming its base. Even commodities, which took a big hit in 2008, have essentially gone sideways since then.
The Dollar breakout is warning of an end to the bull market in equities and renewed bear market in commodities.

Click on Chart for Larger Image
About Ed Carlson:
He is the author of George Lindsay and the Art of Technical Analysis, and his new book,George Lindsay’s An Aid to Timing is an independent trader, consultant, and Chartered Market Technician (CMT) based in Seattle. Carlson manages the website Seattle Technical Advisors.com, where he publishes daily and weekly commentary. He spent twenty years as a stockbroker and holds an M.B.A. from Wichita State University.

Every day the stock market doesn’t break down, means the potential for an advance increases significantly. Thinking back to some of the best bull market rallies from 10/1 through year end – you have to prepare that the potential exists.
Talking about potential, let’s look at potential returns from here:

The above just takes the forward 1 month return based on the level of the barometer. So we’re in the 10% range. This is one reason we didn’t position for downside in our Stock Options Speculator service. Now we may position for upside and some calls on the next Buy Signal from the barometer.
But if stocks rally – who needs gold? I would expect gold to crash – significantly:

That being said, I’m not alone in that assertion:

As you know, I am not a big fan of being part of the crowd. So the potential for a rapid advance in gold also exists. We’re in gold puts, but if gold can hold these lows, I’d have no problem pocketing our profits (>100%) and trading the upside until the put buying resolves.
As for the barometer, we remain in Sell Mode, but the Qs have remained strong, holding on to the 50day.

Longer term though, we could see a flip in the nature of the market:

We’ll look at our longer term indicators over the coming weeks and months for a similar turn down in cumulative money flows and breadth – as this will be a sign that the underlying bullishness of the market has changed.
Regards,
Gold & Silver Portfolio Structure
The single most important thing responsible for growth of your portfolio on the long-term is diversification. We can’t stress enough just how important it is!
Summary
Although reading this long report is probably not an easy thing to do without a cup (or two) of your favorite coffee, you can rest assured that it will be worth it. According to most studies, the structure of one’s portfolio is responsible for at least 75% of the investment success in the long term. This means that even if your market timing skills are brilliant, you may still lose money on the long-term if you don’t pay enough attention to portfolio structuring.
In this report we show you how to structure your portfolio so that it:
- Limits risk,
- Provides significant upside potential and exposure to the great bull market in silver and gold,
- And takes into account key major factors that could come into play in the following years like a collapse of financial system, lack thereof, stable continuation of the bull market and a prolonged consolidation.
Additionally, you learn more about diversification and how it can be utilized on different levels of your portfolio. You also learn the advantages of semi-active portfolio management.
Finally, we discuss in detail how to combine signals from investment tools and analysts, and provide 3 sample portfolio structures for 3 different types of investors. (Emphasis mine – Editor Money Talks)
We encourage you to apply the rules outlined to your own portfolio at least partly. Please keep in mind that the more you care about your capital, the more it will be able to care for you and your goals when it is needed.
At Sunshine Profits, we’ll keep helping you grow your portfolio more predictably.
…..read the entire report HERE

 The mining sector got a big vote of confidence this week. From a high-profile backer.
At least in one part of the world.
That’s Australia. Where $7.9 billion private equity firm Denham Capital said it is launching a venture solely aimed at helping struggling firms in the minerals sector.
Denham will devote $200 million to the new vehicle. And then put that cash to work turning around under-performing assets in the mining world.
“It will be focused on improving and restoring the profitability of assets,” Denham’s managing director Bert Koth told local press.
Denham didn’t specify whether the venture will be in the form of an investment fund, or a corporate entity that will take direct control of assets. But either way, it appears that the main focus will be acquiring good assets that have been mismanaged. And helping to get them back on the right track.
Toward that end, Denham has reportedly already assembled a team of “turnaround” specialists from the mining business. With the group suggesting that much of the activity will involve re-engineering of projects in order to “eliminate every single redundant dollar in the cost structure”.
The approach indeed has some sense to it. With Denham’s management pointing out that many mining firms suffer from entrenched management who simply aren’t the right people for the job. Often being explorationists or developers who stay on after a project moves to a more advanced stage–when a team of engineering experts would probably be a more effective choice.
It will be interesting however, to see how many projects the firm identifies fitting their investment criteria. With many struggling mining projects simply being held back by mediocre geology, infrastructure or markets.
Watch for the first deals from the new venture, which will reportedly be launched in about four weeks. First targets apparently include “bulk minerals” (presumably coal and iron ore), along with base metals.
Here’s to pointing things in the right direction,
dforest@piercepoints.com / @piercepoints / Facebook


Good News, Bad News
An encouraging economic report was released Monday, which increased concerns about a sooner rather than later Fed rate hike. From Reuters:
Consumer spending rose 0.5 percent last month after being unchanged in July, the Commerce Department said. The growth in August was just above the median forecast in a Reuters poll of economists…Even after adjusting for inflation, spending was 0.5 percent higher, the biggest gain since March. Growth in personal income ticked up 0.3 percent, in line with forecasts.
Big Picture Deteriorating
This week’s stock market video shows while the bulls are still in control, their margin of error is getting quite thin as interest rate concerns increase.
1994 Fears Linger
With the Fed signaling “considerable time” may be removed from their policy statement in the coming months, market participants are concerned about a 1994-like event taking place in late 2014 or early 2015. From Businessweek:
The last time consumer-price increases were slowing before the Fed started increasing borrowing costs was in 1994…”The critical example for the markets is 1994, and that’s the thing that we all fear,” Gary Pollack, the New York-based head of fixed-income trading at Deutsche Bank AG’s private wealth management unit.
Investment Implications – The Weight Of The Evidence
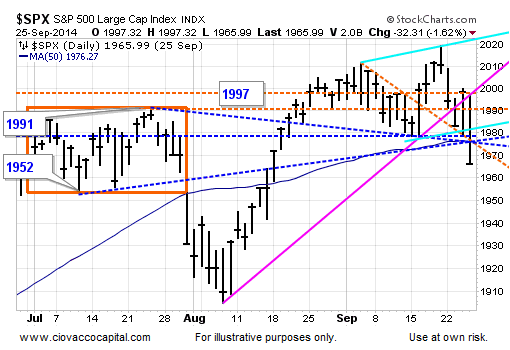
Our market model called for a reduction in our equity exposure last week based on evidence of waning economic and market confidence. As shown in the two weekly snapshots of the S&P 500 below, the market’s indecisiveness is starting to impact the intermediate-term trend in a negative manner.
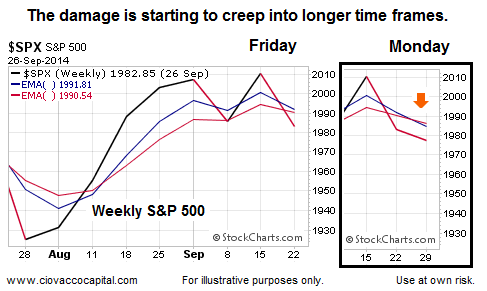
Since the look of a weekly chart is much more important at the end of the week, the bulls do have some time to repair the damage. Therefore, we will continue to hold a mix of stocks (SPY), leading sectors (XLV), bonds (TLT), and an offsetting position in cash until the evidence improves.
Two Big Reports Coming
If there was ever an economic report that could flip the bull/bear field, it would have to be the monthly employment report, which is coming this Friday. Wednesday brings the latest read on U.S. manufacturing activity.
….article from Sept. 26th:
Indecisiveness Means Higher Risk For Stocks
GDP Will Keep Fed Fears In Play
As we will demonstrate via charts below, the financial markets have been becoming increasingly concerned about the coming shift in Fed policy. Friday’s economic data reinforces the idea that the Fed has to begin raising rates soon given recent economic improvements:
From The Wall Street Journal:
The U.S. economy grew in the spring at the fastest pace since late 2011, another sign the recovery is accelerating after five years of sluggishness. The economy last grew at a 4.6% pace in the fourth quarter of 2011 and hasn’t exceeded that rate since the first three months of 2006.
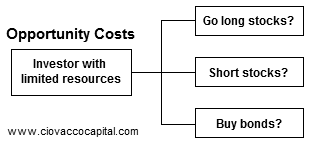
Investment Buckets
The million dollar question in 2014:
Is the economy strong enough for stocks to withstand higher interest rates?
The concept of investment buckets can help us monitor the risk related to a Fed-induced correction in stocks. In the 1990s, tech stocks were the place to be. After the dot-com bust, those who placed their money in bonds or shorted stocks did very well until October 2002. The winning asset class between late 2002 and October 2007 was stocks. History tells us picking the right asset class bucket is extremely important in the quest for satisfying investment returns.

Limited Capital To Allocate To Buckets
With central banks around the globe skewing the prices of stocks and bonds via artificially low interest rates, it has become more difficult to monitor risk and make allocation decisions.
Paying Attention Works
To gain a better understanding of how monitoring the markets can assist with investment risk management, consider the statement made above:
After the dot-com bust, those who placed their money in bonds or shorted stocks did very well until October 2002.
With the benefit of hindsight, the statement above seems obvious to anyone who lived through the 2000-2002 bear market in stocks. Was there a logical way to sidestep the painful losses experienced by stockholders (March 2000 – October 2002)?
Evidence Showed An Observable Shift
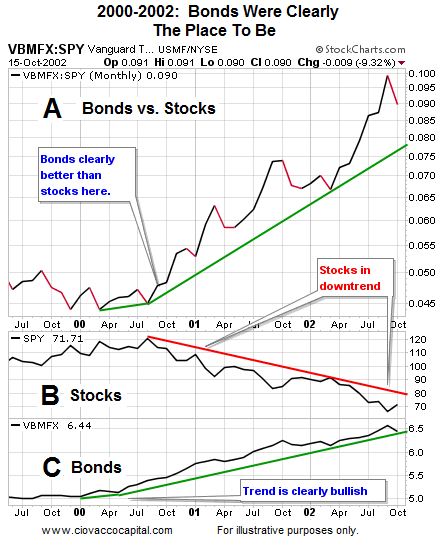
From a probability perspective, the answer is yes by simply paying attention to what was happening, rather than focusing on what might happen next. The charts below clearly identified a shift from “risk-on” to “risk-off” that occurred as the dot-com bubble was bursting.
In the second half of 2000, with the S&P 500 ETF (SPY) trading near $112, a clear and observable shift favoring bonds over stocks had taken place (see Section A below). After the charts said “bonds are a better place to be than stocks”, SPY dropped an additional 44% before hitting bottom at $63.14 in October 2002. Section A in the image below shows the performance of bonds (VBMFX) relative to the S&P 500. Section B is the S&P 500 in isolation. Section C is bonds in isolation.
What Are The Markets Telling Us Now?
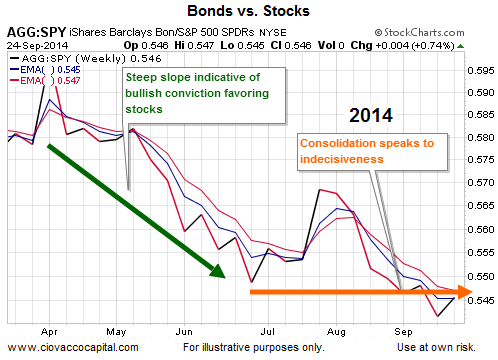
As we noted September 16, bullish momentum has slowed noticeably in recent weeks, which tells us to keep an open mind about further weakness in stocks. The chart below shows the weekly trends continue to favor stocks over bonds (AGG). However, the market is not as confident today as it was earlier this year (compare slopes of green and orange lines). The slope of the orange line indicates confusion about Fed policy, the economy, and the stock market’s ability to avoid a corrective episode.
Investment Implications – The Weight of The Evidence
Is the market’s indecisiveness related to the Fed particularly new? No, we outlined our concerns in more detail in this September 12 video clip, which made it easier to cut risk this week. During Thursday’s selloff in stocks, numerous forms of support were violated (see chart below).
Our market model allocates heavily to equities when the odds of success are favorable. With the break of support in the chart above, and given the market’s current bigger picture profile, the odds of success have shifted this week to mixed-to-unfavorable. Therefore, a lower allocation to stocks is prudent until things improve. We reduced our exposure to stocks three times between Tuesday and the end of Thursday’s session. We will enter Friday’s session with a flexible and open mind, but the market must prove it to us now.
Chris Ciovacco is the Chief Investment Officer for Ciovacco Capital Management, LLC.


-
I know Mike is a very solid investor and respect his opinions very much. So if he says pay attention to this or that - I will.
~ Dale G.
-
I've started managing my own investments so view Michael's site as a one-stop shop from which to get information and perspectives.
~ Dave E.
-
Michael offers easy reading, honest, common sense information that anyone can use in a practical manner.
~ der_al.
-
A sane voice in a scrambled investment world.
~ Ed R.
Inside Edge Pro Contributors

Greg Weldon

Josef Schachter

Tyler Bollhorn

Ryan Irvine

Paul Beattie

Martin Straith

Patrick Ceresna

Mark Leibovit

James Thorne

Victor Adair