


The Gold Report: Gold has been bouncing around $1,200 an ounce ($1,200/oz) for a while. Why?
Adrian Day: Until the dollar shot off like a rocket in July, gold had been up and down, perhaps disappointing some people. It closed the second quarter at significantly over $1,300/oz. Since then, both the euro and the yen have fallen and that has affected the price of gold. The concerns about tightening by the Federal Reserve are grossly overblown, however. The number one effect on the price of gold is the dollar.
TGR: Is there any hope on the horizon for the gold funds?
AD: Hope is not an investment strategy. But, yes, there are quantifiable reasons for hope. Number one, monetary policy around the world remains easy. The European Central Bank (ECB) is talking openly about instituting a quantitative easing (QE) policy. As you know, the ECB is prohibited from directly buying government sovereign bonds, which is the way that most central banks effect easing policies. The Federal Reserve buys treasury notes. The Bank of Japan buys Japanese government bonds and so on. The ECB is prohibited from doing that; it must use other means to pursue easing.
TGR: What did Japan do?
AD: The Bank of Japan is acting like a drunken sailor on a Friday night. It actually bought government bonds at negative interest rates, which is a first!
 In the United States, the Fed is going to end its tapering policy by eliminating $85 billion a month of bond buying. Nonetheless, monetary policy in the U.S. remains easy. Short-term real interest rates are negative. Recently, the Fed said that it expects real short-term interest rates to continue to be negative
through the end of 2015 at least. That is actually a strong bullish factor for gold. Technically, we came close to the support level around $1,180/oz. We have not yet broken through that support; this is the level from which gold has bounced three times in the last year.
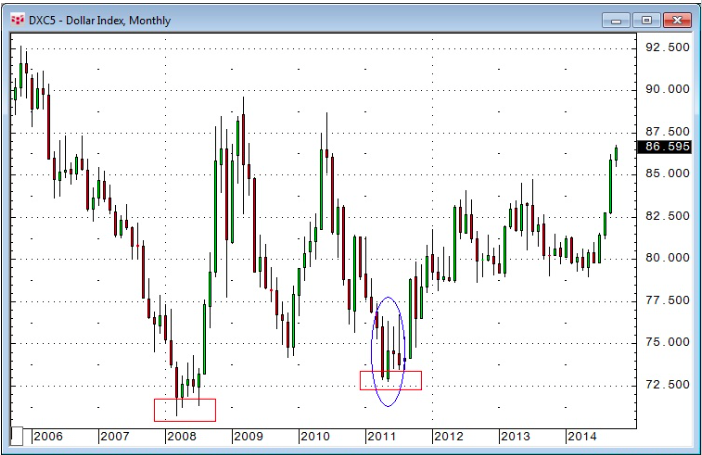
The main determent for the gold price at the moment is the dollar. I am not optimistic on a dollar drop in the near term. The dollar is fundamentally overvalued based on a purchasing power parity basis, which is the way most people value currencies. It is overvalued by as much as 20–30% against most of the Asian currencies. That means that the Asian currencies are undervalued.
Fundamentally the dollar needs to drop.
The irony here is that the geopolitical tensions that one would have expected to help gold have actually helped the dollar and, therefore, hurt gold. Physical demand for gold in China remains strong. Imports from Hong Kong have declined this year. At the same time, an increase in Shanghai Exchange deliveries has partly offset that. This year will be the best year on record for Chinese demand, other than 2013’s extraordinarily strong year. Indian demand has started to pick up again after the elections. Middle East buying has been extremely strong in recent weeks. In the rest of the world, outside of Western Europe and North America, physical demand is strong. Fundamentally, the gold market is quite strong.
The one big negative is the dollar.
TGR: As an investor in gold juniors, do you prefer explorers or producers?
AD: I like a combination. It is ironic that conservative investors go for the bigger, well-known names, but these are not necessarily the best names to buy. Gold mining is an incredibly tough business. It is made worse by the actions of governments, NGOs and environmentalists. But the majors are always in need of more gold.
 A large mining company, such as Barrick Gold Corp. (ABX:TSX; ABX:NYSE) or Newmont Mining Corp. (NEM:NYSE), mines 5 million ounces (5 Moz) a year. These companies need to find 5 Moz/year just to keep flat. That is not an easy task. During the last 25 years, there has been a sharp decline in the number of large gold discoveries. The senior companies were forced to acquire existing mines and companies. A couple of years ago, large firms were making really idiotic acquisitions at silly prices.
TGR: Why were they overpaying for non-economic mines?
AD: Spending on gold exploration has gone up eightfold since 2000, and yet the mines are not being found. Mining company executives are mentally no different from retail investors. Gold investors have a bias toward thinking that the price of gold is going up. No company wants to shrink. When gold went to $1,900/oz, mining companies believed that the gold price would only go higher. The thinking was this expensive mine is not economic now, but at $2,500/oz we will be looking for reserves. The mine will be profitable then. One should also point out that cheap money policies from the Federal Reserve, including ultra-low interest rates, facilitated these acquisitions.
 TGR: Have there been any good bargain juniors in the past few years?
AD: Pretium Resources Inc. (PVG:TSX; PVG:NYSE) has given us many good opportunities for profits. It’s a good buy again at $5/share. The market rewards discovery.
Reservoir Minerals Inc. (RMC:TSX.V) had a fantastic discovery two years ago in Serbia. Its stock price went from under $0.50 to $4.20 today.
Another great discovery success has been Virginia Mines Inc. (VGQ:TSX). Its first major discovery was the Éléonore, about nine years ago. Virginia Mines kept a royalty on Éléonore when it sold the mine to Goldcorp Inc. (G:TSX; GG:NYSE). That royalty drove Virginia’s stock price from $5 in 2009 to $13 today. That certainly bucked the trend!
TGR: What is driving Virginia Mines’ rise?
AD: Virginia Mines has strong, competent, honest and disciplined management and a very solid balance sheet. The company has kept around $40 million ($40M) in cash for the last several years. It does not have to go to the market for funds.
 That is a key thing to look for in a junior. Does it have enough money to carry out its plans? When will it need to go back to the market? If a company needs to go back to the market constantly, the stock price has trouble moving up because everybody knows there will be another offering soon. This was not the case with Virginia. The royalty on Éléonore will be very profitable over many years. You only had to listen to Goldcorp’s conference call every quarter to know how keen Goldcorp was on that property.
TGR: What is the outlook for Éléonore?
AD: Goldcorp has just poured its first gold at the mine. There will be a ramp up period of course. The current plan is for 600,000 oz/year for 17 years. Virginia’s royalty starts at 1.5%. Assuming the gold price stays where it is or moves up, by about year four, we expect Virginia to be getting a royalty at the 3.5% rate, which is a very attractive royalty.
TGR: What California-based projects are worth looking at?
AD: I have a fairly high tolerance for political risk when it comes to mining, but California is a risky jurisdiction and I avoid it. We do, however, like companies that happen to have properties in California. Vista Gold Corp.’s (VGZ:NYSE.MKT; VGZ:TSX) flagship property is Mt. Todd in Australia, which is excellent. But Vista also has a small project in California in the desert near Bishop. The market values that mine at zero. It is clearly worth more than zero, but that’s not the reason to buy Vista. I buy Vista because of its asset basis. The stock is trading at $0.37/share. That gives us a market cap of less than $35M. Adding up Vista’s assets on a reasonably conservative basis gives a multiple of $150M. On an active basis, Vista is remarkably inexpensive.
 TGR: What about mixed gold, silver and copper plays?
AD: Some of the best gold deposits are mixed deposits. Freeport-McMoRan Copper & Gold Inc. (FCX:NYSE) has the Grasberg project, which is the second largest gold mine in the world. Yet nobody thinks of Freeport as a gold company any more.
Almaden Minerals Ltd. (AMM:TSX; AAU:NYSE) has both gold and copper projects in Mexico.
TGR: What is the story with Almaden?
AD: Almaden’s managers are strong, honest folks. Duane and Morgan Poliquin run the company. Duane, the father, has several discoveries to his credit. The firm’s balance sheet is great. Almaden has about $13M in cash plus some gold bullion. And its business plan to function as both an explorer and a producer works.
A few years ago the Poliquins discovered the Ixtaca deposit in Mexico. The preliminary economic assessment (PEA) showed good economics. The major problem was the capital expenditure (capex), which was high for the size of the deposit. Since the PEA was issued, Almaden has continued to explore and build up the Ixtaca resource. The bigger the deposit, the more the capex can be spread over more ounces. Almaden is also working on bringing down the capital costs. Its amended PEA for Ixtaca already shows lower capex costs. The prefeasibility study should be out during the summer of next year. At $1.30 per share and a less than $100M market cap, Almaden is a good buy.
TGR: What other stable gold firms do you have on your plate?
AD: That depends what you mean by stable. Stable firms are different from stable stockprices. There are very few companies with a stable stock price at this time. I look for companies with solid balance sheets that do not need to keep raising money; that is at major risk from these current gold prices.
For stability, I like royalty companies, Franco-Nevada Corp. (FNV:TSX; FNV:NYSE) andRoyal Gold Inc. (RGLD:NASDAQ; RGL:TSX). Franco has a stronger balance sheet, a broader spread of revenue-producing properties, but both Franco-Nevada and Royal Gold are good, solid companies. Both are stable and available at good prices. Franco has $600M and no debt, after paying nearly $650M for a gold stream from the Candelaria copper mines. Its cash flow at the current price of gold is $400–450M a year.
In fact, none of its major producing royalties are at meaningful risk to the price of gold unless it were to drop under $900/oz. To me this is the definition of a stable gold company.
TGR: What else do you like for stability?
AD: Mandalay Resources Corp. (MND:TSX) has a producing mine in Australia and a well-advanced exploration project in Chile. Mandalay pays a 3.5% dividend, which people like.
Midland Exploration Inc. (MD:TSX.V) is a Québec explorer, a prospect generator. It has $5M in cash. Six of its projects are joint ventured. Due to a stable business plan, Midland can survive for a long time on $5M.
Riverside Resources Inc. (RRI:TSX.V) is another prospect generator. It has about $6M in cash, two strategic alliances and half a dozen joint ventures. Based on the business plan and the cash on hand, this company can continue to operate even if the price of gold stays low for a while.
TGR: What will it take to return gold to its golden days?
AD: First of all, let’s not forget where the price of gold was a decade ago: $250/oz. It has done very well to be “stuck” at $1,200/oz. The number one thing for gold is the dollar, particularly in the near term. The dollar has to turn. What is going to make that happen? Several Asian currencies are slowly, but steadily increasing in price. I do not see much increase from the euro or the yen, though.
The strong dollar is quite a headwind for the U.S. economy and for the Fed’s plans to slowly back out of QE. Several Fed officials are now expressing concern about the strength of the dollar. If we see several weak economic reports in the next few months, the Fed is going to make noises about continuing to ease. That would push the dollar down and push up the price of gold.
TGR: Thank you for your time, Adrian.
Adrian Day, London born and a graduate of the London School of Economics, heads the eponymous money management firm Adrian Day Asset Management, where he manages discretionary accounts in both global and resource areas. Day is also sub-adviser to the new EuroPacific Gold Fund (EPGFX). His latest book is “Investing in Resources: How to Profit from the Outsized Potential and Avoid the Risks.”
Read what other experts are saying about:
Want to read more Gold Report interviews like this? Sign up for our free e-newsletter, and you’ll learn when new articles have been published. To see recent interviews with industry analysts and commentators, visit our Streetwise Interviews page.
Related Articles
- From Beaver Creek to Denver: A Journey Between Different Worlds
- David Morgan’s Secret to Being Grateful, Even at $17 Silver
- The Best Offense Remains a Good Defense: M Partners’ Derek Macpherson
DISCLOSURE:
1) Peter Byrne conducted this interview for Streetwise Reports LLC, publisher of The Gold Report, The Energy Report, The Life Sciences Report and The Mining Report, and provides services to Streetwise Reports as an independent contractor. He owns, or his family owns, shares of the following companies mentioned in this interview: None.
2) Adrian Day: I own, or my family owns, shares of the following companies mentioned in this interview: Franco-Nevada Corp., Royal Gold Inc., Reservoir Minerals Inc., Midland Exploration Inc., Virginia Mines Inc., Freeport-McMoRan Copper & Gold Inc. and Goldcorp Inc. In addition, clients of Adrian Day Asset Management own shares in all companies mentioned herein. I personally am, or my family is, paid by the following companies mentioned in this interview: None. My company has a financial relationship with the following companies mentioned in this interview: None. I was not paid by Streetwise Reports for participating in this interview. Comments and opinions expressed are my own comments and opinions. I determined and had final say over what companies would be included in the interview based on my research, understanding of the sector and interview theme. I had the opportunity to review the interview for accuracy as of the date of the interview and am responsible for the content of the interview.
3) The following companies mentioned in the interview are sponsors of Streetwise Reports: Midland Exploration Inc., Mandalay Resources Corp., Vista Gold Corp., Almaden Minerals Ltd., Virginia Mines Inc. and Pretium Resources Inc. Franco-Nevada Corp. and Goldcorp Inc. are not affiliated with Streetwise Reports. Streetwise Reports does not accept stock in exchange for its services. The companies mentioned in this interview were not involved in any aspect of the interview preparation or post-interview editing so the expert can speak independently about the sector.
4) Interviews are edited for clarity. Streetwise Reports does not make editorial comments or change experts’ statements without their consent.
5) The interview does not constitute investment advice. Each reader is encouraged to consult with his or her individual financial professional and any action a reader takes as a result of information presented here is his or her own responsibility. By opening this page, each reader accepts and agrees to Streetwise Reports’ terms of use and full legal disclaimer.
6) From time to time, Streetwise Reports LLC and its directors, officers, employees or members of their families, as well as persons interviewed for articles and interviews on the site, may have a long or short position in securities mentioned. Directors, officers, employees or members of their families are prohibited from making purchases and/or sales of those securities in the open market or otherwise during the up-to-four-week interval from the time of the interview until after it publishes.


