
Bonds & Interest Rates
 Several banks who are friendly and not the wild trading types, reported to us before that the Federal Reserve officials were visiting them warning that they needed to change their models. Now the Fed is warning banks that they MUST do more to curb excessive risk-taking. They have also been warned about the bogus claims of “rogue” traders who amazingly lose billions and somehow management never knew. That claim is BOGUS, for anyone claiming that means that they bank should be shut down for it is incapable to risk management and should be barred from trading. So the Fed has again informed the banks that the have to now improve employee behavior at their firms or face stiff repercussions, including being broken into smaller pieces.
The bankers have come in second to politicians as the most untrusted profession. This time around we WILL see banks broken apart. The Fed will cover only deposits. There is no political stomach for another $1 trillion check to bail them out next time. Besides, next time would be 3 times as great as the last bailout. This seems to be the growth path that they are on with a MINIMUM 300% increase from one bailout to the next. However, our models are point to a Phase Transition in this statistic. That means we may see more than a 500% increase in losses next time around.
….more from Martin Armstrong:
Hedge Funds get Hit – Unable to See TIME – “Rich Man’s Panic of 2014″

In September 2014 Calgary and Toronto single family detached average prices hit new historical highs on Absorption Rates that are the highest among Canada’s 6 biggest cities. Look also at the total MLS sales across Canada which are projecting the biggest single year since the 2008-2009 plunge. It’s been a banner year for sales.
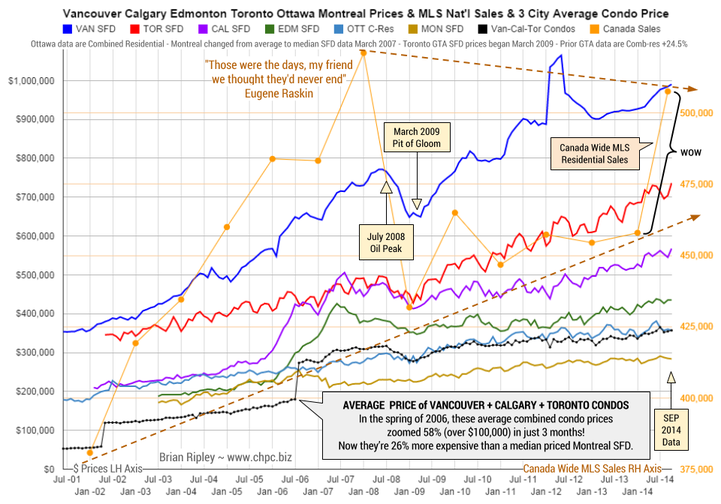
Click Chart twice for Larger View
The chart above shows the average detached housing prices for Vancouver, Calgary, Edmonton, Toronto, Ottawa* and Montréal* as well as the average of Vancouver, Calgary and Toronto condo (apartment) prices (Left Axis). On the right axis is the MLS Annual Total Residential Sales across Canada; the most recent data point being a projection to year end.
Meanwhile Edmonton, Ottawa and Montreal ticked down in their flat channels and Vancouver ticked up inside Bull Horse Mt.
It remains interesting to note that the combined average price of a Vancouver, Calgary & Toronto condo is currently 26% more expensive than a median priced Montreal SFD and note also that in the spring of 2006, those 3-City average condos zoomed 58% in price (over $100,000) in just 3 months as the buy side of the market freaked out over the inversion of the 10yr less the 2yr spread as it went negative (Yield Curve).
Mattress money has gushed into condos with no respect for fundamentals or plan for contingencies that may be required if Pit of Gloom II develops and one must write off capital gains and rely on employment earnings.
….related:
- 6 BIG METRO SALES & LISTINGS Total Residential
Vancouver, Calgary, Edmonton, Toronto, Ottawa & Montreal - MONTHLY ABSORPTION RATE & MONTHS of INVENTORY Vancouver, Calgary, Edmonton, Toronto, Ottawa & Montreal
- HOUSING STARTS since 1955 Canada, Quebec, Ontario, Alberta & BC
- VANCOUVER Housing Prices of Single Family Detached, Townhouse & Condos as well as total residential Sales and Inventory. The page also includes charts for the Deflator (prime area listings over-under $750,000) and Strata unit prices as a % of SFD prices and a 10 year comparison of increases in SFD prices and Family Income.
- BULL HORSE MOUNTAIN The Bull Trap that is Vancouver Housing; includes the Double Double chart.
- CALGARY Housing Prices of Single Family Detached, Townhouse & Condos as well as total residential Sales and Inventory. The page also includes charts for Strata unit prices as a % of SFD prices and a 10 year comparison of increases in SFD prices and Family Income.
- TORONTO Housing Prices of Single Family Detached, Townhouse & Condos as well as total residential Sales and Inventory. The page also includes charts for Strata unit prices as a % of SFD prices and a 10 year comparison of increases in SFD prices and Family Income.
- TORONTO COMPARED with VANCOUVER Single Family, Townhouse, Condo & Other Metrics including Absorption Rates and charts for Strata unit prices as a % of SFD prices and a 10 year comparison of increases in SFD prices and Family Income.
- HOUSING PRICE MOMENTUM Price Change Y/Y
Vancouver, Calgary, Toronto & TSX Real Estate Index - TSX INDEXES & Canadian Commodities Index
Real Estate, Gold, Energy, Financial Services & Commodities - MILLIONAIRE METRIC Vancouver, Calgary, Toronto SFDs & Cash Millionaires priced in Gold


 4 Lessons From Buffett That Every Investor Needs To Know
Behind each trade or investment, they are there… lurking, waiting to reveal themselves during a moment of weakness.
They are the four fears of investing.
I learned about these early into my trading career, and I’ve been a victim of each one over time. All drama aside, they affect every investor or trader who actively manages his or her own money.
In no particular order, the four fears are as follows:
1. Fear Of Loss
2. Fear Of Missing Out
3. Fear Of Letting A Profit Turn Into A Loss
4. Fear Of Being Wrong
Despite their prevalence, there are fortunately many methods to help conquer each of these fears. One of these tools comes from the long career and immortalized wisdom of the Oracle of Omaha himself.
While I can’t be 100% sure what Warren Buffett would say in regard to each of these problems, we can use his bank of interview quotes and newsletter excerpts to infer what the billionaire would say about understanding and conquering each problem.
 1. Fear Of Loss
I have seen the fear of loss paralyze and end more trading careers than I’d like to recall. When buying a stock, there’s an overwhelming chance you won’t pick the exact bottom, which means losing money before hopefully turning a profit. Taking risk and experiencing loss are part of the game.
This fear keeps many from executing a position in the first place. Alternatively, seeing your recent purchase fall can cause enough anxiety for an investor to exit their position and take quick losses. This is a quick way to nickel and dime your accounts.
Note that lacking this fear completely could be even more disastrous. Feeling immune to the fear of loss and ignoring stops can see an investment drop to $0 (or worse, if it’s a short position).
Buffett’s take: “Risk comes from not knowing what you’re doing.” “Time is the friend of the wonderful business, the enemy of the mediocre.”
Solution: Patience is key. Being patient before buying may make for a more comfortable entry and can give your trade enough room to grow — even if that means a missed opportunity. Always keep a realistic and appropriate stop-loss and commit to it. Keeping the quality of your trades high will limit this fear.
….read 2 thru 4 HERE
“Fear” blew out Wednesday (Oct 15) but not before investors realized that, “When markets are falling hard you have no idea how far down, down is.” They also learned what “lack of liquidity” feels like…and it feels awful…and certainly they learned that, “Risk Happens Fast!” All that, and the DJIA was only down ~8% top to bottom.
We’ve been “skeptical” of the stock market for months and have traded it from the short side…thinking that it had gone WAY too high too quickly without even a small correction…that it was WAY overdue for a break. After months of ultra-low volatility and record new highs Market Psychology had become enthusiastically “risk on”…and had become extremely vulnerable to a “shock”…it was indeed, as Mohammed Ali might have said, “Cruisin for a bruisin!”
In early September capital began to retreat from the more speculative “reaching for yield” type investments…it began to move from the periphery to the core…it began to concentrate in BIG CAP investments…which continued to rally and made All Time Highs on September 19…a date we believe was a Key Turn Date…a date when Market Psychology across asset classes registered a definite shift to “risk off”…and that shift intensified (!!!) over the next 4 weeks.
September 19 may well have marked the 2014 highs for the stock market. Bullish Market Psychology has been hit hard…and Fear showed up (Big Time!) for the first time in a long time. We’ve been expecting the market to roll over with “topping action”…price breaks and rallies…but no new highs…rather than to just “turn on a dime” and start down. We weren’t expecting the DJIA to drop nearly 1,500 points just for openers, but given that it has we would not be surprised to see it rally back 50% to 70% of that break…which would take it into the 16,600 to 16,900 range. We will be looking for an opportunity to get short if/when any “bounce back” rally runs out of gas. The harder trade will be to get short if there is no “bounce back” rally…to get short if the market just breaks lower from here.


The VIX (fear index) hit 3 year highs Wednesday…fell back…but still closed the week at 2 year highs.

Interest Rates: A mid-week panic drove Treasury prices sharply higher last week…while junk tumbled. As the panic subsided Treasuries fell back…but still closed at their best levels in over a year.

The nightly news is all about the drama in the stock markets…but the action in the credit markets may be far more important…junk bond issuers, who have feasted on cheap capital provided by “reaching for yield” investors may have to “pay up” for money in the future…and some “investment grade” issuers may get marked down to “speculative.”

Currencies: The CAD registered its lowest close in 5 years last week…the recent Big Break in Crude helped to drag it down. Note that the 2011 CAD high of 1.06 was made as the commodity indices topped out…and as the Bull Market in the US Dollar began.

The US Dollar Index closed lower for the 2nd week in a row…but it’s still very close to 4 year highs. We had a great run long the Dollar…we think it goes much higher over the next couple of years…we are looking for a spot to reestablish long positions. We realize that both the Fed and the Treasury are “concerned” about the effects of the Dollar’s rally. We believe that “currency wars” will intensify if global growth remains weak. We see capital “coming to America” for safety and opportunity…regardless of what American authorities may prefer.

Gold rallied almost $70 from its early October lows….creating a triple bottom on the charts…as Gold Bulls hoped that the stock market scare would inspire Central Banks to “keep printing.” The weaker US Dollar also gave gold a lift the past couple of weeks…BUT…we think King Dollar will prevail…and new lows lie ahead for gold.

WTI Crude briefly fell below $80 BBL last week…a 5 year low…while the Canadian benchmark…Western Canada Select…briefly traded below $70 BBL.
HUGE speculative long positions in Crude Oil (over 450,000 contracts…each for 1,000 BBL WTI) were accumulated as crude rallied to 3 year highs in June 2014. When prices began to fall in July we twice noted that the “unwinding” of these huge spec long positions would exacerbate the decline. We had been short WTI in May/June on the “supply/demand” story but were stopped out when prices rallied on the early ISIS successes in Iraq. We failed to reestablish our short positions as crude broke down…probably our worst trading blunder of the year!
At the last “count date” of October 14/14 the large spec long positions totaled ~280,000 contracts…down nearly 200,000 from the June highs. The total is probably lower today as prices dropped further on BIG volume Wednesday and Thursday. Crude may “bounce back” the next week or two IF Market Psychology across asset classes turns less fearful…BUT…if/when crude turns down again liquidation of “under-water” large spec long positions will add to the price decline.

WTI Option volatility hit record lows in June 2014 as prices hit 3 year highs (option volatility was ultra-low across all asset classes this past summer.) WTI option vol has nearly tripled from those lows…as bearish Market Psychology has intensified.

Short term trading:
Currencies: We were out of our long US Dollar positions by the end of September…we’d been long for months but thought that the Dollar had gone up too far too fast. We’ve been short commodity currency calls the past few weeks.
Stocks: We bought S+P puts on September 19 but covered (too early) after 2 weeks and then could not find a “comfortable” place to get re-establish bearish positions.
We looked at selling OTM puts on crude and the S+P late last week…it felt as though those markets “had to bounce”…and option premiums had sky-rocketed as FEAR drove the markets down… but we decided, “We don’t have to make this trade,” and just sat on the sidelines watching the show.
We look for the US Dollar to resume its rally and we will get long again. We think that assets that have run higher on central bank printing will fall and we will look to get short.
Longer term:
We wonder if September 19 will prove to be what George Soros would have called an “Inflection Point”…a point at which “the trend” changes. The BIG trend we are considering here is the Bullish Market Psychology trend…a trend wherein investors were blithely confident that Central Banks “had their backs”…a trend wherein credit spreads got narrower and narrower as desperate “reaching for yield” as investors plunged into questionable offerings…a trend wherein deeply indebted Eurozone countries “tried” to reign in their budget deficits…a trend wherein total outstanding debt grew and grew while global growth didn’t…despite all that “printing” from the Central Banks. For the past few years we’ve said that the “main driver” of Market Psychology was the anticipation of Central Bank actions…at the margin nothing else mattered. Something changed in September 2014…and it might have been the dawning of the realization that, “All of the King’s horses and all of the King’s men couldn’t put Humpty together again.”


-
I know Mike is a very solid investor and respect his opinions very much. So if he says pay attention to this or that - I will.
~ Dale G.
-
I've started managing my own investments so view Michael's site as a one-stop shop from which to get information and perspectives.
~ Dave E.
-
Michael offers easy reading, honest, common sense information that anyone can use in a practical manner.
~ der_al.
-
A sane voice in a scrambled investment world.
~ Ed R.
Inside Edge Pro Contributors

Greg Weldon

Josef Schachter

Tyler Bollhorn

Ryan Irvine

Paul Beattie

Martin Straith

Patrick Ceresna

Mark Leibovit

James Thorne

Victor Adair