

In September 2014 Calgary and Toronto single family detached average prices hit new historical highs on Absorption Rates that are the highest among Canada’s 6 biggest cities. Look also at the total MLS sales across Canada which are projecting the biggest single year since the 2008-2009 plunge. It’s been a banner year for sales.
Click Chart twice for Larger View
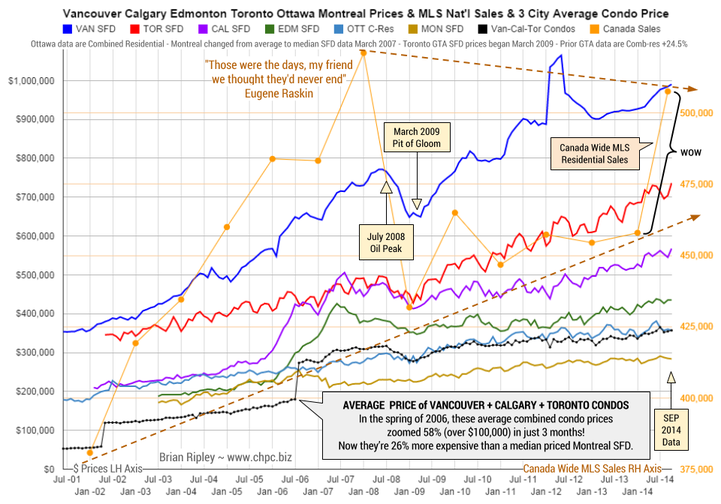
The chart above shows the average detached housing prices for Vancouver, Calgary, Edmonton, Toronto, Ottawa* and Montréal* as well as the average of Vancouver, Calgary and Toronto condo (apartment) prices (Left Axis). On the right axis is the MLS Annual Total Residential Sales across Canada; the most recent data point being a projection to year end.
Meanwhile Edmonton, Ottawa and Montreal ticked down in their flat channels and Vancouver ticked up inside Bull Horse Mt.
It remains interesting to note that the combined average price of a Vancouver, Calgary & Toronto condo is currently 26% more expensive than a median priced Montreal SFD and note also that in the spring of 2006, those 3-City average condos zoomed 58% in price (over $100,000) in just 3 months as the buy side of the market freaked out over the inversion of the 10yr less the 2yr spread as it went negative (Yield Curve).
Mattress money has gushed into condos with no respect for fundamentals or plan for contingencies that may be required if Pit of Gloom II develops and one must write off capital gains and rely on employment earnings.
….related:
- 6 BIG METRO SALES & LISTINGS Total Residential
Vancouver, Calgary, Edmonton, Toronto, Ottawa & Montreal - MONTHLY ABSORPTION RATE & MONTHS of INVENTORY Vancouver, Calgary, Edmonton, Toronto, Ottawa & Montreal
- HOUSING STARTS since 1955 Canada, Quebec, Ontario, Alberta & BC
- VANCOUVER Housing Prices of Single Family Detached, Townhouse & Condos as well as total residential Sales and Inventory. The page also includes charts for the Deflator (prime area listings over-under $750,000) and Strata unit prices as a % of SFD prices and a 10 year comparison of increases in SFD prices and Family Income.
- BULL HORSE MOUNTAIN The Bull Trap that is Vancouver Housing; includes the Double Double chart.
- CALGARY Housing Prices of Single Family Detached, Townhouse & Condos as well as total residential Sales and Inventory. The page also includes charts for Strata unit prices as a % of SFD prices and a 10 year comparison of increases in SFD prices and Family Income.
- TORONTO Housing Prices of Single Family Detached, Townhouse & Condos as well as total residential Sales and Inventory. The page also includes charts for Strata unit prices as a % of SFD prices and a 10 year comparison of increases in SFD prices and Family Income.
- TORONTO COMPARED with VANCOUVER Single Family, Townhouse, Condo & Other Metrics including Absorption Rates and charts for Strata unit prices as a % of SFD prices and a 10 year comparison of increases in SFD prices and Family Income.
- HOUSING PRICE MOMENTUM Price Change Y/Y
Vancouver, Calgary, Toronto & TSX Real Estate Index - TSX INDEXES & Canadian Commodities Index
Real Estate, Gold, Energy, Financial Services & Commodities - MILLIONAIRE METRIC Vancouver, Calgary, Toronto SFDs & Cash Millionaires priced in Gold


