
Stocks & Equities
 Americans spoke loudly and clearly at the polls this week, repudiating Obama’s and the Democrats’ failed big-government policies. This huge Republican victory has serious implications for the Fed and US stock markets. Republican lawmakers have long opposed this easy Fed, and they will put great pressure on it to normalize its balance sheet and interest rates. This is an ominous omen for these Fed-inflated stock markets.
Prior to Tuesday, the mainstream media dominated by Democratic sycophants did its best to downplay the American anger at Obama and the Democrats. There were endless reports about how awesome the US economy is, despite the fact most Americans aren’t feeling it in their pocketbooks. Recent Republican polling gains were ignored. Without honest coverage leading into the elections, the results seemed shocking.
In the critical Senate, the Republicans picked up at least 7 seats for a solid 52-seat majority. And 3 more are yet to be decided. And in the House, the Republicans won at least 16 seats for a strong majority of at least 243. And it could go as high as 249 when the recounts are done for the close races. This would give Republicans their largest majority in the House since 1928! Americans kicked out Democrats in droves.
Since Republicans are business-friendly and anti-regulation, traders saw their sweep as a major positive for the US stock markets. And there are all kinds of historic stats about how stock markets almost always rise after midterm elections. But the stock-market situation today is far from normal, with the major indexes at nominal record highs thanks to the big boost from the Fed’s unprecedented third quantitative-easing campaign.
Republican lawmakers have long opposed Fed inflation and easy money for several reasons. Interest rates are effectively the price of money. That should be neutral, not favoring savers or debtors. Interest rates should be set by free markets, not government decree, at a fair level that is mutually beneficial for both savers and debtors. The Fed’s zero-interest-rate policy has robbed savers blind to subsidize debtors’ binge.
The Bernanke Fed launched ZIRP in December 2008, and it was promised to be a temporary measurefor the stock-panic crisis. But here we are, nearly 6 years later with stock markets at record highs, and the Fed has kept rates at zero. The Fed has aggressively discouraged saving, even though that is what builds wealth and makes economies grow. Republican lawmakers want to end this asinine attack on savers.
The Fed’s easy money is also essential to “finance” Obama’s and the Democrats’ big government. The artificially-low interest rates ZIRP fostered have dramatically lowered the borrowing costs for the federal government. This has enabled the Obama Administration to go on the biggest debt-fueled spending spree in the history of the world. The government debt growth under Obama has been staggering, very scary.
Republican lawmakers want to bring back accountability and restraint to government spending. And the quickest way to force it is to normalize interest rates. If Treasury yields were back up near normal levels, the government’s interest expense would be far higher. That would make it far more difficult for debt growth to continue, imposing market discipline. Normalizing interest rates would dramatically slow Democrats’ overspending.
Finally, Republican lawmakers recognize the Fed is overtly political and pro-Democrat. Janet Yellen is a hardcore Democrat, all for big government. And back before the November 2012 elections that gave a second term to Obama, the Fed manipulated the markets into his favor. Just before those elections in September 2012, the Fed launched QE3. This goosed the stock markets in the critical final pre-election months.
The stock markets were topping and starting to roll over before the Fed birthed QE3. And the stock-market performance in September and October before presidential elections almost always decides them. In the 28 presidential elections since 1900 before that 2012 one, the stock markets rallied in September and October 16 times. The incumbent party won 15 of those 16 presidential elections, a stellar correlation.
And during the 12 times when stock markets fell in September and October before a presidential election, the incumbent party lost 10 times. This may sound surprising, but it makes perfect sense. The fortunes of the US stock markets dominate American sentiment, leading voters to feel better or worse about their political leaders. The Fed launching QE3 right before the 2012 election almost certainly gave Obama his victory.
So Republican lawmakers are openly hostile to this easy-money Fed that has robbed American savers, enabled the Democrats’ big-government spending binge, and even got Obama reelected despite him presiding over the worst US economy since the Great Depression. A Republican-dominated Congress is the worst nightmare for the Federal Reserve, and vastly limits the Fed’s ability to continue printing money.
Republican legislators are ready to make life a living hell for the Yellen Fed. They can drag Yellen before endless hearings, putting intense political pressure on her to normalize the Fed’s balance sheet and interest rates. They can vote for more Fed oversight, or even force the Fed to tie its interest-rate targets to hard mathematical metrics rather than the FOMC’s discretion. They could even threaten to revoke the Fed’s charter!
The Federal Reserve was created by an act of Congress 101 years ago, and it serves at the Congress’s pleasure. The Congress can kill it anytime, or impose any restrictions it wants. Sure, Obama can and will veto any aggressive anti-Fed legislation since he needs the Fed’s inflation to “pay for” the big-government spending that bribes Americans to vote Democrat. But Yellen will still be forced to tread very softly now.
Shackling this easy-money Fed has massive implications for the Fed-levitated US stock markets. For all kinds of fundamental, technical, and sentimental reasons based on over a century of market history, this cyclical stock bull was topping in late 2012. The bull was overvalued, overextended, at its secular-bear resistance, and euphoria was rampant. It was starting to roll over on schedule before the Fed hatched QE3.
Its third quantitative-easing campaign, which means creating new money out of thin air to buy bonds, was unprecedented on multiple fronts. Unlike QE1 and QE2, it was open-ended. The Fed didn’t announce an end date up front, and kept promising it could ramp up the QE3 debt monetizations if the stock markets started to flag. This created a Fed Put, a psychological backstop that kept traders aggressively buying stocks.
QE3 was also unprecedented in its direct monetization of US Treasuries, inflating away the Democrats’ excessive spending. QE1 had $300b of Treasury buying, QE2 had $600b of new Treasury buying, and QE3 weighed in at $790b by its recent end. The whole QE experiment since late 2008 has ballooned the Fed’s Treasury holdings by $1982b! That’s $2t of government spending that wouldn’t have otherwise happened.
Without this brazen Fed effort to artificially manipulate interest rates lower, the stock markets would look very different today. If bond yields weren’t so anomalously low, stock markets wouldn’t have soared on bond investors grudgingly giving up on that manipulated market to move capital into stocks to seek out some returns. And without that QE-fueled government spending, overall corporate profits would’ve been lower.
And with Republicans now running Congress, the QE era is definitely over. The Fed can’t risk launching QE4 to support stock markets when they inevitably start to swoon. The political backlash would be too great, threatening the Fed’s coveted independence or maybe even its very existence. Yellen’s hands are tied, she can’t further alienate a hostile Congress. So the Fed’s balance sheet is done growing through QE.
Curiously the euphoric stock bulls think these extraordinarily anomalous stock markets are normal and righteous. But nothing could be farther from the truth. As of this week, this latest cyclical stock bull in benchmark S&P 500 (SPX) terms was up 199.1% over 68 months. This is far beyond the average size and duration of mid-secular-bear cyclical bulls of a doubling over merely 35 months. Talk about overextended!
And healthy stock bulls see periodic corrections, selloffs greater than 10%, to rebalance sentiment and bleed off excess greed. These generally happen about once per year or so. But today’s stock markets have gone an astounding, and near-record, 37 months without a single correction-magnitude selloff! Without sentiment being rebalanced, greed has blossomed into extremely dangerous full-blown euphoria.
How did such a wildly-unprecedented market extreme come to pass? The Fed. QE3 convinced stock traders the Fed would quickly jump in and print money to arrest any stock-market selloff. So they quickly forgot about market history and cycles to buy, buy, buy no matter what. The Fed had their backs, so why bother selling ever? With the Fed printing money, couldn’t the stock markets only rise to the end of time?
While the cyclical bull between early 2009 and late 2012 was normal, everything since was an illusionthat was conjured by the Fed’s QE3 inflation. This chart shows the SPX superimposed over the Fed’s balance sheet, and is incredibly damning. Even before late 2012’s QE3 launch, the stock markets only rose when the Fed’s balance sheet was ramping up through debt monetization. Whenever it stalled, stocks sold off hard.
For more background on this chart, check out an essay I wrote a couple months ago. But basically it shows the Fed’s total balance sheet in orange, its Treasury holdings in red, and its mortgage-backed-securities holdings in yellow. Also shown are key dates in QE, when the Fed’s campaigns began, were expanded, and ended. The message of this chart is crystal-clear, without QE4 the stock markets are doomed.
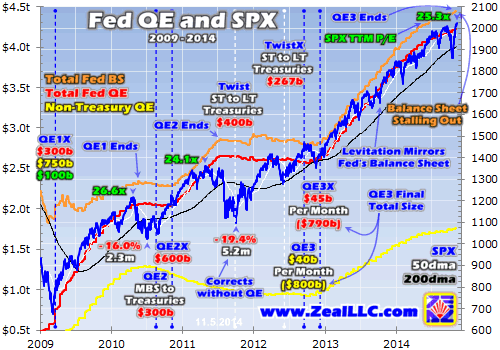
This mighty cyclical bull, one of the largest in history, has had two full-blown corrections. They happened in mid-2010 and mid-2011, and weighed in at 16.0% and 19.4% SPX declines in a matter of months. Note that the catalyst both times was the Fed’s balance-sheet growth stalling out when QE1 and QE2 ended! In both cases the stock markets didn’t start rallying again until the Fed announced more debt monetizations.
QE2’s birth ended the post-QE1 correction, and the so-called Operation Twist campaign of migrating the Fed’s Treasury holdings from short-term to long-term to manipulate long rates lower ended the post-QE2 correction. If the Fed hadn’t continued its radically unprecedented balance-sheet expansions, would either of those corrections ended where they did? No one knows, but we are about to find out I suspect.
Since late 2012 when the Fed goosed the stock markets with QE3 and gave the election to Obama, the growth rate in the Fed’s balance sheet has been unprecedented. Look at how steeply that orange line in this chart rises! And the correlation between it and the US stock markets is nearly perfect. As long as the Fed was aggressively printing new money to buy bonds, the stock markets soared on all this inflation.
The FOMC just ended QE3 in late October, and it ultimately weighed in at total monetizing of $1590b. This dwarfs QE2’s $600b of new buying, and challenges QE1’s staggering $1750b right after 2008’s big stock panic. In the first 8 months of 2008 before Bernanke launched ZIRP and QE, the Fed’s balance sheet averaged $875b. Today it is a jaw-dropping $4451b! QE has totaled nearly $3.6t, a staggering sum.
With QE3 over, the Fed’s balance sheet has stalled out and will soon start to shrink. This is happening at a time when stocks are near nominal record highs after an outsized bull market and trading at extremely high valuations. The simple average of the individual trailing-twelve-month price-to-earnings ratios of all 500 SPX stocks is now 25.3x. This is far above 14x historical fair value and nearing the 28x bubble level!
If everything beyond 1500 in the S&P 500 was the result of the Fed’s QE3 manipulations, what is going to happen to the stock markets with QE3 over and QE4 impossible politically? It isn’t going to be pretty. Absolute best case we are looking at a full-blown correction approaching 20%, which would drag the SPX back under 1625. And far more likely the overdue cyclical bear will arrive, ultimately cutting stocks in half.
The new Republican Congress won’t only pressure the Fed to normalize its balance sheet, but its interest rates too. In the quarter century between the early 1980s rate spike and 2008’s stock panic, the federal-funds rate the Fed directly controls averaged 5.3%. That’s far higher than today’s zero! Stock markets abhor rising rates, as bonds look relatively more attractive and therefore suck increasing capital out of the stock markets.
Coupling rising interest rates with the Fed’s soon-to-be-shrinking balance sheet greatly compounds risk for today’s stock markets. This would be a recipe for serious selling no matter when it happened. But at a time when the euphoric stock markets are at record highs after an overextended bull, haven’t experienced a single correction in several years, and are dangerously overvalued, the implications couldn’t be more ominous.
And almost certainly the Republican lawmakers’ righteous disdain for this easy-money Fed will not lapse merely because the stock markets sell off. America needs to get back on an even keel financially, to stop the Obama Administration’s debt binge and restore normal interest rates. Republicans aren’t going to betray their fiscally-conservative convictions to encourage QE4 no matter how low the stock markets go.
And they may not even care due to political calculus! Obama is still in charge for the next two years, and if the stock markets suffer a new cyclical bear between now and the 2016 elections the voters will put the blame squarely on his shoulders. Weaker stock markets actually increase the odds a Republican will win the presidency in 2016! And there’s nothing Republicans want more than one of our own in that high office.
So contrary to euphoric stock traders’ belief that the massive Republican victory this week will prove great for stock markets, just the opposite is likely true. The artificial Fed-spawned levitation of stocks over the past couple years or so is doomed without more QE. And the Republican Congress makes it far too risky for the Fed to push its luck with QE4. This will make for tough sledding for the SPX and all its derivatives.
And it’s not just SPX ETFs like SPY at risk, but the entire stock markets. As the general stock markets sell off on the Fed’s QE backstop vanishing, nearly all stocks will be dragged lower in the carnage. The one sector that thrives when stock markets are selling off is gold, as demand for alternative investments surges when conventional ones are struggling. Gold is a proven stock-bear-market performer, with great upside.
With more QE politically impossible, investors and speculators alike need to prepare for a much different stock-market environment going forward. It’s absolutely essential to cultivate contrarian thought and trading philosophies when the stock markets are overdue for a major selloff. Contrarianism is all about fighting the crowd, buying low when few others will then later selling high when everyone gets excited.
At Zeal we’ve been walking this contrarian walk for well over a decade. We publish acclaimed weekly and monthly subscription newsletters that help investors and speculators successfully navigate these markets. They draw on our decades of hard-won experience, knowledge, wisdom, and ongoing research to explain what is happening in the markets, why, and how to trade them with specific stocks. Subscribe today, as big market changes are afoot.
The bottom line is the massive Republican Congressional victory is not bullish for these overextended and overvalued Fed-levitated stock markets. The Republican lawmakers are going to put tremendous pressure on the Fed to normalize its bloated balance sheet and horrible zero-interest-rate policy. The Fed serves at the pleasure of Congress, and can’t risk infuriating it to launch a QE4 to rescue stock markets.
Thus the overdue major selloff is still imminent. At very best it will be a full-blown 20% correction, but far more likely is a 50% cyclical bear market unfolding over a couple years. The markets are forever cyclical, and bears always follow bulls. With the Yellen easy-money Fed’s hands now tied, the implied backstop that temporarily delayed that down cycle has vanished. It’s time for these Fed-inflated stock markets to pay the piper.

Without a doubt, Oct was the worst month for oil bulls since May 2012. In the previous month, the commodity lost over 11% as the combination of a stronger greenback, rising supplies and weaker demand weighted on the price. Additionally, the first days of the new month have been very negative for oil investors. After the breakdown below the psychologically important barrier of $80, oil bears pushed the price lower and light crude hit a four-year low of $75.84, breaking under long-term support lines. In this way, the commodity posted its sixth weekly loss in a row. Will light crude drop any further in the nearest future? Is it possible that crude oil’s ratios will give us some interesting clues? (charts courtesy of http://stockcharts.com)


The selloff in precious metals intensified over the past week. GDXJ declined 25% in seven days while Gold plunged below $1180 to $1140 and Silver plunged below $16 and to as low as $15.20. Precious metals are becoming extremely oversold and the bear market is clearly in the 9th inning. Be on alert for a snapback rally to repair the extreme oversold conditions. Although we are likely very close to the bottom in the miners, Gold’s current position continues to leave me skeptical.
Below is the updated bear analog for Gold which uses weekly data. Gold has yet to suffer the extreme selling experienced by Silver and the mining stocks. It makes sense given that Gold peaked months after those assets. The chart illustrates how bear markets are a function of price and time. The most severe bears in price are the shortest in time while the longest bears in terms of time are the least severe in terms of price. This bear falls in between. Given that Gold went 10 years without a real bear market it makes sense that this bear could bottom very close to the 1983-1985 and 1975-1976 bears but will have lasted quite a bit longer.
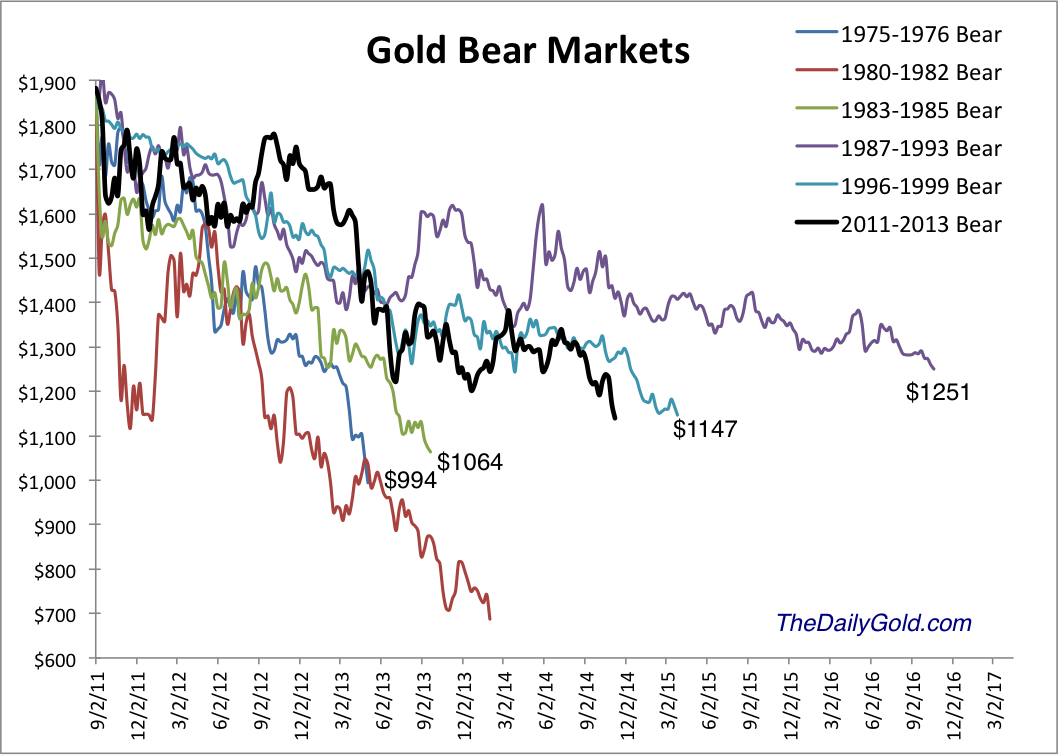
Click Image for Larger View
With respect to Gold, another point to consider is the strong supports at $1080/oz (50% retracement of the bull market) as well as $1000/oz. These downside targets continue to align well with the history depicted in the bear analog chart. Moreover, the fact that Gold currently sits well above these support levels is reason to expect more downside.
Silver on the other hand figures not to have the same degree of downside. Silver’s bear began five months before Gold’s and the bear analog below makes a strong case that the current bear will end very soon. Other than the epic collapse from 1980-1982, the current bear is the worst ever for Silver in terms of price and is the third worst in terms of time.
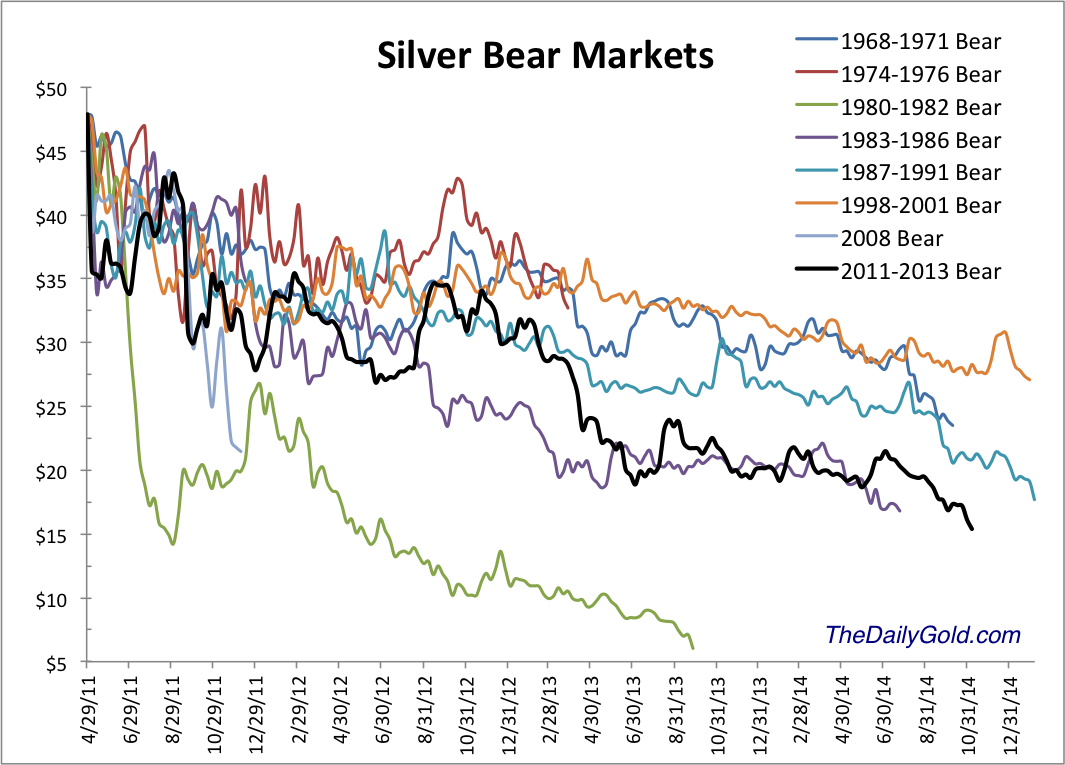
Click Image for Larger View
Similar to Silver, the mining stocks which led the bear market are moving from very oversold to extremely oversold. The HUI Gold Bugs Index, shown below closed Wednesday at an 11-year low. As far as the HUI’s distance from its 50 and 200-day moving averages, it is inches from major extremes. Over the past 50 days the HUI has declined 36.4%. That is the second worst performance over the past 20 years. The picture is even worse for the junior mining sector. GDXJ has declined 43% over the past 50 days. It is trading at the lowest level relative to its 50-day moving average since the creation of the ETF.
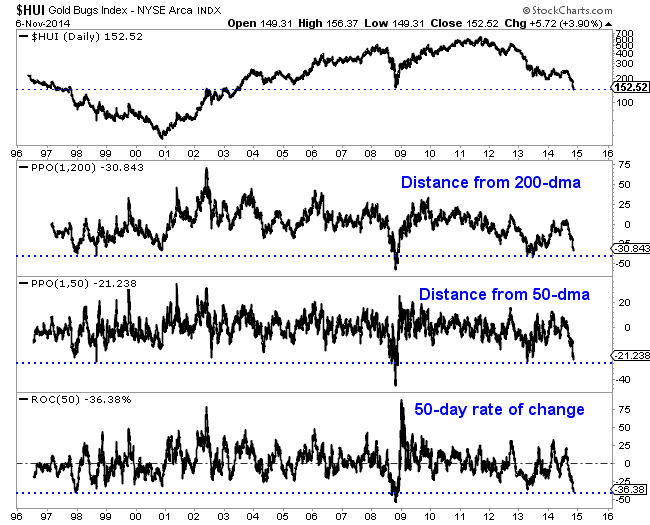
The worst bear market ever for the gold stocks was the more than four and a half year decline following the junior bubble in 1996. That bear did have a 14 month long respite where the indices rallied as much as much as 70% and 80%. That rally was longer and much larger than the one experienced recently. During the 1996-2000 bear, the GDM index (forerunner to GDX) declined 77.5%. Through Wednesday it was down 76%. The XAU declined 72.5%. Through Wednesday the XAU was off 74.2%. The Barron’s Gold Mining Index declined 75% during the late 1990s bear. Through last week it was down 68%.
The mining stocks and Silver are obviously extremely oversold and very close to the bottom. It could happen any day or any week. However, I’m skeptical because Gold is currently trading so far above its potential bottom. Sure, Gold figures to be the last to bottom but my view is the window for a bottom in the stocks could come when Gold declines below $1080. That being said, we could definitely see a snapback rally of some sort. The mining stocks and Silver are extremely oversold and could pop higher in the short-term.
In any event, the bear market is very close to its end. The weeks and months ahead figure to be very enticing and exciting for precious metals traders and investors. Expect quite a bit of volatilty as we see some forced liquidation from longtime bulls and as the sector tries to carve out a major bottom. Opportunities are fast approaching so pay attention. Be patient but be disciplined. As winter beckons, we could be looking at a lifetime buying opportunity. I am working hard to prepare subscribers. Consider learning more about our premium service including a report on our top 5 stocks to buy at the coming bottom.
Good Luck!
Jordan Roy-Byrne, CMT
Central Planners Are In A State of Panic
Japan’s black swan flaps its wings

(What this REALLY Means & What To Do About It MT/Ed)
The central planners are in a state of fear and panic. They are trying everything and anything to create market validation for their policies, watching with trepidation as their favored economic metrics fail to respond to all of their frenzied efforts.
They are so far over the tips of their skis right now that there’s nothing they won’t do. They’ve summarily thrown granny under the bus because they have this idea that negative real interest rates are the cure. The cure for what? The massive amounts of debts and imbalances their prior policies caused. So savers are punished in the pursuit of policy. You know, ‘for the greater good’ and all that.
They’ve spurred the greatest wealth gap ever in US history, greater even than at the extremes of the Great Depression, apparently without the slightest concerns for Plutarch’s ancient admonition that “An imbalance between rich and poor is the oldest and most fatal ailment of all republics.”
They’ve even gone so far in Europe as to now force negative nominal interest rates on savers, dispensing with their usual slight-of-hand of letting inflation steal from each unit of currency in their system. When you’re panicking, there’s no time for subtlety.
They look the other way as “someone” dumps huge amounts of gold contracts into the wee hours of the night, seeking one thing and one thing only: lower prices. But that’s okay because the central banks destroyed price discovery a long, long time ago. First by invalidating the price of money itself (by driving interest rates to zero), and then in everything else — most importantly risk.
The Federal Reserve, the Bank of Japan (BOJ), and the ECB have decided that they want you to take your money out of your bank account and place it into the stock market. Apparently they have models that say this is a good thing. Or they just want you to spend it. And to be sure that you follow their wishes, they don’t leave you any better options — and so virtually every hard asset has been targeted for price suppression. Except real estate because, hey, you have to borrow a lot of money from the banks for that, so they encourage and cheer your participation there.
In short,
everything the central planners have tried has failed to bring widespread prosperity and has instead concentrated it dangerously at the top. Whether by coincidence or conspiracy, every possible escape hatch for 99.5% of the people has been welded shut. We are all captives in a dysfunctional system of money, run by a few for the few, and it is headed for complete disaster.
To understand why, in all its terrible and fascinating glory, we need look no further than Japan.
A Black Swan Flaps Its Wings
Back in 2012, Japan was my favorite candidate to be the black swan of the year — meaning it could shock everyone and flip our reality to a new state. Of course, this has taken longer to play out than I initially thought.
However, here in November 2014, the world finally seems to be on the verge of waking up to the inevitable financial disaster that stalks Japan.
Japan is really in no better or worse shape than the rest of the developed world. But is a few chapters further along in the story, which means it holds both explanatory and predictive power for most of the developed nations. This is why we should study it closely.
The mystery, as always, is how so many participants are willing to pretend all is normal with Japan; merrily buying and holding Japanese yen and government debt instruments.
In a nutshell, every single monetary, economic, fiscal and demographic trend is working against the very goals that the Bank of Japan, in cahoots with the Japanese government, is trying to attain.
To make this clear, first, we’re going to sketch the outlines of predicament and then, next, examine what will happen when it all finally breaks down.
The Halloween Massacre
On Friday, October 31 2014 the Bank of Japan (BOJ) made a surprise announcement of a major new policy move that was specifically targeted to have maximum impact on the markets.
But it wasn’t a unanimous or popular decision:

The announcement specifically was that the BOJ would increase its purchases of Japanese government bonds to 80 trillion yen (up from 60 – 70 trillion) and triple its purchases of stock funds to 3 trillion yen annually.
You have to love the coded phrase used in the above article — “gave a lift to its fight against deflation” — which decoded means “they partially wrecked the yen which makes import prices go up (and which is not the same thing as the inflation they seek).” When you wreck your currency, all you do is steal purchasing power from savers and transfer it somewhere else, in this case to those most indebted and/or leveraged — the biggest of these beneficiaries being the Japanese government and large speculators.
Also the 5-4 decision is quite telling. It indicates that this bold — or reckless — policy (depending on your point of view), is already not very popular, suggesting that it’s more of a last desperate. Patience is wearing thin.
While some still question whether the US Federal Reserve is monkeying about directly in US equity markets, there is no such uncertainty with the BOJ: it openly buys equities under the pretense that a rising equity market is somehow good for the Japanese economy. This is a rather indefensible view, because the relative elevation of the Nikkei has nothing to do with how the economy will perform, as it’s a derivative of the economy (or is supposed to be) not a driver of the economy.
After all, once a stock has been launched into the stock market, all that happens when a stock moves up and down is that money flows from one set of trading accounts to some others as people buy and sell. By buying equities, the BOJ has effectively said it wishes transfer an even greater amount of money from its accounts to others.
It’s merely a gift to current holders of Japanese equities, which is a subset of the Japan population. Again not a terribly defensible, rational or fair policy. But there you have it.
Immediately on the news of this next round of wealth transfers and money printing, the Nikkei index leapt 1700 points and the yen plunged:

The virtual lockstep nature of the falling yen and rising Nikkei tell us that we are living in an age of massive and rampant speculation where financial markets react in concert to the newly-unleashed liquidity floods.
All that matters in today’s “markets” is how much more money the central banks are going to throw into the system. That’s all the gigantic speculators care about, and fundamentals and long-range issues are not even remotely near the top of their list of important trading variables.
Unfortunately, like most market moves these days, the recent plunge in the yen and the rise in the Nikkei provide few useful clues as to Japan’s actual current and/or future economic prospects.
What This Really Means
Okay, it’s time to face some unpleasant facts. Ignoring the market gyrations because those have pretty much lost all of their true signaling capabilities, the most recent move by BOJ governor Kuroda smacks of sheer desperation.
It’s important for all of us frogs sitting in this nice pot to recall that even five years ago such a move by the BOJ would have been utterly shocking. It would have commanded our thoughts and actions for weeks to come. But today, like the rest of the world, I’ll bet you’ve already lost it into the din of other accelerating events barely a week later.
That Kuroda, just one man, can bet so much on an untested and radical experiment is mind-boggling. If he succeeds, he gets to claim honor and success. If he fails he ruins the 3rd largest sovereign economy in the world, along with its inhabitants’ future dreams, for a very long time. How can such power be entrusted to a single person?
Unfortunately, this gamble cannot succeed over the long haul, and he has to know this. So perhaps he’s simply focused on keeping things hanging together until he leaves office.
Here’s how the ever-colorful David Stockman described the Halloween Massacre:

Yes, my fellow frogs who share this increasingly warm bath with me, Kuroda’s move is pure madness. The BOJ has jumped the monetary shark and we need to keep that firmly in view as we make our decisions about where all of this is headed, and how likely it is to create a future financial accident of global and unprecedented proportions.
Bloomberg’s Willaim Pesek described it this way, and I think quite accurately:

If I lived in Japan, I would, under no circumstances, ever keep my money in yen. If you live there, get out of yen as much as you possibly can. Your central bank has said it wants to destroy the yen and their actions confirm this so they are apparently quite serious about doing exactly that.
Imagine if the Federal Reserve was monetizing $3 trillion a year, which pencils out to some $250 billion a month(!). A proportional amount of money is being dumped into the Japanese financial system under the new policy.
And so naturally, stocks rose and the yen fell, which makes some (twisted) sense. But gold fell heavily on the news, which makes no sense at all from a fundamental standpoint. However, it makes all the sense in the world if you understand that extreme central bank policies cannot tolerate even the slightest whiff of challenge.
Rising gold prices would signal doubts about the central banks’ course of action. Conversely a falling gold price signals utter faith in the central planners. And so a falling gold price is what we get (but true demand for gold and silver demand another matter entirely).
The reason for all of this extreme central bank panicking and fear, we’re told, is because Kuroda has a white whale he seeks, which has ‘2% inflation’ stenciled on its side.
But inflation is not what central banks actually seek, even though the press consistently tells us that’s what they want. Inflation is not a cure for anything and the banks know it (and our press really should know it by now, too).
Instead what the central banks desperately want, and know the banking system and over-extended governments need, is negative real interest rates. That is, they want to force upon savers the condition where their saved money is getting a lower rate of interest than the rate of inflation, which is what we mean by a negative realreturn.
We wrote about this extensively as a process in this article about the Fed purposely attacking savers. But the mechanism and rationale is the very same for the BOJ as it is for the Fed..
Briefly, when running this program of financial repression the BOJ (and the Fed, et al.) do not care if inflation is 6% and bonds are 4%, or if inflation is 2% and bonds are 0%, as both offer negative real interest rates. Negative real rates serve to confiscate purchasing power from the general population and transfer it to other parties. Those parties include the big banks. But perhaps that’s just another happy coincidence in the game that central banks and bankers like to play with us which they call ‘heads we win, tails you lose.’
But let’s not be fooled. By the time a central bank Is behaving as recklessly as Japan, it’s time to edge towards the exit, because the chance of a flash fire in the building has grown uncomfortably high. That is, instead of providing comfort, these most recent moves should invoke greater worry for those of us alert enough to see them for what they are: acts of panic.
There’s just no other way to interpret the equivalent of $3 trillion of thin-air money besides an overt act of desperation. No, things are not okay. Yes, the risks for a disaster are growing.
Whether we call this the largest bond bubble in history, “reckless”, “mad” or “insane”, Japan has truly jumped the monetary shark. There’s no way back and no way forwards that will be pain-free and this terrifies the BOJ. The best advice I have is that when you see your central bank panic, you should panic too and avoid the rush.
In Part 2: What Will Happen When Japan Breaks, we delve into the only questions that really matter: When will it happen? And how deeply painful will it be?
And last, but certainly not least: How much of the rest of the world’s financial system will come crashing down with Japan’s because they are all so interlinked now?
Click here to access Part 2 of this report (free executive summary; enrollment required for full access)
When the tech and real estate bubbles burst, many of my friends lost 40-50% of their retirement portfolios almost overnight. Is a similar downturn looming?
Take a look at the chart below showing the S&P’s performance since 2008.
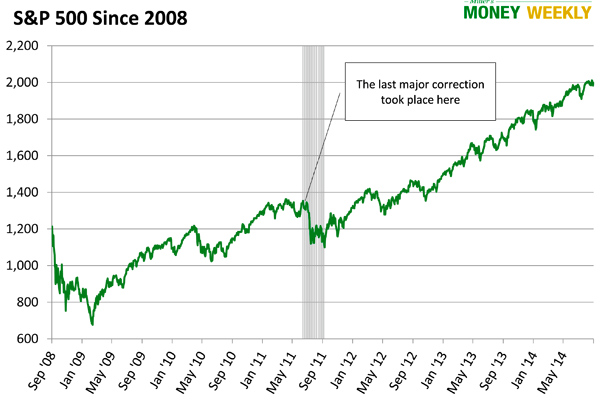
Caution is in order. We may see a major correction, a huge downturn, or this bubble could continue to grow for quite some time. I’ll leave the timing predictions to others. Still, investor euphoria worries me. Even those playing with retirement money often ignore warning signs, thinking the parabolic rise in stock prices is never going to end. However, this time is NOT different.
Look at the Nasdaq’s performance just before the tech bubble crash:
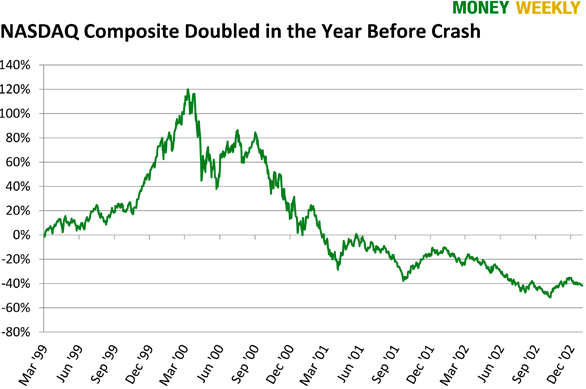
From March of 1999 to March of 2000, the Nasdaq doubled, and investors were euphoric. Are you feeling that euphoria today?
Don’t Let the Next Downturn Make You Poor
The goal for a retirement portfolio is to create enough of an income stream that you can maintain your current lifestyle over the long haul while the balance grows ahead of inflation. This portfolio should also include enough safety measures to keep you whole regardless of what the market does.
Sounds simple, but it can feel like walking and chewing gum—to the power of 10. Treasuries are supposedly safe… but from what? Sure, you won’t lose your principal, but they won’t protect you from inflation. Certain stocks are solid; after all, many companies survived the Great Depression… but will they keep paying dividends when you need them? Investing in a turbulent market is a gyroscopic balancing act with endless variables.
4 Lifejackets
While outlining the entire Miller’s Money safety system is beyond our scope here, there are four must-do safety measures anyone can easily implement.
#1—Set strict position limits. No single investment should make up more than 5% of your overall portfolio. That means rebalancing at least once a year. I have a friend who brags about how well his portfolio has been doing. Turns out, 80% of his holdings are in Apple. While Apple is a fine company and has done well, he should consider locking up most of his gain and focusing on capital preservation.
#2—Use trailing stop losses. We recommend setting trailing stop losses at 20% or less on all market investments. Stop losses can prevent catastrophic damage to your portfolio. As our portfolio grows, a trailing stop can help lock in a gain. While you may still face setbacks from time to time, a trailing stop limits them. You’ll live to fight another day.
I’ve spoken to some retirement investors who limit each holding to 4% of their portfolio and set 25% trailing stops. Whatever makes sense! Just limit the size of each position—and in doing so the potential for catastrophe.
#3—Diversification is the name of the game. This means internationalizing, too. Holding 5-6 mutual funds all in the United States or in US dollars just won’t cut it. You must diversify into non-correlated assets all over the world; so, should one segment or market tank, it won’t bring down a major portion of your portfolio.
You should also review the correlation of the asset you’re considering. What events in the market will cause the price to rise and fall? And pay particular attention to the near term. For example, until recently, utility stocks were considered the gold standard for retirees. Now there is so much capital in this sector, the stocks are correlating much closer to changes in interest rates.
Look for assets that are either uncorrelated to the market or those which may move in the opposite direction (the market goes down, this goes up, and vice versa).
Again, the game is: hold on to as much capital as possible and live to fight another day.
#4—Look for low duration on income investments. Bond sellers tout the safety of US government and investment-grade bonds. They are correct as far as default is concerned; however, a sudden rise in interest rates would mean a large loss for an investor holding these bonds who resells them in the aftermarket.
Retirement investors normally hold bonds for interest income, and they hold them until maturity. While some say bonds are still a good investment, most of these folks are traders. They buy high duration bonds (their market price moves significantly with changes in interest rates), betting on interest rates continuing to decline, and plan to sell for a profit down the road. We are not traders or market timers. Unless you are comfortable holding a bond until maturity, stay away from it.
When you invest money earmarked for retirement, using models that were in vogue as recently as 10 years ago will leave you vulnerable. Whether you’re considering bonds, utilities or any other investment vehicle, having the most up-to-date information is imperative. You can learn more about where bonds fit—or don’t fit—in your retirement plan by downloading our timely and free special report, Bond Basics, today. Access your complimentary copy here.


-
I know Mike is a very solid investor and respect his opinions very much. So if he says pay attention to this or that - I will.
~ Dale G.
-
I've started managing my own investments so view Michael's site as a one-stop shop from which to get information and perspectives.
~ Dave E.
-
Michael offers easy reading, honest, common sense information that anyone can use in a practical manner.
~ der_al.
-
A sane voice in a scrambled investment world.
~ Ed R.
Inside Edge Pro Contributors

Greg Weldon

Josef Schachter

Tyler Bollhorn

Ryan Irvine

Paul Beattie

Martin Straith

Patrick Ceresna

Mark Leibovit

James Thorne

Victor Adair