
Bonds & Interest Rates
 As Japanese Prime Minster Shinzo Abe has turned his country into a petri dish of Keynesian ideas, the trajectory of Japan’s economy has much to teach us about the wisdom of those policies. And although the warning sirens are blasting at the highest volumes imaginable, few economists can hear the alarm. (A longer version of this article can be found in Euro Pacific Capital’s Global Investor Newsletter.)
Although the Japanese economy has been in paralysis for more than 20 years, things have gotten worse since December 2012 when Abe began his radical surgery.. From the start, his primary goal has been to weaken the yen and create inflation. On that front, he has been a success. The yen has fallen 23% against the dollar and core inflation, which was running slightly negative in 2012, has now been “successfully” pushed up to 3.1% according to the Statistics Bureau of Japan.
But there is no great mystery or difficulty in creating inflation or cheapening currency. All that is needed is the ability to debase coined currency, print paper money or, as is the case of our modern age, create credit electronically. These “successes” should not come as a surprise when one considers the relative size of Abe’s QE program. For much of the past two years the Bank of Japan (BoJ) has purchased about 7 trillion yen per month of Japanese government bonds, which is the equivalent of about $65 billion U.S. [Forbes 9/24/14, Charles Sizemore] While this is smaller than the $85 billion per month that the Federal Reserve purchased during the 12-month peak of our QE program, it is much larger in relative terms.
The U.S. has roughly 2.5 times more people than Japan. Based on this multiplier, the Japanese QE program equates to $162.5 billion, or 91% larger than the Fed’s program at its height. But, according to IMF estimates, the U.S. GDP is 3.3 times larger than Japan. Based on that multiplier, Japanese QE equates to $214.5 billion per month, or 152% larger. And unlike the Federal Reserve, the Bank of Japan hasn’t even paid any lip service to the idea that its QE program will be scaled back any time soon, let alone wound down.
In fact, Abe’s promises to do more were spectacularly realized in a surprise move on October 31 when the BoJ, claiming “a critical moment” in its fight against deflation, announced a major expansion of its stimulus campaign. (The fact that official inflation is currently north of 3% – a multi-year high, seems to not matter at all.)
At the same time the BoJ also announced its intention to roughly triple its pace of its equity and property purchases on Japan’s stock market. According to Nikkei’s Asian Review (9/23/14), the BoJ now holds an estimated 7 trillion yen portfolio of Japanese stock and real estate ETFs. Even Janet Yellen has yet to cross that Rubicon.
And what has this financial shock and awe actually achieved, other than 3% inflation, a weaker yen, a stock market rally, and continued international praise for Abe? Well, unfortunately nothing other than a bona fide recession and a growing threat of stagflation.
The weaker yen was supposed to help Japan’s trade balance by boosting exports. That didn’t happen. In September, the country reported a trade deficit of 958 billion yen ($9 billion), the 27th consecutive month of trade deficits. The deterioration occurred despite the fact that import prices rose steeply, which should have reduced imports and boosted exports. And while some large Japanese exporters credited the weak yen for easier sales overseas, small and mid-sized Japanese businesses that primarily sell domestically have seen flat sales against rising fuel and material costs.
But price inflation is not pushing up wages as the Keynesians would have expected. In August, Japan reported real wages (adjusted for inflation) fell 2.6% from the year earlier, the 14th straight monthly decline. This simply means that Japanese consumers can buy far less than what they could have before Abenomics. This is not a recipe for happy citizens.
Japanese consumers must also deal with Abe’s highly unpopular increase of the national consumption tax from 5% to 8% (with a planned increase to 10% next year). The sales tax was largely put in place to keep the government’s debt from spiraling out of control as a result of the fiscal stimulus baked into Abenomics. And while economists agree nearly universally that the price increases that have resulted from the sales tax have caused a sharp drop in consumer spending, they fail to apply the same logic that price increases due to inflation will deliver the same result.
A bedrock Keynesian belief is that falling prices create recession by inspiring consumers to delay purchases until prices fall further. According to the theory, even a 1% annual drop in prices could be sufficient to decimate consumers’ willingness to spend. Conversely, they believe rising prices, otherwise known as inflation, will spur spending, and growth, as it inspires people to buy now before prices rise further. But if consumers have clearly been put off by rising prices due to taxation, why would they be encouraged if they were to rise for monetary reasons? Don’t look for an explanation, there isn’t any. In reality, as any store owner will tell you, shoppers shop when prices are low and stay at home when prices are high.
Despite the bleak prospects for Japan, Abe continues to bask in the love of western economists and investors. In an October 6 interview with the The Daily Princetonian, Paul Krugman, who has emerged as Abe’s chief champion and apologist, responded to a question about the European economic crisis by saying “Europe need something like Abenomics only Abenomics, I think, is falling short, so they need something really aggressive in Europe.” A Bloomberg article ran on November 18 under the headline “Abe’s $1 Trillion Gift to Stock Market Shields Recession Gloom.” So according to Bloomberg, Abenomics is not responsible for the country’s fall back into recession, which hurts everyone, but it is responsible for the surging stock market, which primarily benefits the wealthy.
One wonders how much more bad news must come out of the Japanese experiment in mega-stimulus before the Keynesians reassess their assumptions? Oh wait…I’m sorry, for a second there I thought they were susceptible to logic. But those who are not blinded by left-wing dogma should take a good look at where the road of permanent stimulus ultimately leads.
Subscribe to Euro Pacific’s Weekly Digest: Receive all commentaries by Peter Schiff, John Browne, and other Euro Pacific commentators delivered to your inbox every Monday!


NEW YORK (MarketWatch) — The dollar surrendered the gains made against the yen during the Asian session Thursday, after gaining more than 170 basis points in less than 32 hours and surpassing multiple seven-year highs.
The greenback USDJPY, +0.05% traded at ¥117.96, after rising as high as ¥118.97, as it continued to revisit the highs from the summer of 2007, when investors scrambled to the perceived safety of the yen as U.S. credit markets seized up.
And analysts believe this is only a temporary pause in the dollar-yen’s inexorable march upward, and that volatility will increase in equal measure as speculators continue to pile into the currency pair.
“The higher it goes, the more volatile its going to be,” said Boris Schlossberg, managing director of FX strategy at BK Asset Management.
Volatility broadly characterized G-10 currency trading Thursday, as the euro EURUSD, -0.11% also swung wildly, plummeting to $1.2505 after the eurozone flash PMI for November fell to a 16-month low. It soon recovered to $1.2563, slightly above its Wednesday afternoon price of $1.2545. (Read: Eurozone PMI falls to 16-month low in November)

One of the surest signs that a bubble is about to burst is junk bonds behaving like respectable paper. That is, their yields drop to mid-single digits, they start appearing with liberal loan covenants that display a high degree of trust in the issuer, and they start reporting really low default rates that lead the gullible to view them as “safe”. So everyone from pension funds to retirees start loading up in the expectation of banking an extra few points of yield with minimal risk.
This pretty much sums up today’s fixed income world. And if past is prologue, soon to come will be a brutally rude awakening. Most of the following charts are from a long, very well-done cautionary article by Nottingham Advisors’ Lawrence Whistler:
Junk yield premiums over US Treasuries are back down to housing bubble levels:
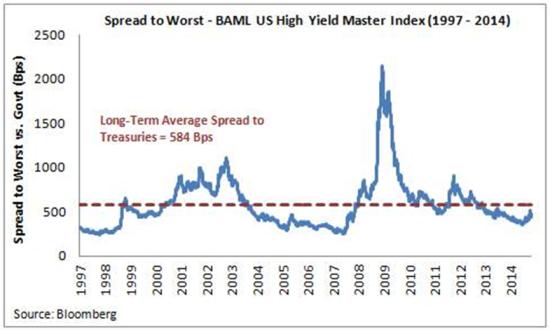
…continue reading HERE

Oil has hit a slick recently with price sliding over 30% in the last five months. There are now calls for price to potentially test the 2009 lows. While I think this is a bit extreme, let’s investigate the charts to see what the evidence there suggests.

We can see price declining from the June 2014 high at US$107.73. This was your stock standard, run-of-the-mill downtrend. Steady as she goes. Then towards the end of September, price ramped up the velocity of the downtrend and price started to fall at a much faster rate. This can be seen in the green highlighted circle.
I have drawn a horizontal line which denotes the swing low in September. We can see in the green highlighted circle that price initially found support at this level before trading back up and making a double top. This was a bearish double top as it was with the trend.
This double top has led to a steep decline that took out the previous swing low and the downtrend then began to accelerate. This is demonstrated by the black downtrend line I have drawn. This trend line initially held the lows of the downtrend. Then when price accelerated to the south side this same trend line held the highs of the downtrend.
Now what is important about this development is that when this happens it usually means the end of the current downtrend is nearing. So what other evidence is there of the downtrend ending?
A common bottoming pattern is three consecutive lower lows. I like to call this the “three strikes and you’re out” low formation and this looks to already be in place now.
Price hit a low of US$73.25 on the 14th November and I suspect that is the end of this current downtrend. Keep in mind, after any rally the overall trend may continue further south.
This third and potentially final low looks to be accompanied a triple bullish divergence in both the Relative Strength Indicator (RSI) and the Moving Average Convergence Divergence (MACD) indicator. This generally leads to a significant rally.
So assuming we get a rally from here, how high could we expect price to rally?
I have added Fibonacci retracement levels of the move down from June 2014 high to the recent low. In these instances, price often rallies back to where the downside acceleration began. The September swing low is around the 50% level at US$90.49 while the double top is around the 61.8% level at US$94.56. I favour price rallying back to one of these levels with a preference for the latter.
Let’s now look at the bigger picture using the monthly and yearly charts as shown in the recent November newsletter.

We can see price has traded in a tight range for the last few years. The high of the range was set in 2011 at US$114.83 while the low of the range was set the same year at US$74.95. This recent move down is the first time price has traded outside of this range.
I have drawn two black uptrending lines from the 2010 low and the 2011 low. Price recently broke down through these trend lines which saw the downtrend accelerate.
While price has marginally broken the 2011 low, I suspect price may find support here and essentially form a double bottom with the 2011 low. This would get the traders in that play the reaction higher. Perhaps they can push price back up to the first black trend line which would be somewhere between the 50% and 61.8% Fibonacci levels as shown in the daily analysis.
However, considering the double bottom is against the trend, price should then turn back down and bust through this support level.
So where could we expect price to finally make a solid low?
I have drawn an Andrew’s Pitchfork which shows price has mostly been trading in the lower channel albeit closer to the middle band. I suspect price is now headed down to test the lower band of this pitchfork. And it is here where I expect the final pullback low to form. Price testing this lower pitchfork trend line in the second quarter of 2015 looks to be slightly under the US$70 mark.
Also, the 2010 low at US$64.24 should be solid support and I doubt price will trade below this level. Price breaking below this level would likely nullify this analysis.
So, I am looking for the final pullback low to be around the US$67-US$68 level. This can be seen in the yellow highlighted circle.
The lower indicators, the RSI and Stochastic indicator, are both showing very oversold readings so a rally now would help to relieve some of this negativity. Then perhaps the next move to final lows will be accompanied by bullish divergences in these indicators. Let’s see.
And once the final pullback low is in place, perhaps we could expect a move up to new rally highs and into the higher pitchfork channel.

This is from the November newsletter and nothing has changed .
We can see the two candles of the years 2008 and 2009 provided a massive trading range. The high in 2008 was US$147.27 while the low in 2009 was US$32.70. A lot of money was won and lost in those two years!
The Parabolic Stop and Reverse (PSAR) indicator has a bearish bias and has provided solid resistance to price in recent years. If price were truly in a big bear trend then this resistance could be expected to hold. But to my eye, the chart does not look like a bear market. At worst, it looks like a big consolidating market. At best, a massive bull market with the 2009 low being a higher low.
With that in mind, it is normal for price to initially be rejected by the PSAR resistance. But then the charade ceases and price reverses back up to bust the dots.
I have drawn voodoo style the candle for 2015 as I expect to see it. It shows the wick making new yearly lows and testing the 2010 low before reversing higher and finishing the year well and truly in positive territory. And busting the PSAR dots in the process. Let’s see.
The Moving Average Convergence Divergence (MACD) still has a bullish bias with the blue line above the red line and even though the averages appear to be moving closer together there is still plenty of time for price to take advantage of this bullishness.
And as for oil testing its 2009 lows, as far as I’m concerned, the Soprano’s Paulie Gualtieri says it best – “Forget about it”.


The golden rule of trading is just this –
What goes sideways when it should move up or down, moves in the opposite direction even stronger.
Where we achieved the temp low in gold on the target week of 11/03, the Dow has moved sideways and is crawling along resistance. Given the G20 position of walking away from bank bailouts, leaving the Cyprus bail-in solution still open, smart money is starting to move off the grid in a very big way. We are tracking capital flows very closely right now. It appears this target on the Cycle of War has an impact.
Of course, then we have the really brain-dead behavior of world leaders acting as if this is high school – Don’t talk to Putin or shake his hand because he didn’t do what I told him to do! With such immature behavior on the part of this Gang of 20 pretending to be world leaders, I have never seen such stupidity. I was just asked are there any world leaders with whom I could have a serious discussion? My reply – no! I have yet to meet anyone since Maggie Thatcher who was smart enough to talk about real strategy without a teleprompter or aids explaining in an ear piece. This seems to be what the bureaucracy wants. While the cat is suffering from dementia, the mice can play.

The Dow is crawling along daily resistance. Timing should have worked normally. A high in November should have been followed by a drop back into the week of 12/15. What will not go down, only goes up. If we close higher this week and see new highs next week, it looks like we are headed into the low 18,000 level on the Dow by mid December.

We have the seasonal turning point of January. The key resistance is at the 18133 to 18200 level as the weeks move forward. This has been the top of the Primary Breakout Channel from the ECM turn back in 2011. This channel has performed perfectly containing everything up and down. If we start to break out above this channel and close above it on a weekly basis, this is the warning that we may see the Dow at the 23000-26000 by next September. Exceeding that area will warn of a possible real blast in a Phase Transition that can take the Dow up to 40,000-43,000.
Fundamentally, who knows. There are too many variables to nail it down to just even a few reasons. We have the Sovereign Debt Crisis, the potential for international war, and major civil unrest. YET this is just the beginning. Add in pensions, bank failures, G20, and a host of other reasons, and some people will respond to one type of event while others will select a different fundamental. This is what is wrong with those who try to predict the trend with fundamentals. They reduce it to one reason and it never can be just one. We are not robots. Everyone will respond appropriately based upon their view.
So pay attention. What will not go down when the cycles shift, inverts and rises even further. There is always a reason for what markets do – you just have to pay very close attention. This is why I have been warning a cycle inversion is coming. We may be in that process now starting from November 19th/20th.

-
I know Mike is a very solid investor and respect his opinions very much. So if he says pay attention to this or that - I will.
~ Dale G.
-
I've started managing my own investments so view Michael's site as a one-stop shop from which to get information and perspectives.
~ Dave E.
-
Michael offers easy reading, honest, common sense information that anyone can use in a practical manner.
~ der_al.
-
A sane voice in a scrambled investment world.
~ Ed R.
Inside Edge Pro Contributors

Greg Weldon

Josef Schachter

Tyler Bollhorn

Ryan Irvine

Paul Beattie

Martin Straith

Patrick Ceresna

Mark Leibovit

James Thorne

Victor Adair