
Asset protection
On Thursday morning, whilst taping this week’s Audioblog, I discussed how overnight, the PMI Manufacturing reports in China, Japan and essentially all of Europe were not only miserable but well below expectations. Heck, even the PMI report in the United States of Economic Lies came in at just 54.7, down from 56.2 last month and well below expectations of an increase to 56.5. In fact, it was the lowest print in ten months, validating with this week’s slew of 4Q GDP estimate downgrades. Which, by the way, were predicated on myriad factors from weak exports, to declining capital investment and even “Polar Vortex 2.0.” In other words, a broad mosaic of data suggesting America is succumbing to its terminal debt addiction, amidst global economic weakness not inappropriately compared to the Depression.
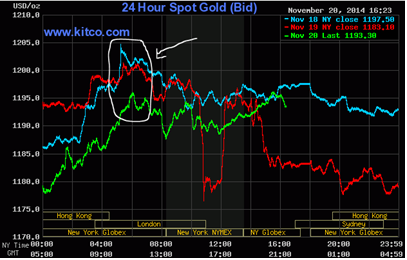
Consequently, the 10-year Treasury yield was on the verge of breaching the Fed’s current “line in the sand” at 2.30% yet again, whilst stocks were in danger of actually declining; and, for the third time this week, gold was about to take out $1,200/oz. (after having been turned back by “Cartel Herald” algorithms the prior two days, at exactly 6:00 AM EST).
Consequently, the U.S. government decided to go as “all-in” on economic data manipulation as Japan has with its hyperinflation strategy. To that end, recall when Forest Gump told the man at the bus stop that he owned the Bubba Gump Shrimp Company; to which, the man replied “Boy, I’ve heard some whoppers in my time, but that tops them all!” To a man, I’d be more inclined to believe Forest could be a CEO than what the government proclaimed this morning; i.e., the “Philly Fed” business conditions index not only rose significantly from last month’s reading of 20.7 but exploded to 40.8. In other words, a ten standard deviation “beat” of the consensus expectation of 18.0, whose theoretical odds occurring at just one in 1.5×10^23. And not only did this “survey” print its strongest reading since 199 but strongest new orders component since 1988!
I doubt anyone in the investment world believes that’s even remotely true, particularly as it not only contradicted the PMI report published just 15 minutes earlier but essentially every real data point imaginable. I mean in the past two weeks alone, it was reported that durable goods orders, factory orders, construction activity and industrial production declined in October, whilst retail sales rose a scant 0.3%. Throw in the aforementioned, grisly international data and it’s difficult to believe any increase occurred – let alone, of the magnitude this travesty of a report depicted.
Of course, the “Dow Jones Propaganda Average” was treated to its 20th straight “dead ringer” algorithm – as it prepares to hyper-inflate, Venezuela-style.
However, a funny thing happened in the world of “recovery”; as not only did Treasury yields decline, but closed just three basis points from the aforementioned “line in the sand” the Fed is so terrified of. After all, it borders on comical that the Fed is pretending to consider rate hikes – even if not for a “considerable time” – when rates are plunging. Let alone, when rate declines occur as their data cookers purport the “best economic conditions” since 1993; and oh yeah, the “stock market” is trading at record highs.
Better yet, despite relentless capping and attacking – no less, with the potentially Cartel-destroying Swiss referendum just ten days away; gold and silver not only recovered yesterday’s Cartel orchestrated losses, but closed at the day’s highs – setting up gold for a fourth attempt to take out $1,200 in four days. Could we actually have three straight strong Friday’s – which frankly, NEVER happens? Much less with the Swiss referendum next Sunday?
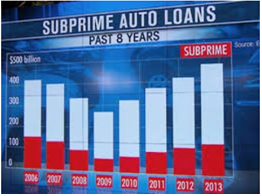
For some time now, we have discussed how the “propaganda leg” of the “evil tripod” of money printing, market manipulation and propaganda is permanently broken. In other words, no matter what propaganda is reported, the world is starting to realize the true state of the U.S. economy. For example, auto sales cannot be characterized as “strong” when they are either leases or subprime loan financed; let alone, amidst an environment of record “channel stuffing.”
Zero Hedge
Better yet, the “sentiment” of trade organizations like the National Association of Home Builders has as much credibility as a fox in a henhouse; particularly when it explodes to multi-year highs when both home sales and housing starts (in the latter case, principally rental units) remain at recessionary levels.
And thus, the issue of the boy who cried wolf. At some point, people stop listening; and in this case, global fixed income and commodity markets decidedly aren’t buying America’s “recovery” propaganda. Not to mention, the physical gold and silver markets, which are both experiencing record demand. Given the reality that “Economic Mother Nature” is revealing, it won’t be long before the money printing and market manipulation “legs” break as well. And when they do, if you haven’t already protected yourself with real money, you may never get the chance; certainly, not at prices anywhere near today’s historically suppressed levels.

Gold has been volatile in recent weeks. It broke down, then it bounced back up. So where does it currently stand?
Gold’s timing will help us in identifying the lows and the steps upward towards a new bull market.
Chart 1 shows our favorite gold timing tool. As our older readers know, gold has had recurring cycles going back for years.
(Click on image to enlarge)
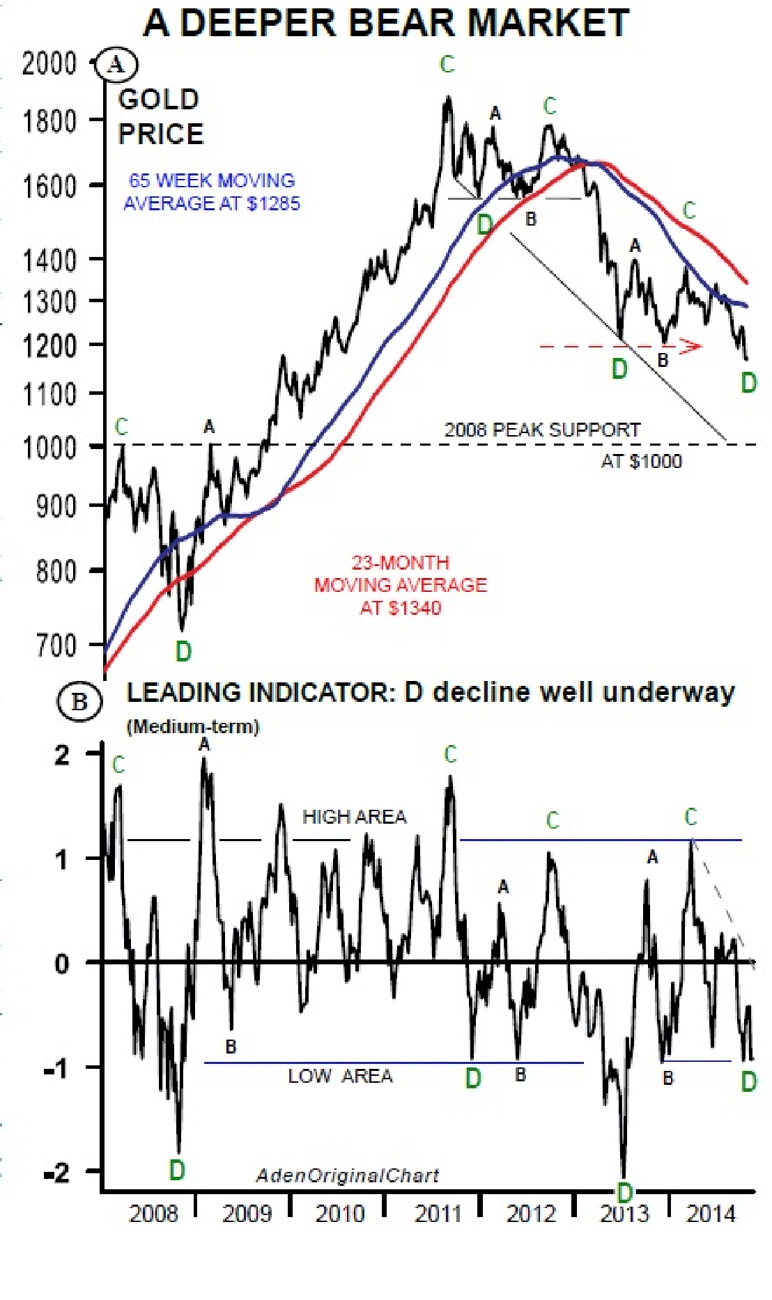
Currently, a D decline has been underway since last March when gold’s 2014 rise petered out. D declines tend to be the worst decline in gold’s cycle. And during bear markets, D declines usually take gold to new lows for the bear market.
This is exactly what happened this month. Most impressive, the leading indicator has yet to fall into the extreme low areas that normally coincide with D lows… This means gold could still go lower before this decline is over.
On the downside, gold will remain weak below $1200, and especially below its $1180 low. And the longer this is the case, the more likely we’ll see lower lows soon.
A clear decline below $1150 means $1100 would be a shot away. This would likely take the indicator down to test the extreme D lows.
GOLD SHARES: Fell the most
Gold shares, however, took the cake. They plunged much more than gold and silver. And the gold share indexes fell to their 2008 lows. That is, they fell to the lows of the depths of the financial crisis washout.
The HUI Gold Bugs index is now starting to consolidate near these lows above 150, and as long as that’s the case, we just may see the start of constructive base-building.
Gold mining shares are weaker than gold, the most they’ve ever been since the 1960s. This weakness is not over yet, but the 5 week moving average works well in identifying the start of a turn.
So keep an eye on 170 for HUI. If it can stay above this level, gold shares will be looking better and they could then be leading gold.
###
Nov 20, 2014
Mary Anne & Pamela Aden
email: ![]() info@adenforecast.com
info@adenforecast.com
The Aden Forecast

— Is the US Next?
It’s been quite a month.
In late October Japan, despite a year of fairly aggressive quantitative easing, dropped back into recession and concluded that even easier money was the cure for its ills. It announced a debt monetization plan of almost science-fictional proportions in which the amount of new yen to be created, as a percentage of GDP, will be equivalent to $3 trillion a year in the US. See Reactions to BoJ’s Kuroda’s Stunning, Doubled-Down QE ‘Experiment’
Then the European Central Bank, after years of operating in Germanic tight-money mode, finally accepted that a shrinking money supply was pushing the weaker eurozone countries into depression. On November 21 it threw caution to the wind and began buying up (by the sound of it) pretty much every stray piece of paper that’s blowing in the Continental wind. See
Mario Draghi Says E.C.B. Will ‘Do What We Must’ to Stoke Inflation
Most recently China, whose massive purchases of raw materials became the engine of the post-2008 recovery, discovered that much of the debt incurred to build those entire new cities is about as likely to be paid back as a typical subprime mortgage circa 2007. So it announced a surprise interest rate cut and a promise to do much more if necessary. See China’s surprise rate cut shows how freaked out the government is by the slowdown and Fear Of “Surge In Debt Defaults, Business Failures And Job Losses” Means Many More Chinese Rate Cuts
These are not the actions of economies in sustainable recovery but of countries falling into an abyss. Such open-ended offerings to the market gods are explicitly designed to get the juices of stock traders flowing. But so far that’s all they’ve done. Here’s a chart from Zero Hedge showing how each year’s initial GDP optimism has faded even while equity prices have continued to rise.

So, two questions:
1) Will stepped-up debt monetization and interest rate reductions succeed where the past batch failed? Not likely, for both practical and theoretical reasons. There’s just too much debt outstanding to allow normal market mechanisms to produce sustainable growth. There’s simply nothing that Italy or Japan can build with borrowed money that will generate a positive return, given how much they already owe. So those descending GDP estimate lines will soon be joined by a new one with the same arc for 2015.
2) Can the US remain aloof from the carnage taking place all around it? Also not likely, since the actions being taking by our trading partners all coalesce around a single data point, which is a more expensive dollar. The US has had a relatively smooth few years because Fed policy was relatively easy and the dollar, as a result, was relatively weak versus the yen and euro. Now both of those trends have reversed in a big way. Here’s the dollar versus the world’s other main currencies over the past year:

Where the previously-strong euro and yen pushed Europe and Japan into recession, a strong dollar will impose the same headwind on the US in 2015. So there’s a decent chance that a year from now we’ll be faced with a world in which debt monetization has failed in three of the four major economies and a strong currency has sucker-punched the last one standing. And the only politically-acceptable response will be more of the same. Why isn’t gold soaring?
Yet overnight two central banks promised what amounts to more monetary heroin and, presto, the S&P 500 index jerked up to 2070. That is, the robo-traders inflated the PE multiple for S&P’s basket of US-based global companies to a nose bleed 20X their reported LTM earnings.
And those earnings surely embody a high water mark in a world where Japan is going down for the count, China’s house of cards is truly collapsing, Europe is plunging into a triple dip and Wall Street’s spurious claim that 3% “escape velocity” has finally arrived in the US is soon to be discredited for the 5th year running. So it goes without saying that if “price discovery” actually existed in the Wall Street casino, the capitalization rate on these blatantly engineered earnings (i.e. inflated EPS owing to massive buybacks) would be decidedly less exuberant.
In truth, nothing has changed about the precarious state of the world since yesterday. Except….. except the Great Bloviator at the ECB made another fatuous and undeliverable promise—- this time that he would do whatever he “must to raise inflation and inflation expectations as fast as possible”; and, at nearly the same hour, the desperate comrades in Beijing administered another sharp poke in the eye to China’s savers by lowering the deposit rate to by 25 bps to 2.75%.
Let’s see. Can it possibly be true that European growth is faltering because it does not have enough inflation? Or that China’s fantastic borrowing and building boom is cooling rapidly because the People Bank of China (PBOC) has been too stingy?
The answer is not on your life, of course. So why would stocks soar based on two overnight announcements that can not possibly alleviate Europe’s slide into recession or the collapse of China’s out-of-control investment and construction bubble?
It can’t be a case of debatable data. Europe’s real GDP is no higher today than it was in the third quarter of 2006. Self-evidently, the temporary slowdown in consumer inflation during recent months owing to plunging oil prices and the transient impact of exchange rates cannot explain this long-standing trend of going nowhere.

Indeed, during this same period, Europe’s CPI is has risen by nearly 20%. Where is it written or proven that an average of 2% annual inflation causes economic growth to grind to a halt? There is not a shred of evidence for that proposition—so Draghi’s pledge to restore 2%/year shrinkage in the value of the wages and bank accounts of European households cannot mean more growth, more profits and more S&P market cap.

In fact, the whole clamor about “deflation” and Draghi’s overnight pledge to do whatever it takes to get inflation rising quickly has to do with a transient blip in the price index during the last 12-18 months. But this the first time that a shift in the global commodity cycle and the euro exchange rate has caused a temporary dip in short-run consumer price trends? The historic data indicate a resounding no.

In fact,the only manner in which weakening inflation could possibly impact short-run real GDP growth is if consumers sharply raised their savings rate, waiting for lower prices tomorrow. This is the hackneyed claim of the Keynesian money printers, of course, but where’s the evidence? After a temporary surge in Europe’s personal savings rate during the Great Depression, it has regressed to its recent historical average, and has remained on the flat line, even as inflation rates have decelerated since 2012.

No, the problem in Europe is not too little inflation in the short-run; it is staggering levels of taxes, public debt and interventionist dirigisme that represents a permanent, debilitating barrier to growth. Draghi already has driven deposit rates through the zero bound at the ECB deposit facility, and now its spreading rapidly through the banking system to businesses and consumers. Precisely who will finance this soaring mountain of public debt at negative real returns when the fast money is flushed out of the ECB’s now plummeting euro?

Likewise, last night”s signal from China was a warning to take cover, not get all giddy in the casino. The People’s Printing Press of China has been on a rampage for this entire century, and has expanded its balance sheet by an incredible 9X since the year 2000. Now, even its masters of red capitalism in Beijing know this has fueled fantastic levels of over-building, over-investment and mind-boggling real estate speculation throughout the land. The fact that they have had to once again open the monetary spigot is evidence that China’s addiction to the printing press is terminal, and that a hard landing is only a matter of time.

The real trajectory in China is tracked by the canary in the iron ore pit. Like almost everything else, its iron and steel industry is massively overbuilt. It has 1.1 billion tons of capacity but in the order of 600 billion tons of sustainable demand. Stated differently, China’s excess steel capacity is greater than the combined output of the US, Japan, and the EC combined. Accordingly, when its real estate and construction bubble finally collapses, the world market will be inundated with cheap steel and every manner of goods made from it, including automobiles. During the current year alone, China will export more steel than the US industry will produce.
 In short, there is a tidal wave of industrial deflation coming owing to two decades of world-wide central bank financial repression. That, in turn, will trigger a race to the bottom by central banks—a race that is already underway owing to Japan’s Hollowing Massacre of the yen. Soon the rest of East Asia—and especially China— will have to join the plunge or find their export based economies hitting the shoals.
Then will come more desperate maneuvers from the ECB, as even the German export machine falters in the face of collapsing growth in China and competitive devaluation all around the world. Stated differently, last night’s central bank announcements were the starting gun for a monetary implosion that will soon shock financial markets and real production, trade, employment and incomes on a world-wide basis.
Someone should reprogram the algos. Otherwise, one of these days they will snatch a headline which says sell, sell…..sell.
Reprinted with permission from David Stockman.
Former Congressman David A. Stockman was Reagan’s OMB director, which he wrote about in his best-selling book, The Triumph of Politics. His latest book is The Great Deformation: The Corruption of Capitalism in America. He’s the editor and publisher of the new David Stockman’s Contra Corner. He was an original partner in the Blackstone Group, and reads LRC the first thing every morning.

 Market Buzz – China’s Central Bank
China’s central bank succumbed to political and market pressure and cut interest rates for the first time in more than two years, in a sign that the country’s leadership is leaning toward more sweeping measures to bolster flagging economic growth.
China’s cut helped oil prices rise on Friday for crudes first weekly gain in two months with benchmark Brent crude returning to above US$80 a barrel after a rally triggered by China’s interest rate cut and speculation of an OPEC output cut. China is the largest net importer of petroleum and metals, and the rate cut sent most commodity prices higher, albeit from beat down levels.
Brent oil rose US$1.03 to settle at US$80.36 a barrel. It had risen as much as US$2.28 earlier to a session high of US$81.61. WTI or U.S. crude finished up US$0.66 at US$76.51, after an intraday peak at US$77.83.
The surprise move by the People’s Bank of China late Friday comes after a series of piecemeal easing measures that failed to encourage banks to lend and companies to borrow. Several economic indicators—from investment growth to factory production to retail sales—showed weakness last month. A number of pundits are not in the camp that China could miss its annual growth target—set at about 7.5% for 2014—for the first time since the 1998 Asian financial crisis. We question whether or not the numbers are accurate in the first place, but the trend in terms of slower growth is something to pay attention to.
Expectations of a production cut from the Organization of the Petroleum Exporting Countries (OPEC) at its November 27th meeting also fed the rally, although profit-taking emerged later, along with selling by those expecting another tumble next week.
KeyStone’s Latest Reports Section
11/21/2014
CASH RICH BASE METAL PRODUCER POST SOLID Q4, SHARES JUMP AMID TAKEOVER SPECULATION – HOLD

-
I know Mike is a very solid investor and respect his opinions very much. So if he says pay attention to this or that - I will.
~ Dale G.
-
I've started managing my own investments so view Michael's site as a one-stop shop from which to get information and perspectives.
~ Dave E.
-
Michael offers easy reading, honest, common sense information that anyone can use in a practical manner.
~ der_al.
-
A sane voice in a scrambled investment world.
~ Ed R.
Inside Edge Pro Contributors

Greg Weldon

Josef Schachter

Tyler Bollhorn

Ryan Irvine

Paul Beattie

Martin Straith

Patrick Ceresna

Mark Leibovit

James Thorne

Victor Adair