
Timing & trends
Review:
- In my last analysis from 19th of October I expected Gold to break down below US$1,180.00 rather sooner than later. After a final push towards US$1,256.00 the bears took over again and Gold sold off all the way down to US$1,130.00.
- Unfortunately Gold never made it to my recommended entry level (US$1,275.00-US$1,285.00) for a short sell swing-trade.
Arguments for lower prices:
- 3.3-years downtrend: Overall Gold still is in a downtrend. US$1,525.00 remains the line in the sand. Gold will need much more time to break through this heavy resistance. Only a move above US$1,350.00, US$1,390.00 and especially US$1,430.00 will indicate that the mid- and longer-term trend indeed has changed. A sustainable move above US$1,275.00 would already brighten up the technical picture. The 8-year cycle for Gold should bring a significant low around 2015/2016. It could mean that this bear market has to continue for one or two more years. But we are very likely in the last quarter.
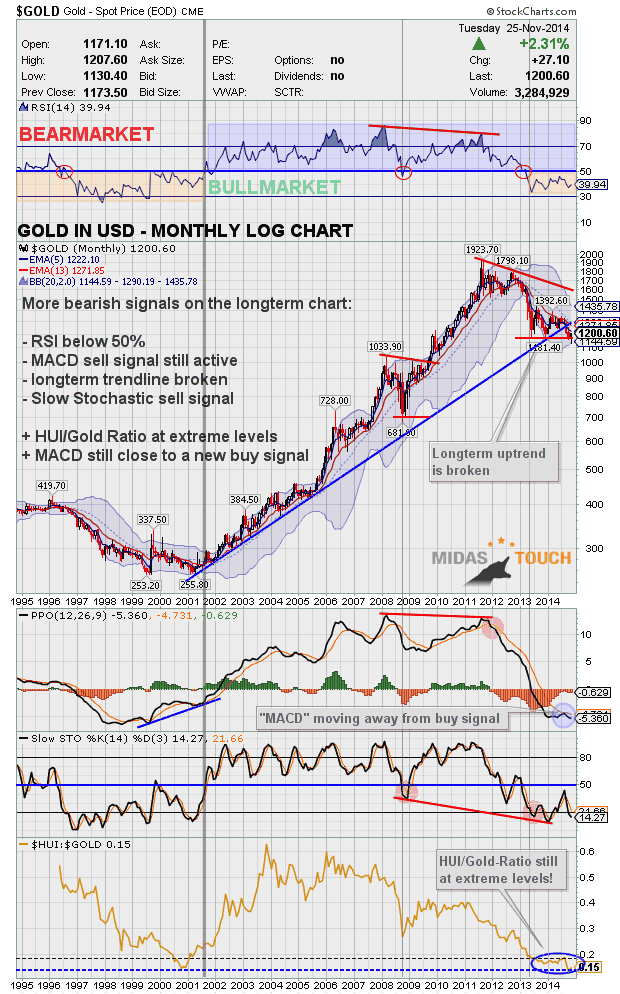
- Gold Monthly Chart: The long term up-trendline has been clearly broken. The chart remains in bear market mode. The MACD indicator has been moving away from a buy signal. The charts looks like gold will need to test the strong support zone between US$1,050.00 and US$980.00 before a new up trend can begin.
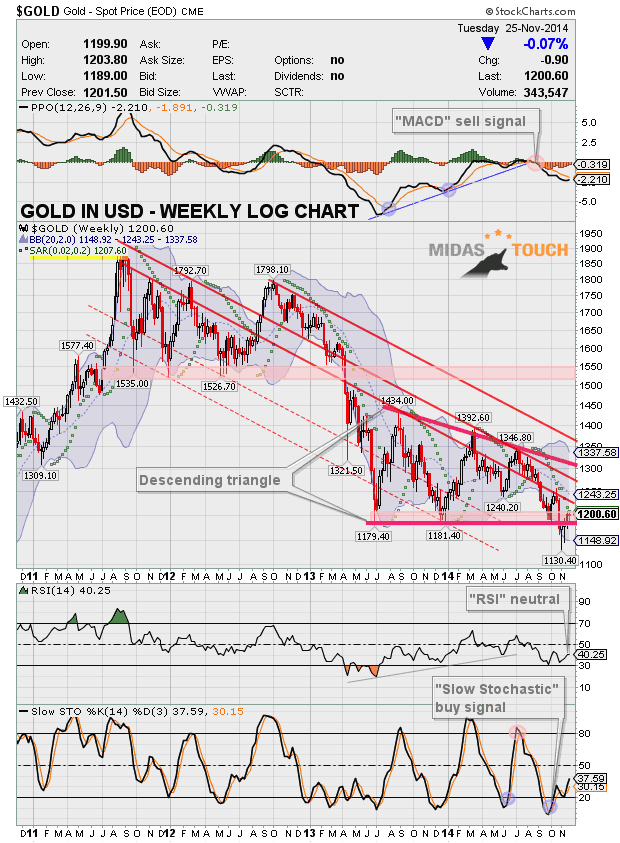
- Gold Weekly Chart: The bearish descending triangle continues to be the important formation here. As well the MACD sell signal remains in place. Gold is respecting the downtrend channel which creates heavy resistance around US$1,230.00 and US$1,270.00.
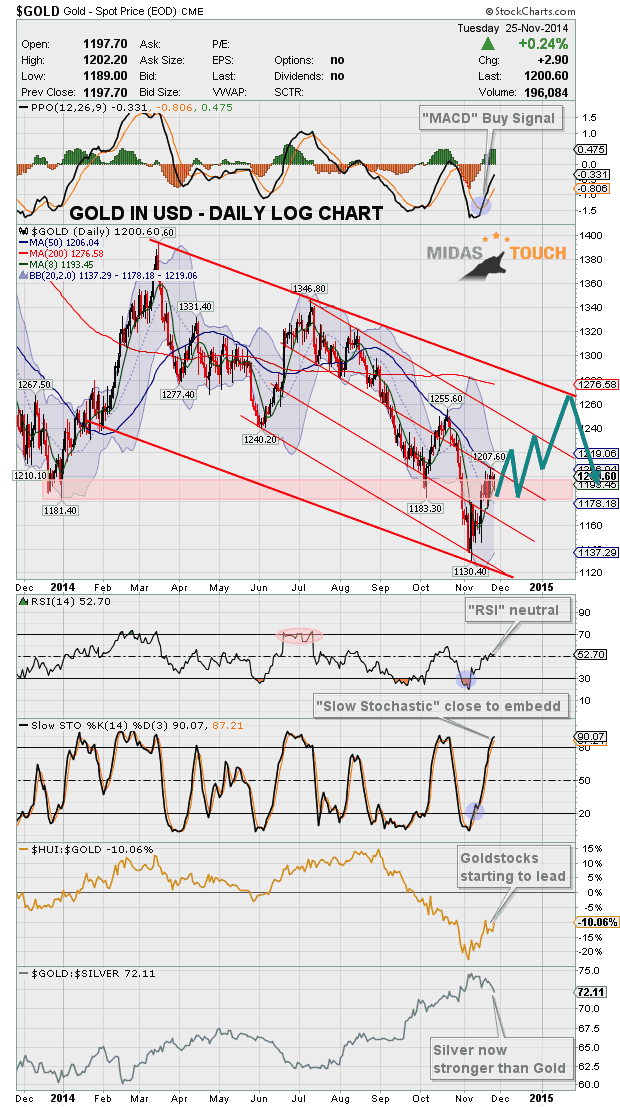
- Gold Daily Chart: Short-term Gold is in an up trend but is struggling to push sustainably through the US$1,200.00 level. The 50-MA (US$1,206.04) and the upper Bollinger Band (US$1,219.06) are resistance. The chart is not oversold anymore and the overall downtrend could resume anytime.
- Gold Stocks: HUI index crashed through important support around 183 points. The recent recovery has brought the index back to this zone which now acts as resistance. Tax loss selling might affect the mining shares in the coming weeks.
- US-Dollar: One of the main catalysts behind the falling gold price has been the strong US-Dollar. Besides some negative divergences there are no technical signals yet that the dollar is topping out indeed.
Arguments for higher prices:
- Gold Monthly Chart: No bullish indication but prices have recently spiked below the lower Bollinger Band which was unsustainable. Also note that the rising lower Bollinger Band is supporting Gold at US$1,144.08.
- Gold Weekly Chart: Although Gold broke through the descending triangle it did not happen in a very decisive manner. Instead Gold has already regained the US$1,180.00 resistance and is close to the US$1,200.00 level as well. The “ParabolicSar-Indicator” is about to switch to a long signal if Gold pushes above US$1,207.60. RSI and stochastic seem to have turned around already.
- Gold Daily Chart: With two big up days driven by short covering gold is up nearly 6.8% in the last 13 trading days. On 7th of November a morning star candle appeared on the chart and clearly indicated a short-term reversal to the upside. The falling 50-MA (US1,206.04) is acting as a magnet and Gold is oscillating around this moving average since about one week already. The next target and at the same time next resistance is the upper Bollinger Band (US$1,219.06). The slow stochastic indicator is about to embed with both lines above 80 for three consecutive days. This is locking in the bullish trend.
- Euro-Gold: €-Gold briefly touched the june lows at 907.00€ only to turn higher again. The ascending triangle is still in play and it looks like €-Gold wants to test the psychological level around 1,000.00€ soon. A breakout would create an immediate upside potential to around 1,075.00€
- Sentiment: Besides the recent recovery sentiment remains at excessive pessimism levels. During the first week of November many extremely bearish forecasts appeared and some famous newsletter-writes even started to finally sell gold short. This type of sentiment continues to support higher prices as the majority is short gold hoping for lower prices.
- Seasonality: Generally seasonality now is very supportive for gold and silver until mid of february. November tends to be the second best month of the year while December statistically sums up with a minor loss. Short-term seasonality is supportive until mid of December.
- CoT-Data: According to the latest CoT-Data the commercials had a 70,997 net short position in COMEX Gold Futures last tuesday. The week before this number was at 50.024 which coincides with a 10-month low. Clearly the smart money is playing the gold-market well and now seems to be positioned for higher gold prices again. At the same time the managed money (hedge funds and commodity pool operators) ramped up their shorts to 19% open interest which statistically is not sustainable. The CoT-Data now supports at least a larger recovery for gold.
- Volatility: On November 7th the CBOE Gold Volatility Index reached a 16-month high at 23.36 indicating high levels of fear and panic in the gold market. Since then volatility has eased. Negative divergences pointing to lower levels of volatility which limits downside risk in gold price.
- Gold/Silver Ratio: The ratio reached my target of around 77 points and posted an island reversal candle outside the bollinger bands on the same trading day. I think we have seen the lows of this bear market in silver already. The zone around US$15.00 is massive support and silver has been stronger than gold in the last two weeks pushing the ratio down to currently 72.11 points. Even if gold will go down to US$1,050.00 I am making the bold call that silver will not make a lower low anymore! Instead it should have bottomed before Gold!
- Gold-Stocks: After being pushed down to an 8-year low at 146.01 points the HUI Gold Bugs Index managed to recover 24.2% within one week. The Gold stocks starting to outperform gold again which is a positive sign. The sector has been massively beaten down in the last 3.5 years and remains in liquidation.
- US-Dollar: After a massive 6-month rally the market’s most crucial extreme is in the US-Dollar. The rally has pushed the currency to a 4.5 year high and sentiment (Optix) to extreme levels. The recent Commitment of Traders (CoT) report on the US-Dollar is coming off its most positive readings in history. When sentiment readings like the CoT and Optix signal extreme optimism, the opposite usually occurs… A falling US-Dollar is getting more and more likely here.
Conclusion:
- Although the bullish arguments are not overwhelming at this point I think this rally has more legs. Short-term Gold should climb until US$1,215.00-1,220.00. After a setback that should hold above the US$1,175.00 level the 200-MA (US$1,276.58) becomes the logical next target. As this moving average will start falling in the next couple of weeks Gold might able to push towards US$1,255.00 until january or february 2015. Overall I think this bear market is not over yet and Gold will need to make another lower low (maybe in may or june 2015?). But short-term the bulls have the advantage.
- Swing-traders could buy any setback towards US$1,175.00 with a hard stop at US$1,145.00 and a target of US$1,255.00 which gives a reasonable risk/reward-ratio of 1 to 2.66. Depending on future developments Gold around US$1,255.00 might offer a good shorting opportunity in the coming months.
- Investors with a long-term perspective should continue to accumulate physical Gold below US1,200.00. I recommend to put 10-20% of your net-worth into physical Gold and Silver as an insurance and hedge against the growing imbalances in our financial system.
Long term:
- Nothing has changed
- Precious Metals secular bull market continues and is moving step by step closer to the final parabolic phase (could start within 1-2 years and last for 2-5 years or even longer)
- Price target DowJones/Gold Ratio ca. 1:1
- Price target Gold/Silver Ratio ca. 10:1 (for every ounce of gold there are 9 ounces of silver mined, historically the ratio was at 15:1 during the roman empire)
- My personal price target remains at US$5,000.00 to US$8,900.00 for Gold within the next 5-8 years
- Fundamentally, when the current bear market is over Gold should start the final 3rd phase of this long term bull market. 1st stage saw the miners closing their hedge books, the 2nd stage continuously presented us news about institutions and central banks buying or repatriating gold. The coming 3rd and finally parabolic stage will end in the distribution to small inexperienced new investors who will be subject to blind greed and frenzied panic.
About the Author: Florian Grummes
Florian Grummes is studying and trading the Gold market since 2003. Parallel to his trading business he is also a very creative & successful composer, songwriter and music producer.

 From John Mauldin:
“For a central banker, deflation is one of the Four Horsemen of the Apocalypse: Death, Famine, Disease, and Deflation. It is helpful to understand that, before a person is allowed to join the staff or board of a central bank, he or she is taken into a back room and given DNA replacement therapy, inserting a gene that is viscerally opposed to deflation.”
Death: There will be many more deaths – think Middle East, Ukraine, Africa, and the next big war.
Famine: A shortage of food, whether inspired by drought, politics or war has been normal throughout history. Today there are food shortages in many countries and there are nearly 50,000,000 people in the U.S. on food stamps (SNAP) – the modern equivalent of “bread lines” and “soup kitchens.”
Disease: Ebola, AIDS and drug resistant TB, staph infections and more.
Deflation:
…continue reading for advice on how to manage all of today’s dangers HERE

 Jim Rogers, American businessman, investor and author, joins RT for a hard hitting interview where he explains that Russian President Vladimir Putin is on the right line over the extreme threat the US Dollar is under as China, Russia and many other countries in the world run from the US Greenback due to America being the “largest debtor nation in world history” which is getting worse and worse.
Rogers explains that the Dollar is a “seriously flawed currency” and nations need something else to use, which is why the recent trade deals being made by a variety of countries to bypass the dollar and trade using their own currencies is yet another nail in the dollar’s coffin.
Ed Note: For a short term Bullish Trading view of the Dollar read the top 1/2 of this article HERE


The Catharsis in the Gold Industry Is Healthy
Frank notes that the currency play among the Euro, the Yen and the Dollar is having an impact on commodity pricing given the current stronger dollar. He believes the currencies will re-adjust and in six months the picture will likely be different as U.S. exports slow. They discuss the fracking boom in the U.S., and how that may benefit the Asian economy through lower energy costs. Frank gives his overview of the gold market, and notes the royalty companies are the place to be in these times of weak gold prices. He also believes the catharsis in the gold industry is healthy, and will eventually weed out excessive debt and inefficient allocation of capital. A stronger industry will emerge, but many weaker companies will not survive.
…more from Frank:

Where Is the Price of Crude Oil Going?
Trading position (short-term; our opinion): Long positions with a stop-loss at $72.78 are justified from the risk/reward perspective.
On Friday, crude oil gained 0.47% as Thursday’s solid U.S. data and talks that OPEC may consider trimming production continued to support the commodity. As a result, light crude left the recent consolidation and closed the day above $76. Will we see a rally to $80 in the coming days?
On Friday, crude oil climbed to an intraday high of $77.83 as the combination of solid U.S. data continued to support the commodity. How did this increase affected the very short-term picture of crude oil? (charts courtesy of http://stockcharts.com).

From the medium-term perspective, we see that the situation hasn’t changed much as crude oil is still trading above the key support created by the 50% Fibonacci retracement based on the entire 2009-2011 rally.
What can we infer from the very short-term picture?

In our previous Oil Trading Alert, we wrote the following:
(…) The first thing that catches the eye on the daily chart is an invalidation of the breakdown below the previously-broken lower border of the declining trend channel. Although we saw a similar price action in mid-Nov, this time oil bulls managed to push the commodity not only well above this support line, but also above the upper border of the consolidation (marked with red). These are strong bullish signals, which suggest further improvement in the coming days.
Looking at the above chart, we see that oil bulls pushed the commodity higher as we expected. As a result, crude oil bounced off the upper line of the consolidation and approached the Nov 12 high. Although light crude gave up some gains, it still remains above the consolidation range, which means that as long as there is no invalidation of the breakout further improvement is likely. How high could light crude go? We think that the best answer to this question will be our last commentary:
(…) Taking into account the breakout from consolidation, crude oil will likely climb to around $79.50, where the size of the upswing will correspond to the height of the formation. At this point, it’s worth noting that this target is in a solid resistance area where the upper line of the declining trend channel, the previous lows and the barrier of $80 are. Therefore, we think that further rally will be more likely, if we see a breakout above this zone. In this case, the next upside target for oil bulls would be around $81.68, where the 38.2% Fibonacci retracement based on the Sep 30-Nov 14 decline is. (…) the CCI and Stochastic Oscillator generated buy signals, supporting the bullish case.
Summing up, we are convinced that keeping long positions (which are already profitable) is still justified from the risk/reward perspective as crude oil broke (and closed the day) above the upper line of the consolidation and buy signals generated by the CCI and Stochastic Oscillator remain in place, supporting further improvement.
Very short-term outlook: bullish
Short-term outlook: mixed with bullish bias
MT outlook: mixed
LT outlook: bullish
Trading position (short-term; our opinion): Long positions with a stop-loss at $72.78 are justified from the risk/reward perspective.

-
I know Mike is a very solid investor and respect his opinions very much. So if he says pay attention to this or that - I will.
~ Dale G.
-
I've started managing my own investments so view Michael's site as a one-stop shop from which to get information and perspectives.
~ Dave E.
-
Michael offers easy reading, honest, common sense information that anyone can use in a practical manner.
~ der_al.
-
A sane voice in a scrambled investment world.
~ Ed R.
Inside Edge Pro Contributors

Greg Weldon

Josef Schachter

Tyler Bollhorn

Ryan Irvine

Paul Beattie

Martin Straith

Patrick Ceresna

Mark Leibovit

James Thorne

Victor Adair