
Currency
We have been resolutely Bullish the US Dollar this year…all of our trading in the currency futures and options market has be predicated on a Bullish Dollar view. We have repeatedly recommended to our readers to NOT take net short positions against the US Dollar. We have traded currencies for over 40 years and we have learned that currency trends often go WAY further than seems logical or reasonable.
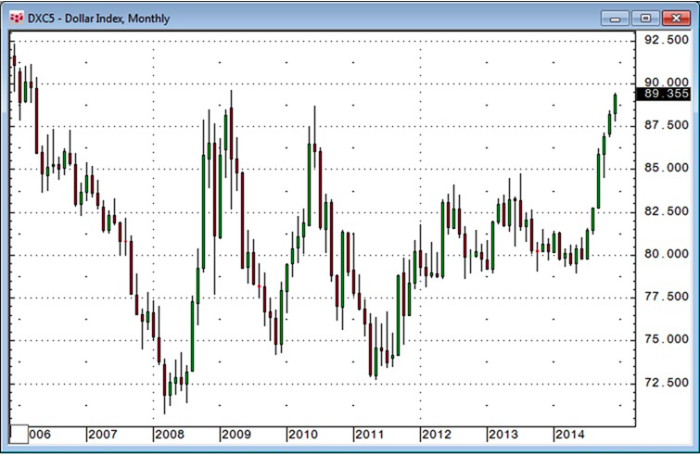
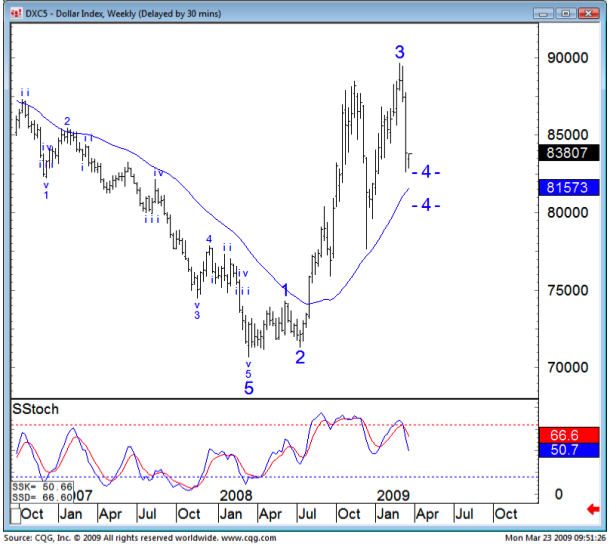
The USD Index closed last week at 8 year highs…it began to accelerate higher in July and is up ~11% since then…
The major commodity indices fell to new 4 year lows last week…down 32 to 36% from their 2011 highs…as the US Dollar rose to 8 year highs…
Central Banks outside the USA are fighting deflation…falling commodity prices will force these banks to intensify their simulative actions…thereby adding to the market’s perception of a widening “split” between the FED (tightening) and other Central Banks (easing)…this perception is US Dollar bullish.
The Yen is at 7 year lows…down ~36% in the last 2 years…down 17% since July…

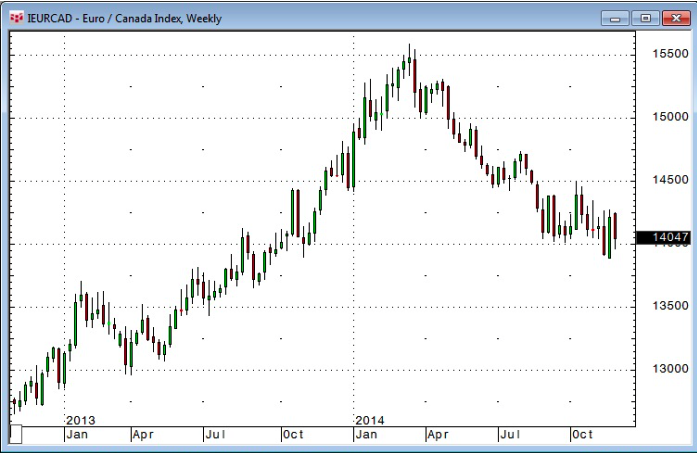
The Euro is at 2 year lows…down 13% since making a Weekly Key Reversal Down in May.

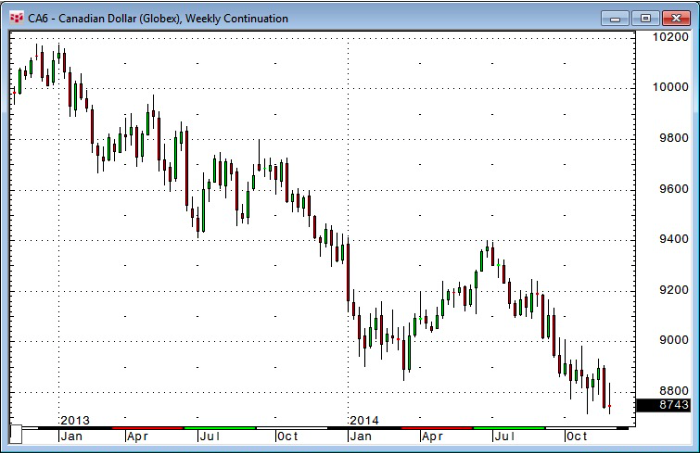
The weak CAD (now at 5 year lows) has been a “shock absorber” for the Canadian economy…if the CAD was still above par, unemployment would be rising …not falling. As a long term currency hedge in 2007 we began switching a significant chunk of our net worth into USD….at an average exchange rate above par. This strategy was not a “trade” but rather a currency diversification once we realized that we had hugely benefited from “being in the right place at the right time” while the CAD rallied from 62 cents to well above par on the back of the 2001 – 2011 credit driven commodity bull market. We expect to see the CAD lower against the USD in 2016….but…
We continue to expect CAD to strengthen against other principle currencies…
WTI Crude Oil fell ~38% since June…hitting 5 year lows…

Here’s what happened to the currencies of some oil producing countries since June:
US Dollar Index: UP ~11%
Canada: DOWN~ 6%
UK: DOWN ~9%
Mexico: DOWN ~11%
Norway: DOWN~18%
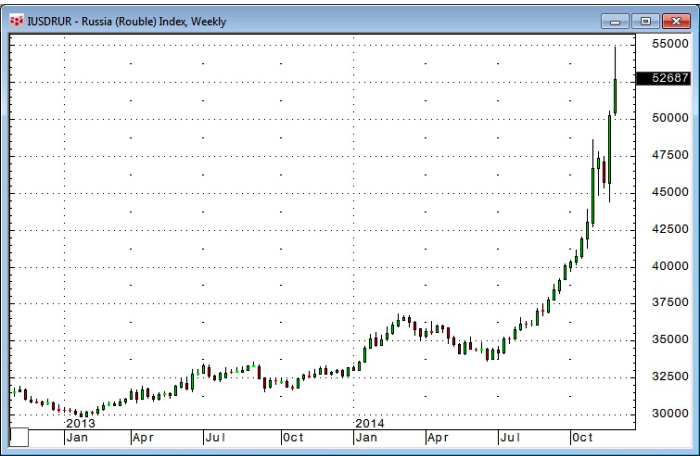
Russia: DOWN ~60%
The collapse of the Russian Ruble shows how a weakening currency can lead to a stampede of capital flight when markets lose confidence and panic…
The Gold Market: made new 4 year lows in November…but rallied $80 from overnight lows on December 1. If gold had closed last week above $1210 it would have created a Weekly Key reversal Up…that didn’t happen…but we are watching gold closely. The 3 year downtrend in gold remains intact (that strong US Dollar hurts!) but a December close above $1250 in this bullish USD environment would be very interesting and would likely led to more gains.

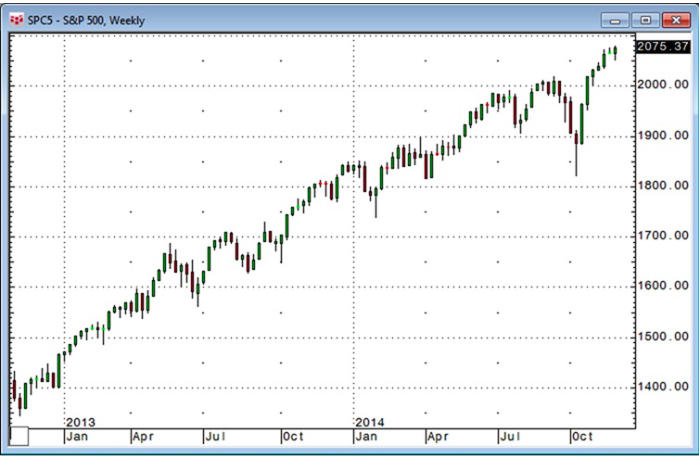
The Stock Market: We have been skeptical of the stock market for the past 2 years. During that time we have opportunistically traded it from the short side. We have made some money…but we would obviously have made much more if we had simply “gone with the trend” and been buyers…especially if we had embraced a “Buy the Dip” mentality. We may be slow learners but we have changed our minds…where we used to see stocks as “over-valued” because of Central Bank printing…and therefore likely to “collapse” once the Central Banks “changed their ways”…we now think that stocks may be “the only game in town” as pension funds and other institutional pools of capital “rebalance” their portfolios away from low yielding fixed income and into stocks. In a deflationary world Central Banks are likely to keep interest rates low for a long time…especially outside the USA. So we foresee a possible “double-whammy” of a global multi-trillion dollar rebalancing of institutional money into stocks…and a global flow of capital to America in search of safety and opportunity driving US stocks higher…perhaps much higher. (A possible reprise of the 1995 – 2000 period when the USD rose by 50% and the S+P tripled!)


Crude oil prices had a seemingly exhaustive washout selloff following the Nov. 27 OPEC meeting. Oil bulls had been hoping for a production cutback at that meeting, but Saudi Arabia successfully led an effort to oppose such cuts.
But the message from the Commitment of Traders (COT) Report data is that the washout is not yet complete. An exhaustive move like what we have seen should produce capitulation among the small speculators, but instead the readings from recent weeks showed them them rushing in to buy.
Traders’ positions are reported each Friday in the COT Report, and they are broken down into 3 categories:
….continue reading HERE

As a general rule, the most successful man in life is the man who has the best information
De Beers shaped today’s diamond market. They started in the U.S. back in the late 1930s.
De Beers wanted to expand its market (at the time De Beers controlled 90% of the global diamond market). Diamonds, the larger diamonds, had always symbolized wealth and status but how could De Beers market the smaller diamonds to the masses?
In 1938, De Beers hired Philadelphia ad agency N.W. Ayer. The agency set an ambitious goal, they set out to: “create a situation where almost every person pledging marriage feels compelled to acquire a diamond engagement ring.”
A U.S. promotional campaign was planned and it focused on telling every guy (and maybe even more important every girl) that he absolutely needed to give his special her a diamond ring (and diamond jewelry) to express his true love and lasting commitment, because, just like his love and commitment, ‘a diamond is forever.’
“The agency wanted to make it look like diamonds were everywhere, and they started by using celebrities in the media. “The big ones sell the little ones,” said Dorthy Digham, a publicist for De Beers at N.W. Ayer.”
How Diamonds Became Forever,The New York Times
The “A Diamond is Forever” campaign was so successful the U.S. became, and still is at $9 billion a year, the world’s largest diamond jewelry market.
The same campaign was also a huge success in Japan with diamonds replacing pearls in the 1950s. Today China and India’s 2.6 billion people are targeted – because only diamonds can show her how you truly feel.
“If you look back 20 years, there was no diamond acquisition culture in China. But today in Beijing, Shanghai, and Guangzhou, there is an obvious launch pad. 40% of brides in those cities are getting diamond engagement rings. It was zero 15 years ago.” Gareth Penny, CEO DeBeers
The decade to come will be the years of the diamond. According to a Bain & Company report global rough-diamond demand in value terms should increase at a compound annual rate of 5.1%, to $26 billion by 2023.
“The appetite for high-quality diamonds in China and India is growing,” notes Gerhard Prinsloo, the author of the report.” In terms of market share, India and China will represent 30% by 2020, equal to that of the United States. Supply should only increase by 2.8% per year, leading to a structural shortage.”
Diamond demand, over the next decade or so, will be particularly driven by India and China due to a doubling of the middle class in these countries (of the two China has the fastest growing demand, jumping to a share of about 15 percent of the world’s diamond market from less than three percent in 2003).
There’s no shortage of future markets – it won’t be long before one out of every four people on the planet is going to be an African. They don’t know it yet but there’s diamond jewelry in most of their futures.

Current diamond demand is 175 million carats, by 2020 demand is expected to reach 247 million carats.
Two new diamond mines are expected to start production in Canada over the next few years – Gahcho Kué and Renard.
Dominion Diamond’s Ekati mine will increase production by starting to mine the Misery pipe.
Globally there are three large mines scheduled to start operations within the next four years: Lace, Botuobinskaya and Bunder. The last major mine discovery came a decade ago in India, at Rio Tinto’s yet to be completed Bunder project.
LUKoil’s Grib mine started production this earlier this year and Alrosa’s Karpinskogo mine started production in October.
Some of the largest and most important mines in the world are running out of diamonds to mine – Orapa and Jwaneng (Botswana) have less than 15 years of production left at current parameters. Orapa and Jwaneng are the largest diamond mines in terms of total dollar value produced.
The alluvial Marange diamond fields (Zimbabwe – 13% of global rough supply in 2013) are expected to produce eight million carats of diamonds in 2014. Mining is transitioning from easily accessible loose surface gravel to hard conglomerate rock. Most miners are not willing to make the necessary investment at current rough diamond prices. Conglomerate rock grades are 0.4-0.5 carats per tonne while surface grades were 3.75 cpt
Marange is the largest producing project in the world in terms of total carats produced. It is third in terms of total dollar value after Botwana’s Orapa and Jwaneng mines.
Pikoo Kimberlite Field
Let’s take a look at what might well be the world’s newest emerging diamond district.
Stornoway Diamond Corp.’s (TSX – SWY) regional exploration programs were intended to test the diamond potential of the Sask craton in north-central Saskatchewan.
 Exploration work included KIM sampling programs, an airborne geophysical survey (to detect magnetic differences on the ground), prospecting and geophysical anomaly checking – ground truthing of targets.
Kimberlite indicator mineral (KIM) sampling consists of digging a hole and taking up to 20 kg of glacial till – dirt – and sending it to a laboratory for the recovery and analysis of indicator minerals – if any.
Assortment of kimberlitic indicator minerals including purple pyrope, red, orange and pink pyrope garnets, chromian diopside, picroilmenite and chromite.
Indicator minerals such as pyrope garnets, chromites, and ilmenites are used as kimberlite tracers because these KIMs are found in the same place diamonds form, deep beneath the earth’s surface in the diamond stability field.
….read page 2 HERE
China now surpasses the U.S. in real economic terms. “Real”, most simply defined, is the production and consumption of actual goods and services with prices ignored. In that “real” process the Chinese economy becomes a receptacle for the resources of the world, tangible and human. Some in the world, like Agri-Equities, that service those needs have benefitted, and will certainly do so in the future. Those that sell to the biggest customers in the world, China, will be the success stories. Top tier Agri-Equities are one of those beneficiaries. Our index of First Tier Agri-Equities, as shown in chart below, is at a new, all time high for the second month. That action was recently confirmed by composite Agri-Equity Index also hitting a new all time high recently.

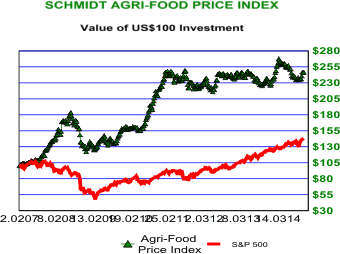 Many investors have not been aware of the exceptional long-term returns in Agri-Equities because of a general misunderstanding of Agri-Commodities, and of commodities in general. As the Agri-Food Price Index, which measures the price trend of 17 Agri-Commodities, portrays in chart to right, the price of a portfolio of Agri-Commodities has not collapsed as many forecast this time last year. Rather, this index hit an last all time high end of March. Reason for that is as the Chinese economy has grown larger than that of the U.S. the incomes of consumers in China have risen. Those richer individuals like to eat better, every day. The propensity of China to buy soybeans, corn, sorghum, etc. far exceeds that for over priced electronic toys masquerading as cell phones.
Agri-Companies service and benefit from producers of a vast array of Agri-Commodities. Above chart shows percentage price changes for 17 important Agri-Commodities thus far in 2014.
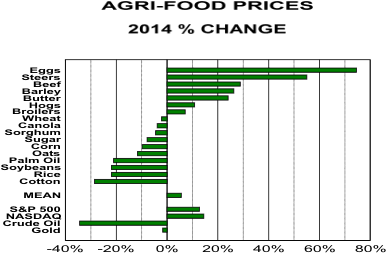
Those steaks long forgotten in the back of your freezer, beef in chart, have easily out performed the NASDAQ. So would have a pound of butter. Cattle ranchers would have made a clear mistake selling their cattle, and buying NASDAQ stocks. And due to the natural tendencies of Agri-Commodities price of U.S. corn, one of the lower bars, is likely to perform better than the NASDAQ in the year ahead.
Oil prices have indeed collapsed while prices of many Agri-Commodities have not. Both are commodities as are the ores, iron, copper, and Gold for example. The economic drivers of those three commodity groups are different. While China may buy less copper or iron ore in any one year, we can assure you that Chinese consumers will eat every day.
The other mistakes made widely by the investment community are fixation on a single or small set of Agri-Commodities and extrapolating a price trend indefinitely into the future. Corn is a good example of both tendencies. Corn, while clearly important to some regions, is not the total of Agri-Foods. Corn prices did fall, but those prices are not falling. Low, or high, Agri-Commodity prices have a natural tendency to create higher, or lower, prices in the future. For that reasons, U.S. corn prices appear to have bottomed, and are likely to rise over the coming year.
In building a portfolio one selects companies that are expected to receive, or be in front of, a cash flow. With the largest real economy in the world, China, now locked into the importation of Agri-Foods to satisfy the needs of its citizens, that country is also going to be “exporting money” in exchange for those Agri-Foods. Recipients of that cash flow will include the Agri-Equities. Chinese consumers can live quite happily without iPhones, but not without Agri-Foods. Agri-Equities allow your portfolio to benefit from largest real economy in the world. Why would one ignore such an opportunity?
AGRI-FOOD THOUGHTS is from Ned W. Schmidt,CFA, publisher of The Agri-Food Value View, a monthly exploration of the Agri-Food grand cycle being created by China, India, and Agri-Energy. To learn more, use this link: www.agrifoodvalueview.com Follow: @AgriFoodVV


-
I know Mike is a very solid investor and respect his opinions very much. So if he says pay attention to this or that - I will.
~ Dale G.
-
I've started managing my own investments so view Michael's site as a one-stop shop from which to get information and perspectives.
~ Dave E.
-
Michael offers easy reading, honest, common sense information that anyone can use in a practical manner.
~ der_al.
-
A sane voice in a scrambled investment world.
~ Ed R.
Inside Edge Pro Contributors

Greg Weldon

Josef Schachter

Tyler Bollhorn

Ryan Irvine

Paul Beattie

Martin Straith

Patrick Ceresna

Mark Leibovit

James Thorne

Victor Adair