
Energy & Commodities
Be sure to read the analysis of the US Dollar Below – Money Talks Ed
Trading position (short-term; our opinion): No positions are justified from the risk/reward perspective.
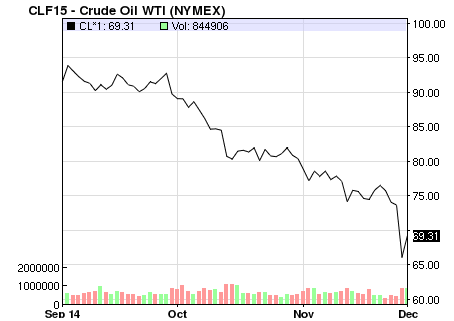
On Friday, crude oil lost 1.65% as a stronger U.S. dollar and news that Saudi Arabia lowered the price of oil for buyers in the U.S. and Asia continued to weight. As a result, light crude moved lower for the fourth time in a row and closed the week at its lowest level since mid-Jul 2009.
On Friday, the Labor Department showed that the U.S. economy added 321,000 jobs in the previous month, beating analysts’ expectations for jobs growth of 225,000. Additionally, the U.S. unemployment rate remained unchanged at 5.8% last month. These stronger-than-expected numbers pushed the USD Index to a fresh multi-year high of 89.49, making crude oil less attractive in dollar-denominated exchanges, especially among investors holding other currencies. On top of that, news that Saudi Arabia lowered the price of oil for buyers in the U.S. and Asia continued to weight, which helped soften the price of crude oil. In this environment, light crude dropped once again, approaching the support zone. Time for rebound or new lows? (charts courtesy of http://stockcharts.com


Looking at the above charts, we see that crude oil moved lower for the fourth time in a row and closed the week at its lowest level since mid-Jul 2009. In our opinion, this suggests that we’ll see further deterioration in the coming day and a test of the strength of the recent low and the solid support zone (created by the 61.8% Fibonacci retracement and the Aug and Sep 2009 lows). If this area holds, we could see a post double-bottom rally. In this case, crude oil would increase to at least to the last Monday’s high of $69.54. What could happen if oil bears win and push the commodity lower? If crude oil extends losses and broke below the above-mentioned support zone, we could see a drop even to around $58.32-$60, where the Jul 2009 lows (in terms of intraday and weekly closing prices) are.
Nevertheless, before we see a realization of any of these scenarios, we would like to take a closer look at the current situation in the USD Index as the U.S. dollar was one of the major forces, which affected the price of the commodity in recent weeks.

On the above chart, we see that the USD Index moved higher earlier this month and reached the strong resistance area created by the 2009 and 2010 highs. On Friday, we saw a breakout above these levels, which is a strong bullish signal that suggests further increase to the next upside target – the 38.2% Fibonacci retracement level based on the entire 2002 – 2008 decline (around 89.80). What does it mean for crude oil? Based on a negative correlation between the commodity and the U.S. currency that we noticed in recent weeks, it seems that light crude could move lower once again in the near future. Nevertheless, we should keep in mind that despite the greenback’s new high, crude oil didn’t hit a fresh multi-year low on Friday, which is positive sign for the commodity.
Taking the above into account, and combining it with the fact that the space for further growth in the USD Index seems limited, we think that even if the USD Index moves little higher, crude oil could show strength – similarly to what we saw in May, the first part of Jun and also in Sep. Additionally, if the index reverses and moves lower in the coming days, we’ll see a rebound in crude oil as a weaker U.S. dollar makes the commodity less expensive for buyers in other currencies.
Summing up, the overall situation is still too unclear to open any positions as crude oil is still trading in a narrow range between the support and resistance areas. However, taking into account the current situation in the USD Index and a negative correlation between the commodity and the U.S. currency, it seems to us that trend reversals in both cases are just around the corner. Nevertheless, until the uncertainty about future movements is in play, we believe that waiting on the sidelines for the confirmation that the final bottom is in is the best choice at the moment.
Very short-term outlook: mixed with bullish bias
Short-term outlook: mixed
MT outlook: mixed
LT outlook: bullish
Trading position (short-term; our opinion): No positions are justified from the risk/reward perspective at the moment, however, if last week’s upward move won’t be followed by a fresh multi-year low and we’ll see a breakout above the 38.2% Fibonacci retracement (based on the recent downward move), we’ll consider opening long positions. Until this time, waiting on the sidelines for the confirmation that the final bottom is in is the best choice

The gyrations of financial markets can be startling. I am reminded of the following words of wisdom attributed to the economist John Maynard Keynes:
“The market can remain irrational longer than you can remain solvent.”
The words of wisdom reportedly were born in the 1920s after Keynes unsuccessfully performed a series of highly leveraged trades (short-term currency trading on high margin), the result of which was a humbling by the market. In this case, humbling is apparently another world for “wipe out.”
In the past number of weeks, these startling gyrations have been none more apparent than in the price of oil and energy related stocks.
Ed Note: HERE for yesterday’s closing Crude Chart & today’s ongoing hourly chart click HERE
Since September, West Texas Intermediate has lost close to 30%. Given its pervasiveness in the global economy, it is shocking repricing could have far reaching implication, particularly for energy dependant economies such as Canada.
Those implications, of course, are largely dependent on the drop continuing and perhaps more importantly persisting at low relative levels (current range or lower). In this case, lower oil likely supports a continued lower Canadian dollar, weaker government revenues, slower growth in Western Canada (particularly Alberta), and generally lower stock prices for Canadian companies associated with oil. If OPEC continues or increases production for an extended period, in an effort to stick it to its Middle East rivals — curtailing North American shale oil growth as a collateral benefit — then prices are likely to stay relatively low until the corrective measure of lower production that low prices produces kicks in. This would likely be relatively painful for the North American oil sector and dire for those companies heavily levered with high costs of production.
If oil snaps back and trades in the US$80 range of higher, then the sell-off has already been overdone. The truth is likely in between the two scenarios.
So should investors be mortgaging the house and jumping back into anything oil related. The answer is no. Like Keynes said, “the market can remain irrational longer than you can remain solvent.” For those that would point out that the market is acting rationally with the current oil pricing environment, we would point out it had then acted relatively irrationally for the past 3-years pricing crude above US$90 a barrel (well above US$100 for a good deal of the time). Either way, the market can stay irrational in the near term, crushing those that speculate (even rationally) on margin.
As an investor, with a long-term horizon, you should always be alert to potential opportunities, but there is no hurry to be overexposed to oil at present. In fact, if you have not already, paring down exposure to crude is an option – we find Canadian investors are often over exposed to commodities in general.
We think there is likely to be some very select opportunities in the upcoming tax-loss selling season which typically peaks sometime in mid-December. Investors looking to find value with an eye to where these companies will be 1-3 years from now might find some babies are thrown out with the bathwater at that time. Remember to concentrate on companies with strong balance sheets (high net cash positions) that have historically produced strong profits and high return on equity.
KeyStone has two Special Reports slated for upcoming release – our 2015 Cash Rich Profitable Small-Cap Report and a Special 2015 Opportunities Report. Both will take a look at potential long-term winning investments that have been “thrown out with the proverbial bath water” in tax loss selling. We kicked off our 2015 Cash Rich Coverage with a preview Initial Coverage Report this past week on an underfollowed Canadian tech stock with 33% of its market capitalization in cash, zero debt and growth on the horizon.
Glentel Proves to be a Big Long-Term Winner
To further pick up on our Keynes theme, we take a quick look at BC-based Glentel Inc. (GLN:TSX). This is a stock that has been on our Focus BUY list since September 2006 when its shares traded in the $2.93 range and we have recommended it a number of times under the $9.00 range over that past number of years in our research. KeyStone most recently re-issued a BUY on the stock in July of 2013 at $17.76.
Despite continuing to be a free cash flow generating machine, the markets sold off the stock due to an unprofitable expansion into the Aussie market and a slowing of overall growth. The stock suffered this past year briefly trading under $10 once again, as investors lost patience. A number of times our clients questioned whether they should sell the stock given the poor recent share price performance. While we recognized the missteps in Australia, the cash generation in North America remained strong and the valued was still there. As such, we maintained our HOLD on the stock as the markets, in the near-term remained irrational.
This past Friday, we were happy to report our patience and belief that the intrinsic value of Glentel would eventually be recognized paid off. BCE Inc. (BCE:TSX) announced it would acquire all of the issued and outstanding shares of Glentel for $26.50 per share in a combination of cash and BCE shares, sending Glentel’s shares soaring. The transaction represents a premium of 121% based on the 10-day volume weighted trading average share price of Glentel on the TSX.
Essentially, the markets irrational near-term negativity had Glentels’ stock trading over 100% lower than the value at which a large investor was willing to buy it at.
Indeed, the market can stay irrational for a long time, but we believe if you are patient and unlevered, value is eventually rewarded.
In Glentel’s case — handsomely rewarded.
KeyStone’s Latest Reports Section
11/28/2014
NATIONAL AND INTERNATIONAL WIRELESS RETAILER GLENTEL RECEIVES 121% TAKEOVER BID FROM BCE INC. – SELL
Disclaimer | ©2014 KeyStone Financial Publishing Corp.


In this week’s issue:
- Weekly Commentary
- Strategy of the Week
- Stocks That Meet The Featured Strategy
In This Week’s Issue:
– Stockscores’ Market Minutes Video – Free Getting Started Videos
– Stockscores Trader Training – Currency Exchange When Trading an RRSP
– Stock Features of the Week – Stockscores Simple Weekly
Stockscores Market Minutes Video – Free Getting Started Videos
This week, I highlight the free videos found in the Getting Started area of the Stockscores Education Center and show where the risks are in the various markets that I track each week.
Trader Training – Currency Exchange When Trading An RRSP or TFSA
Historically, RRSP and TFSA accounts have been in Canadian Dollars with no ability to trade US listed stocks without incurring the currency exchange. This put a real limit on a trader’s ability to trade since so many good opportunities come from the US stock markets. It is not that you could not trade US listed stocks, it is just that the currency exchange on the trades made transaction costs very high.
If you bought a US listed stock, you pay the currency conversion in to US dollars when you buy. Then, when you exit the trade, you paid the currency conversion back in to Canadian dollars and typically the spread in rates was expensive. It was easy to incur a few hundred dollars in transaction costs to do this, making active trading for smaller percentage moves a difficult strategy to be successful at.
That meant that most Canadian traders who used their registered accounts for trading were forced to focus in on the Canadian market. That is ok when the Canadian market is strong, like it was for the first half of 2014, but when it is trending lower as it is now doing, Canadian traders will look south of the border for opportunities. With new US denominated RRSP and TFSA accounts, this is now possible.
Recently, Desjardins securities announced the availability of US Dollar denominated registered accounts (other brokerages may offer something similar but most do not). Now, a Canadian trader who wants to use their RRSP or TFSA to trade US listed stocks can do so without the burdensome in and out currency exchange fees of the past.
Here is a page with more information on this account option from Disnat:
https://www.disnat.com/regimes-us/index_en.aspx
This is a very important change that I recommend all traders who are using their Registered accounts consider.
There are other issues to consider when trading in a registered account. As I have discussed recently, leverage (trading on margin) is not allowed which means that some very disciplined traders could earn more after tax outside of these tax sheltered accounts because leverage increase buying power. It is also important to check with your accountant to get a final opinion on the viability of your trading strategy inside an RRSP or TFSA.
If you trade in an RRSP and have been frustrated in the past by the high transaction costs when trading US stocks, be sure to check out these new US Dollar RRSP and TFSA accounts from Disnat.
![]()
I went in search of good weekly charts this week using the Stockscores Simple Weekly strategy, taught in the Stockscores Investor course and utilizing the Market Scan of the same name. Here are two charts that stand out:
Here are two stocks that I found this morning that look interesting:
1. T.IFP
T.IFP is a Canadian Lumber stock, a sector that has been strong lately because of the weakening Canadian dollar and an improving US housing market. The stock recently broke to new highs after spending most of 2014 under the $18 resistance level. Support at $17.

2. HBAN
HBAN is a US Regional Bank, a sector that broke out last week. HBAN did the same, breaking to new highs through long standing resistance at $10.25. Support at $9.90.

References
- Get the Stockscore on any of over 20,000 North American stocks.
- Background on the theories used by Stockscores.
- Strategies that can help you find new opportunities.
- Scan the market using extensive filter criteria.
- Build a portfolio of stocks and view a slide show of their charts.
- See which sectors are leading the market, and their components.
Disclaimer
This is not an investment advisory, and should not be used to make investment decisions. Information in Stockscores Perspectives is often opinionated and should be considered for information purposes only. No stock exchange anywhere has approved or disapproved of the information contained herein. There is no express or implied solicitation to buy or sell securities. The writers and editors of Perspectives may have positions in the stocks discussed above and may trade in the stocks mentioned. Don’t consider buying or selling any stock without conducting your own due diligenc


Dec 9, 2014
- Is there a strong bull flag pattern in play on the daily gold chart? For the likely answer, please click here or the chart now.
- The US stock market has lost upside momentum, and the falling price of oil threatens to create an “Armageddon” type of event in the junk bond market, yet gold looks and feels superb.
- Please click here now . In addition to the bullish flag pattern, there’s an inverse head and shoulder bull continuation pattern that looks solid. The target of this pattern is the $1275 – $1280 area. Is the Western gold community going to receive an early Christmas present, in the form of another rally in the gold price? These charts suggest they are!
- For a closer look at the gold price action, please click here now. That’s the hourly bars chart, which I use to magnify both the flag and the head and shoulders pattern. A solid rally seems imminent.
- I think the dollar may be about to fall fairly hard against the Japanese yen, and that could help to activate the bullish patterns on the gold charts.
- Please click here now. That’s the daily chart, showing the dollar down again against the yen, in early trading today. Note the bearish non-confirmation event in play on my 14,7,7 Stochastics oscillator.
- Many gold bears, like Jeff Currie of Goldman Sachs, appear to be somewhat stunned that when gold briefly traded under $1180, it failed to fall quickly to $1050. Instead, while the yen has suffered a truly horrific collapse, gold has rallied back to $1200.
- The error in gold market analysis by the bears can largely be explained by their complete failure to predict the recovery of demand in India. The recovery has been spectacular, and I predict it’s not just here to stay, but here to soar, on what I’m predicting will be double digit GDP growth.
- Please click here now. That’s the hourly bars chart for oil. I was a light buyer of oil stocks as oil arrived in the $73 area.
- I’ll be a much heavier buyer at $55 and $40, and I’ll ask the gold community to buy if the price falls there, but the big news about lower priced oil, is related to its powerful effects on the Indian economy and the nation’s current account.
- Please click here now . Indian inflation just fell to a record low. The mafia appears to have some influence on the Indian finance ministry, but under what appears to be substantial pressure from the central bank, I expect India to reduce and possibly completely eliminate gold import duties by the spring of 2015, and perhaps sooner.
- There is simply too much pressure to cut these duties, with smuggling totally out of control, record low inflation, and falling oil prices that could soon turn the current account deficit into a surplus.
- The chop in gold duties will boost government tax revenues. It will take hundreds of thousands of jewellery workers off the breadline, and put them back to work. Most importantly (for the Western gold community), it will boost demand for gold.
- China is also in the news, and the news is excellent. I think most analysts are seriously underestimating the importance of the Chinese central bank’s decision, made just days ago, which allows more jewellers to import gold.
- Also, Hong Kong’s top gold industry players have just formed a major link with the Shenzhen jewellery manufacturing area in China, where about 70% of all Chinese gold jewellery is manufactured.
- Please click here now. This new Hong Kong/China gold market synergy is very bullish for gold. It should quickly produce a significant increase in Chinese gold demand. To view the synergy in more detail, please click here now.
- At the current point in time, gold is clearly a pillar of strength, both fundamentally and technically. While events in China and India revolve mainly around gold jewellery demand ramp-up, America may be set to become a key driver of gold stocks. Here’s why:
- I’ve argued that the Fed would reduce its balance sheet, and that’s in play now. I’ve predicted that the reduction would create a smaller money supply, allowing for a surprising upturn in money velocity. That is happening at the same time as wage pressures grow, and commercial banks are nudged by the Fed to begin making more aggressive loans with their reserves.
- Those reserves exceed two trillion dollars. Alan Greenspan has referred to their potential movement as inflationary tinder, and rightly so.
- Influential economist Mike Ivanovitch is respected in the mainstream financial community. To understand his new views on US inflation dangers, please click here now. Interest rates will rise, but not much, because commercial banks are set to lend out reserves, and flood the system with liquidity.
- Mike ended his discussion with this strong statement: “Equities are still my preferred asset class — provided the portfolios are carefully reviewed toward a defensive posture. Also, think of putting some of that yellow stuff under your Christmas tree.” –CNBC News, December 8, 2014.
- While most gold analysts are focused on the fear trade, I think it’s too early in the economic cycle for that. Institutional money managers focused on gold bullion ETFs during the 2008 crisis. They saw system risk, and focused on bullion rather than gold stocks. I think that as the inflation I’m predicting begins to appear in 2015, the money managers will focus on gold stocks much more than bullion.
- On that note, please click here now. That’s the daily chart for GDX. The downtrend line has been clearly penetrated, and there’s an irregular drifting rectangle pattern in play. My short term target is $22. It’s tax-loss selling season. As a result, gold stocks are trading erratically, even though gold itself is doing well.
- A nice gold stocks rally should begin early in January. That’s just three weeks away. My suggestion is to put some quality gold stocks under the Christmas tree, and get ready for a super year in 2015!
Dec 9, 2014
Stewart Thomson
Graceland Updates
website: www.gracelandupdates.com
email for questions: stewart@gracelandupdates.com
email to request the free reports: freereports@gracelandupdates.com
Tuesday Dec 9, 2014
Special Offer for Money Talks readers: Send an email to freereports@gracelandupdates.comand I’ll send you my free “Seniors Six Pack” report. In it, I show you my key buy and sell points for the top six senior gold stocks for the next 12 months.
Graceland Updates Subscription Service: Note we are privacy oriented. We accept cheques. And credit cards thru PayPal only on our website. For your protection we don’t see your credit card information. Only PayPal does.
Subscribe via major credit cards at Graceland Updates – or make checks payable to: “Stewart Thomson” Mail to: Stewart Thomson / 1276 Lakeview Drive / Oakville, Ontario L6H 2M8 / Canada
Stewart Thomson is a retired Merrill Lynch broker. Stewart writes the Graceland Updates daily between 4am-7am. They are sent out around 8am. The newsletter is attractively priced and the format is a unique numbered point form; giving clarity to each point and saving valuable reading time.
Risks, Disclaimers, Legal
Stewart Thomson is no longer an investment advisor. The information provided by Stewart and Graceland Updates is for general information purposes only. Before taking any action on any investment, it is imperative that you consult with multiple properly licensed, experienced and qualifed investment advisors and get numerous opinions before taking any action. Your minimum risk on any investment in the world is 100% loss of all your money. You may be taking or preparing to take leveraged positions in investments and not know it, exposing yourself to unlimited risks. This is highly concerning if you are an invetor in any derivatives products. There is an approx $700 trillion OTC Derivatives Iceberg with a tiny portion written off officially. The bottom line:
 On the heels of continued chaos around the globe and with many stock markets hitting new highs, today a 40-year market veteran sent King World News a powerful piece discussing the fact that the New World Order “gangs” are now pushing the world to the brink. Below is what Robert Fitzwilson, founder of The Portola Group, had to say in this exclusive piece for King World News.
Continue reading the Robert Fitzwilson piece HERE

-
I know Mike is a very solid investor and respect his opinions very much. So if he says pay attention to this or that - I will.
~ Dale G.
-
I've started managing my own investments so view Michael's site as a one-stop shop from which to get information and perspectives.
~ Dave E.
-
Michael offers easy reading, honest, common sense information that anyone can use in a practical manner.
~ der_al.
-
A sane voice in a scrambled investment world.
~ Ed R.
Inside Edge Pro Contributors

Greg Weldon

Josef Schachter

Tyler Bollhorn

Ryan Irvine

Paul Beattie

Martin Straith

Patrick Ceresna

Mark Leibovit

James Thorne

Victor Adair