Bonds & Interest Rates

The Fed Meets This Week Dealing With Alarming Bond Bubble

imagesThe Bond Market Bubble is Reaching Epic Proportions

The 10-Year Bond now has a Yield of 2.08% right before the all-important Fed Quarterly Meeting and Press Conference this Wednesday, the 10-Year basically lost 24 basis points in a week, and mind you the week right after the strongest Employment Report (a positive 321,000 jobs added for the month) since the Financial Crisis, capping what has been a remarkable year in added jobs to the US economy, even wages spiked 0.4 % with strong upward employment revisions for the prior months. In short, in a normal functioning Bond Market Yields should be rising with improved economic conditions. Especially in a week with a robust Retail Sales Report up 0.7 % for the month. Bond Yields in the US should be much higher given the strong economic performance for 2014, and the Fed not only exiting QE, but about to start raising rates in 2015.

Too Much Cheap Money Sloshing Around Financial Markets

In short there is just way too much liquidity in the system, and buying of any assets is what follows regardless of price or the fundamentals, and the Bond Market is such a bubble right now that the Fed needs to start pricking it fast before it crashes all at once where everyone tries to get out at the same time, which of course they cannot do. This is where a responsible Fed comes in and prepares the Bond Market for the inevitable Rate Hikes in 2015. (more on this subject Low Rates and QE are Deflationary at the Zero Bound)

Low Gasoline Prices are Inflationary in the Big Picture
 
The latest argument for inflating the bond market bubble has been the drop in oil prices indicating strong deflationary pressures but this is just a poor understanding of economic theory. High oil and gasoline prices are deflationary over the long-term whereas low oil and gasoline prices are stimulative for economic growth, and actually inflationary over the long-term. And I think the Fed economists are sophisticated enough to get this relationship, that in fact lower gasoline prices will add to GDP growth in the coming quarters, and put even more pressures on inflation with a transfer from the bad comps of energy prices year on year, over to other core components as this new found wealth by consumers in the form of a massive tax cut finds its way into other buckets like dining and retail expenditures, all of which have additive effects for the US economy. In short cheaper energy costs are a net positive for the global economy, it leads to more productive and sustainable economic growth. 

Wages Starting to Spike

Watch out for wages, they have been bubbling under the surface for a while, slowly rising underneath everyone`s negative outlook on the subject, and with an ever tightening labor market this is the area to watch for real runaway inflation in the economy. A 0.4 % spike in wages for a month is something to take notice of, for example extrapolate this on an annual basis and 0.4 % adds up real quick to runaway inflation. So expect there might be a slight lag as consumers feel comfortable with the extra money in their pockets but eventually this money finds its way into other spending buckets so there should be a transfer from the energy component to the core inflation reading. 
 
Oil Bubble Bursts, Next Up Bond Markets
It is obvious that there is too much liquidity in the financial system as essentially bonds and stocks are near their all-time highs at the same time, and oil would have been there too if it wasn`t for the fact that 7 years of QE artificially inflated high oil prices motivated a lot of people to start producing oil in the US and around the globe and we finally have an oversupplied oil market and essentially a price war to compete for global market share. The old adage there is no cure for high prices like high prices applies here. And there is no cure for low wages like low wages in a tightening labor market, and this is the inflation boogie man that is currently flying under the radar right now in financial markets. 
 
US Economy Running Hot
 
An economy cannot add this many jobs in a year without market consequences, and so far the bond market has been able to do what it wants which is take advantage of cheap money and chase yield at any price without regards to downside risks. We are already seeing signs of the tightening labor market here in the US as employees are now quitting their jobs to take advantage of better opportunities in the labor market, this is all indicative of higher wages and increased inflation pressures in the economy for 2105. 
 
Much Lower Oil & Much Higher Interest Rates as Lower Oil is Stimulative
The low oil prices means the Fed never raises rates argument is just flawed, look back in history of $30 a barrel oil, the economy wasn`t in a “deflationary death spiral” in fact it was quite robust and interest rates and bond yields were much higher by a large margin than these “Doomsday Recession Era” Rates that we currently have in the massive bond market bubble. 
 
All Bubbles Burst – No Cure for Financial Bubbles like Financial Bubbles
The only reason this bond bubble exists isn`t due to the lower price of oil, it is directly a result of too much cheap liquidity in the financial system and ridiculously low interest rates by central banks. Well the US economy by recent data points with 321,000 jobs created in a month, 0.4% monthly wage inflation, third quarter GDP revised up to 3.9%, Retail Sales Report up 0.7 % and lower gasoline prices adding additional stimulus to the US economy means the Fed will have to raise rates in bunches for 2015, and it is increasingly alarming that the bond market is as unprepared as a market can be going into this rising rate environment for 2015.


Gold Market Update

If we lived in a normal word of fiscal propriety, the falling oil price would be viewed as something to celebrate, as it reduces costs across the board, and should theoretically boost the economy, but we live in an abnormal debt-wracked world where instead fears are surfacing that the plunging oil price will trigger a series of cascading loan defaults that have the potential to collapse the system – already world stockmarkets are buckling. If things really start to unravel it should provide the perfect excuse to bring in global coordinated QE, which we have been moving towards over the past few years, albeit on an ad hoc basis, whose underlying purpose will be to maintain interest rates at zero to stop the system collapsing, and to push the bill for the mess onto the little guy, whose standard of living will be progressively eroded by QE engendered inflation. At what point will they ride to the rescue with their global QE program? – that is a matter of conjecture, but we can presume that they will wait until things get sufficiently bad that people are starting to clamor for it so that it becomes politically acceptable and they can get away with it. 

Coordinated global QE should be good for the gold price in all major currencies, for the simple reason that money will be losing value steadily so that gold, which is real money, must advance to compensate for this. Looked at from this point of view it is remarkable that gold has corrected as far as it has over the past several years.

Right now gold appears to be in a base building process as its rate of decline has slowed as we arrive at what is believed to be the end of its long corrective phase from its 2011 peak. On its 15-year chart we can see that there was very little follow through after it broke down from its long-term uptrend and beneath the support at last year’s lows – one would have expected it to drop quite quickly back to the next important support level in the $100 area – instead it hopped back above the failed support. This lack of follow through is regarded as a positive sign, especially as the dollar has remained resilient in the recent past.

gold15year151214

…..continue reading for more analysis & 12 more charts HERE

Market Turning Points

An analysis of the Stock Market, Bonds, US Dollar, Gold & Oi markets using technical analysis comprised of Cycles – Breadth – P&F and Fibonacci price projections and occasional Elliott Wave analysis – Editor Money Talks

“By the Law of Periodical Repetition, everything which has happened once must happen again, and again, and again — and not capriciously, but at regular periods, and each thing in its own period, not another’s, and each obeying its own law… The same Nature which delights in periodical repetition in the sky is the Nature which orders the affairs of the earth. Let us not underrate the value of that hint.” ~ Mark Twain

Current Position of the Market

SPX: Long-term trend – Bull Market

Intermediate trend – A correction of currently indeterminate time frame has started. There is a good chance, however, that it will be more than a short-term correction.

Analysis of the short-term trend is done on a daily basis with the help of hourly charts. It is an important adjunct to the analysis of daily and weekly charts which discusses the course of longer market trends.

Daily market analysis of the short term trend is reserved for subscribers. If you would like to sign up for a FREE 4-week trial period of daily comments, please let me know at ajg@cybertrails.com.

TIME FOR A BOUNCE

Market Overview

For the week, SPX lost 77 points and DJIA a little over 700. Technical warnings had been accumulating for several weeks that a correction was due and, in the last couple of letters, I suggested that it could be imminent. Indeed it was! Now we must shift our focus onto how much longer and deeper this correction is likely to be. The bulls will be happy to hear that we are nearing a projection level at the same time that some positive divergence is showing in some indicators. This has always been a good recipe for a re-bound and I would expect it to start early next week. If this takes place, we will then try to estimate how much of a rebound it is likely to be. Let’s check on the indicators.

Momentum: The weekly MACD has turned down after showing some long-term negative divergence, but it remains strongly positive and, in spite of the decline, it has not yet made a bearish cross. The daily MACD has made a bearish cross but did so only after making a new high, hence no negative divergence. It also remains positive.

The weekly SRSI has just barely made a bearish cross and has dropped to neutral. The Daily has been negative for some time and oversold as well.

Breadth: The McClellan Oscillator is now in a downtrend and has reached a mildly oversold position. This has turned the Summation index back down. We’ll analyze it a little later.

Structure: Probably still in primary wave 3, but this could be the beginning of wave 4. More data is required to clarify.

Accumulation/distribution. Short-term: None! Long-term: Current top pattern nearly exhausted.

XIV: Has paced the SPX on the downside. It started to show some positive divergence late Friday.

Cycles: The short-term cycle low was ideally due on Friday, with the possibility of extending into Monday or Tuesday.

This decline could be a shot across the bow by the 7-year cycle topping.

Chart Analysis

We start with the weekly SPX (chart courtesy of QCharts, including others below) with the McClellan Summation Index posted underneath it.

36114 a
Larger Image

Once again, the top of the intermediate channel has stopped the SPX from moving higher but this time, it did

not take as long to cause a reversal. Of course, bears had help from plunging oil prices and the retracement was abrupt, but not too different from what happened in July. In fact, the July decline found support on its 21-wk MA and, since we almost reached it last week, I would not be surprised if we repeated the July pattern this coming week, but not necessarily with a new high just ahead. There are several contributing factors besides the MA support. For one, the cycle which, ostensibly, at least partly contributed to the decline is supposed to be at or near its low. Also, some of the leading indicators were showing deceleration at Friday’s close. As mentioned above, we are also approaching a Point & Figure projection which is supported by a Fib measurement. We cannot ignore these warnings and it would make sense if at least a temporary low would form in this area — perhaps as early as Monday. There is no accumulation in the short-term P&F chart, so we will either have to create a base if we want this bounce to have some upside potential, or have a V-bottom reversal similar to the one that was created at the last low. But the weekly indicators are still declining and the Summation index, especially, does not show that the selling pressure has been totally relieved in either its RSI or its MACD. That could suggest that this correction will continue until such a time as both of the weekly indicators are more ready for a reversal.


Let’s now turn to the daily chart. Right away, we can add a couple more factors to our list of reasons for finding support in this time frame. The blue line represents the bottom of an unfilled gap. Filling that gap may be what the market has in mind. It also corresponds to the 1991 top, and the bottom of the red channel. Certainly, those are enough reason to suggest that SPX could bounce from this fast-approaching level.

As far as what kind of a rally we might get from here, none of the oscillators shows positive divergence and I don’t think we should expect any worthwhile rally until some has developed. That does not mean that this decline will necessarily go beyond 1820 before finding a low. But that’s for another day to decide.

36114 b
Larger Image

On the hourly chart, we note that we tried to hold at the support provided by the blue trend line from 1344 which was penetrated once by the index on the way down to 1820 — but was again surpassed on the vicious rally that followed. This time, we are breaking it again and that could be significant; because if the 7-year cycle has topped, after we get through with this decline we may not be able to get back above it a second time. Of course this will largely depend on how far down we go, first.

The oscillators are all still in a declining mode as of Friday’s close. This, in itself, is a fair indication that we have not completed the downtrend and that we could expect more on Monday. Even the histograms have not even started to decelerate. I think we can expect the decline to continue into early next week although, as I mentioned above, there is some deceleration showing in the hourly charts of some of the leaders.

36114 c

Larger Image

There is one index which should be very helpful in deciding what kind of decline has started, and that is the IWM. On the P&F chart, that index has traded in a tight range over the past few weeks — between 115 and 118. We can currently count 12 points of accumulation or distribution, depending on which way price breaks from here. Should it break on the downside, we could expect the move to re-test its 1820 low, and that could suggest that the current market decline will roughly match the previous one. (Emphasis on roughly!)

Sentiment Indicators

The SentimenTrader appears to have stopped publishing its weekly chart of the sentiment gauge. If this is permanent, it’s going to be tough to find something that matches it (for free!). Jason may have felt that he was giving away too much valuable information. It’s not a huge loss, but it will be missed!

XIV (Inverse NYSE Volatility Index) – Leads and confirms market reversals.

The divergence shown by XIV proved to be a valuable warning that a top was occurring in the market. As you can see at the last low, XIV did not exhibit any divergence because of the V-bottom nature of the reversal. We’ll have to see if this holds true for the next low as well. At the moment, there is nothing showing that would lead us to assume that a low is in place.

36114 d

Larger Image

IWM (iShares Russell 2000) – Historically a market leader.

As you can see, IWM has made a flat congestion pattern which carries a 12 point potential in either direction. I would surmise that the downside carries a definite edge over the top, but let’s let the market confirm this.

36114 e

Larger Image

TLT (20+yr Treasury Bond Fund) – Normally runs contrary to the equities market.

Not surprisingly, TLT continued its up-move while the market was correcting. However, it has reached the top of its channel and has remained below the previous top, as well. That is divergence to the market. The question is, does it tell us something about TLT or the market? Or both!

36114 f

Larger Image

UUP (dollar ETF)

UUP is correcting after touching the top of its channel. If this is a correction of the entire move from the base, it could take a little while to conclude. Let’s give it some time.

36114 g

Larger Image

GLD (ETF for gold) – Runs contrary to the dollar index.

GLD made a low which coincided with the bottom of its 25-wk cycle. It has found temporary resistance at the top of a downtrend/channel line but, since there is still plenty of time left in the cycle’s up-phase it should be able to break through and extend its move. A potential correction developing in the dollar index should facilitate this move.

36114 h

Larger Image

USO (US Oil Fund)

USO’s decline, like oil’s, has been nothing short of a disaster for the bulls. Crude has dropped to about 58 dollars and may get some relief around 56, which is a partial P&F projection for WTIC. However, this will not be the end of the decline. There is a lower projection down to (at least) about 45. If this is where crude is heading, you can expect USO (and the market?) to follow.

36114 i

Larger Image

Summary

“SPX has reached an area of strong resistance which is reinforced by a cluster of Fibonacci targets.”

This was the first line of last week’s summary. It has been vindicated by last week’s action. The sharp correction which was experienced by most indices has now brought the SPX close to a potential support level which should create a bounce when reached. There are many short-term factors supporting this view. There are also many longer term factors warning us that this may not be the end of the decline.

Let’s keep a close eye on IWM. It could hold the key to what comes next over the following several weeks.

For a FREE 4-week trial, send an email to: info@marketurningpoints.com

Low Oil Prices Fuel Bonanza Increases in Ethanol Stocks

verdantfields580Chen Lin was one of the very few who foresaw the collapse in oil prices, so investors are well advised to pay attention to his advice. In this interview with The Energy Report, the author of the What is Chen Buying? What is Chen Selling? newsletter touts the prospects of a few oil companies that can prosper in the downturn, and explains why cheap oil means high profits for U.S. ethanol producers.

The Energy Report: You anticipated the collapse of the price of oil. How did you see this coming when so few others did?

Chen Lin: I was very fortunate. In an interview with The Energy Report last year, I expressed my fear that the price of oil could fall as low as $47 per barrel ($47/bbl). Because I invest in and follow a lot of fracking companies around the U.S. and Canada, I knew how fast North American oil production was increasing. Coincidentally, major Wall Street firms started to agree with my assessments one year later.


On Sept. 5, 2014, I alerted my subscribers that I had sold out a lot of energy stocks and reduced a lot of other positions to raise cash. Thanks to these timely sales, I’ve had a good year so far. But it’s been very tough watching oil fall as far and as fast as it has. 

As the oil price is in free fall, many companies with high leverage to the price will likely go under. Investors need to be extra careful in picking beaten-down stocks in the energy sector. My personal view is that the oil price is likely to continue to fall into next year, and possibly won’t find a bottom until next spring. I am watching it closely. It is very important to stay with companies that can survive this downturn, if not benefit from it. 

TER: Angelos Damaskos of Sector Investment Managers Ltd. told The Energy Report that increased North American oil production due to development in the shales has been balanced by decreased oil production elsewhere in the world. Therefore, he argued, there must be another cause for the oil price fall, and suggested significantly reduced buying from China. Do you agree? 

CL: No. China’s oil demand has been increasing, and there’s no way the Chinese government can hide it. China is the second-largest oil importer after the U.S. In fact, China’s oil imports have increased by as much as 50% recently because of the price reduction. China is filling up its strategic reserve. 

North American oil production has increased, so if demand stays constant, the Organization of the Petroleum Exporting Countries (OPEC) would have to reduce production to keep the price stable. 

TER: Since the price has fallen, does this suggest that OPEC has increased production?

CL: Possibly. I can understand Saudi Arabia getting sick of Canada and the U.S. taking its market share and acting accordingly. Partly because of the American military presence in the Gulf region, those countries cannot squeeze U.S. shale production without American permission. 

Another possibility is the U.S. acting to squeeze Vladimir Putin and Russia. The U.S. and the Saudis, acting together in the 1980s, brought the price of oil so low it was a big factor in the collapse of the Soviet Union. I can see the Saudis and the U.S. doing that again. You have Goldman Sachs calling for an oil price crash, and the Saudis are selling aggressively—and selling to the U.S. at much lower price than to Asia and Europe. The West Texas Intermediate (WTI) price is based in the U.S., and Saudi Arabia wants WTI to go down.

TER: About 90% of Saudi Arabia’s revenues come from oil production. How long can the country keep prices down? 

CL: When oil was over $100/bbl, Saudi Arabia built up its cash reserves, so it can easily ride out $80/bbl prices for 2–3 years. The real losers in this price war are oil producers with much higher costs—countries such as Russia and Iran. In November, the Russian ruble was defending 40 to the U.S. dollar; now it’s defending 50. 

TER: Back to China, are you worried or sanguine about the state of the Chinese economy? We hear stories about overleveraging, problems with debt and the banks, and a real estate bubble.

CL: All this is true. China definitely has a property bubble. Bank leverage is definitely high. The situation is not good and getting worse. But the Chinese government has more freedom to take action than the U.S. does, or the countries of the European Union do. 

Ideally, China needs to depreciate its currency to stimulate exports to Japan and Europe, its biggest trading partners. The U.S. would not allow devaluation, however, so China is somewhat stuck. But I believe China can weather this situation for some time. 

TER: Is the “revolution of rising expectations” a threat to China’s stability? People who have long been poor become inured to poverty. When they become a little bit richer, however, they come to expect ever-increasing prosperity. When this doesn’t happen, people can get very angry very quickly. 

CL: That’s a very good point. It’s a possibility. We must keep in mind, however, that the Chinese government retains strong control of the media and other means of popular discontent. Despite the recent problems, the current Chinese regime has been very popular because of its anti-corruption campaign and its moves against the state monopoly. The new regime’s honeymoon isn’t over yet and is likely to continue for the near term.

TER: How long before oil prices again reach $100/bbl? 

CL: It’s hard to say. The lower oil price will decrease production, but not immediately. This will occur in 2–3 years. As I see it, the drop in oil price will actually help the price reach $100/bbl in the future. Many oil companies are now reducing capital expenditures (capexes), so exploration is being curtailed. Fracking companies are reducing their activities. Ultimately, this must lead to higher prices.

TER: Lower oil production will lead to higher oil prices, but lower gold production hasn’t led to higher gold prices. What’s the difference?

CL: We cannot live one day without energy, without oil. Without oil, we cannot drive our cars, get to our jobs, heat our homes. We can, however, live without gold for a few years. Gold is more of a financial instrument than a commodity.

TER: How much damage will oil at less than $70/bbl cause to shale oil and oil sands operations? 

CL: Many companies in these spaces are cutting capexes by 20–30% for next year. Production could be down 20-30% in 2–3 years. 

TER: Shale oil and oil sands operations are, by their nature, very high capex. And shale oil wells don’t produce for long. Could three years of $70/bbl oil kill off shale oil? 

CL: No. I have checked with a lot of companies—some I own, some I follow—and the word is that prices of $50–60/bbl would be needed to kill shale oil.

TER: Now that the Republicans control both houses of Congress, will the Keystone XL Pipeline be approved?

CL: This is one of the top priorities for the Republicans in Congress. Though the recent efforts to approve the pipeline failed, Congress will likely bring it up next year. Keystone approval would be great news for Canada. Canadian oil producers have suffered so much, so I’m glad they would profit the most. The oil sands would benefit hugely as well. 

But this would be a long-term benefit because it will be years before Phase 4 would go into operation. In the near term, what could be a huge problem for the Canadian producers are new rail regulations coming into effect in 2015. This is in reaction to the many shipping accidents of recent years. These regulations will be really tough. They will raise shipping costs and reduce exports. Canadian oil companies are facing more pain before the Keystone starts.

TER: Which oil sands company is your favorite, and why? 

CL: I own Pan Orient Energy Corp. (POE:TSX.V). Its pilot oil sands project is in Alberta, but it also owns many conventional projects in Asia. Pan Orient is my favorite energy play because of its very strong balance sheet. The company just announced a $42.5M asset sale in Thailand. This brings its cash value, plus the other 50% of the Thai project, to CA$2.25 per share. It is trading now at $1.70/share. Beyond that, you get Canada and Indonesia for free. 

Pan Orient plans to sell its Canadian asset. But right now, that asset is valued, for share purposes, at zero. At rock bottom, it’s worth $100M. In Indonesia, Pan Orient’s partner will cover drilling costs for 2015. The company announced the Indonesia deal with Talisman Energy on Nov. 11, so its cash position will go even higher. In addition, Pan Orient will have an experienced partner with major Indonesia presence drilling on its very large concessions; the target is as large as half a billion barrels of oil equivalent. That’s a huge wild card the market didn’t expect. The company is in an ideal situation now because the cash position is there, Canada is producing, Thailand is producing, and the cash flow is covering the expenses. 

TER: Which pure oil play junior is your favorite? 

CL: Mart Resources Inc. (MMT:TSX.V) has been my home run of the past few years. I’ve already received a dividend that was more than my original investment. Mart just announced the new pipeline has started flowing. Once the new pipeline is fully ramped up, we should see the production triple, which will generate huge cash flow. Mart’s production cost is exceedingly low. 

TER: Is Mart seeking aggressively to expand its operations?

CL: It is. Mart is part of a consortium that has just acquired a new Nigerian asset from Royal Dutch Shell Plc (RDS.A:NYSE; RDS.B:NYSE), Total S.A. (TOT:NYSE) and Eni S.p.A. (E:NYSE). The consortium will control 45% of a block producing 30,000 barrels per day (30 Kbbl/d).

TER: Which natural gas juniors do you like? 

CL: I used to own Rex Energy Corp. (REXX:NASDAQ), but not anymore, the main issue being its heavily indebted balance sheet.

TER: Rex Energy is in the Appalachian and Illinois basins. How long before these regions are tapped out? 

CL: They will probably last for quite some time. Right now, prices are low, and producers aren’t generating much cash flow. But we may have a very cold winter, and natural gas stocks could be back in favor. And we might start to export natural gas from the U.S. and Canada as early as next year. That could be very positive in the long run. 

TER: Are we looking at a natural gas price crash due to overabundance?

CL: Some recent finds have been phenomenal, so the price could potentially go even lower. Hopefully, we can build up liquefied natural gas exports soon.

TER: Is there another company you like in this sector?

CL: One I do own is Cub Energy Inc. (KUB:TSX.V), which is drilling in Ukraine. Unfortunately, more than half of its production is in East Ukraine, a conflict area. It is still producing, but it cannot drill more wells. It is, however, getting good results from West Ukraine. Cub is a good, long-term Ukraine gas play. 

TER: The first oil shock was in 1973, 41 years ago. Since then alternative energy has been all the rage. But we remain essentially dependent on oil and gas, four decades later. Do you worry that the 30% decrease in the oil price could cripple alternative energy companies and their projects? 

CL: That depends. Some alternative energy companies will be hurt. One such company I own is Alter NRG Corp. (NRG:TSX; ANRGF:OTCQX). It uses plasma to burn garbage to generate natural gas that’s very clean, with no waste and no pollution. That could be attractive to such highly polluted countries as China and India. Currently, new garbage-burning plants in China generate a lot of resistance, but adopting plasma technology makes it much more attractive. 

Alter NRG has already built a plant in the United Kingdom (U.K.), and is building a second. In an island country like Britain, garbage is a huge problem. There is no room for landfills, so garbage must be shipped outside the country. There’s a high tipping fee, raised from consumers, to pay for collection. The natural gas price in the U.K. is very high as well. The return on investment in Alter NRG’s U.K. operations is very high, even after the fall in energy prices.

TER: Can you explain Alter NRG’s business model? 

CL: The tipping fee alone makes its U.K. projects worthwhile, so the natural gas generated is free. The company can sell the gas or use it to generate electricity, which is sold for a high price. And this is renewable electricity, so it is of premium value. The ash produced by incineration is pure, and can even be used in construction. 

I’ve been to Puerto Rico, another island nation, and I’ve talked to local people and companies that would love technology like Alter NRG’s. The only problem for this company is that it’s a long process from recognition of the technological benefits to government approval and construction. 

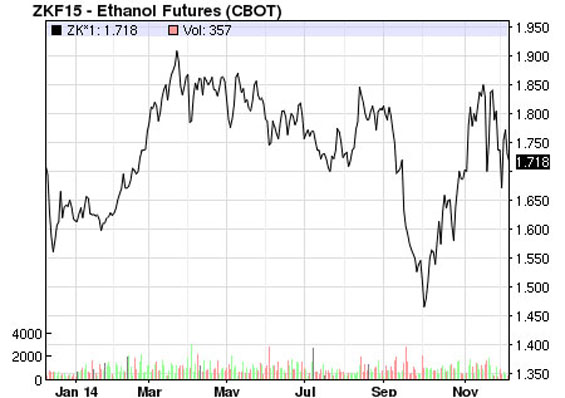
TER: Why do you believe the future is so bright for ethanol producers?

CL: In September, ethanol followed oil down in price. But there was a complete rebound and more in October. The conventional wisdom is that ethanol is considered part of gasoline, 10% by law. So when the oil price falls, and the gasoline price falls, the price of ethanol should fall too. That explains the coordinated short attacks on ethanol in the past two months. Shares of Pacific Ethanol Inc. (PEIX:NASDAQ) fell 60%, while the short interests in REX American Resources Corp. (REX:NYSE) more than tripled. I own both these companies, as well as Green Plains Renewable Energy Inc. (GPRE:NASDAQ)

The conventional wisdom about ethanol has been proved wrong. Lower oil and gas prices encourage more consumption. More gas consumption, by law, requires more ethanol—more ethanol, in fact, than can be produced. According to the Environmental Protection Agency, U.S. plants are running at 930,000–940,000 barrels per day. Maximum daily U.S. ethanol capacity is 925,000 barrels per day. That’s why the ethanol price rebounded sharply in October and is now higher than in the summer, when oil sold at $100/bbl. 

On the supply side, few ethanol plants are coming on line because it is very difficult to get Renewable Identification Number (RIN) permits from the Environmental Protection Agency. So don’t expect any major new plants in the next few years. This issue was discussed in detail during the question-and-answer session of the Great Plains’ recent conference call.

TER: But ethanol share prices are still depressed.

CL: That’s why I’m so excited. The oil index funds are short ethanol, but they don’t understand the situation. Last quarter, Pacific Ethanol beat its earnings estimate with $0.33/share. Its margin has since risen from $0.35/gallon to more than $1/gallon. Imagine how much money it’s making now. The company has some debt, but its cash exceeds that by $30M. The company is now considering a dividend and a share buyback, as is Green Plains.

REX American and Green Plains also boast robust balance sheets and record-high margins. I am bullish on ethanol stocks. 

chenterethanolchart

TER: The use of ethanol for fuel requires the diversion of agricultural products, which leads to higher food prices. We’ve seen significantly higher food prices in the last few years. Do you think it’s possible that, given the lower prices of oil and gas, politicians might cut the 10% requirement?

CL: Actually, they are looking to increase it to 15%. Thanks to genetic modification, harvests of corn and soybeans are at historic highs, and the commodities are priced at historic lows. That’s another reason why ethanol companies are so profitable. Input costs are at an all-time low, with output prices at an all-time high. 

TER: Do you think ethanol companies are a better bet than oil companies?

CL: I do, especially from now until the end of the year. We have a tax-loss selling season. I see a lot of funds potentially going out of business or facing heavy reduction. Meanwhile, ethanol is booming. 

Earlier, I mentioned the rail-transportation regulations coming into effect in 2015. They will be particularly beneficial for Pacific Ethanol because it is selling ethanol in California, and its price is based on the ethanol from the Corn Belt, in Iowa, which is transported by rail. Shipping costs will jump in 2015, so ethanol margins will increase. 

Again, by law, gasoline must contain at least 10% ethanol, and when shortages occur, the price of ethanol skyrockets. The law is the law. The most recent conference calls of Green Plains and Pacific Ethanol confirmed the coming, strong ethanol price. This is not reflected in share prices yet, which are already bound to increase greatly based on current margins. 

TER: Chen, thank you for your insights.

Chen Lin writes the popular stock newsletter What Is Chen Buying? What Is Chen Selling?, published and distributed by Taylor Hard Money Advisors Inc. While a doctoral candidate in aeronautical engineering at Princeton, Lin found his investment strategies were so profitable that he put his Ph.D. on the back burner. He employs a value-oriented approach and often demonstrates excellent market timing due to his exceptional technical analysis.

Want to read more Energy Report interviews like this? Sign up for our free e-newsletter, and you’ll learn when new articles have been published. To see a list of recent interviews with industry analysts and commentators, visit our Streetwise Interviews page.

Related Articles


DISCLOSURE: 
1) Kevin Michael Grace conducted this interview for Streetwise Reports LLC, publisher of The Gold Report, The Energy Report, The Life Sciences Report and The Mining Report, and provides services to Streetwise Reports as an independent contractor. He owns, or his family owns, shares of the following companies mentioned in this interview: None.
2) The following companies mentioned in the interview are sponsors of Streetwise Reports: Cub Energy Inc., Royal Dutch Shell Plc, Mart Resources Inc., Pan Orient Energy Corp. The companies mentioned in this interview were not involved in any aspect of the interview preparation or post-interview editing so the expert could speak independently about the sector. Streetwise Reports does not accept stock in exchange for its services.
3) Chen Lin: I own, or my family owns, shares of the following companies mentioned in this interview: Alter NRG Corp., Cub Energy Inc., Green Plains Renewable Energy Inc., Mart Resources Inc., Pacific Ethanol Inc., Pan Orient Energy Corp. and REX American Resources Corp. I personally am, or my family is, paid by the following companies mentioned in this interview: None. My company has a financial relationship with the following companies mentioned in this interview: None. I was not paid by Streetwise Reports for participating in this interview. Comments and opinions expressed are my own comments and opinions. I determined and had final say over which companies would be included in the interview based on my research, understanding of the sector and interview theme. I had the opportunity to review the interview for accuracy as of the date of the interview and am responsible for the content of the interview. 
4) Interviews are edited for clarity. Streetwise Reports does not make editorial comments or change experts’ statements without their consent. 
5) The interview does not constitute investment advice. Each reader is encouraged to consult with his or her individual financial professional and any action a reader takes as a result of information presented here is his or her own responsibility. By opening this page, each reader accepts and agrees to Streetwise Reports’ terms of use and full legal disclaimer.
6) From time to time, Streetwise Reports LLC and its directors, officers, employees or members of their families, as well as persons interviewed for articles and interviews on the site, may have a long or short position in securities mentioned. Directors, officers, employees or members of their families are prohibited from making purchases and/or sales of those securities in the open market or otherwise during the up-to-four-week interval from the time of the interview until after it publishes.


Market Buzz – TSX Continues to Get Punished by Lower Oil Prices

The TSX Composite continues to get punished by lower oil prices with the market index down 4.7% for the week, now giving up nearly all of the gains generated since the start of the year. After inching above US$100 per barrel in June, the benchmark price for WTI has fallen 45% to end the week at less than US$58. 

image002


The current issues faced by crude are multi-dimensional (supply, demand and political) but the easiest piece to understand is supply. At a time when the global economic outlook is dreary, we have seen oil production increase, to which we can largely thank the shale oil boom in the United States. Unconventional, shale oil production which was barely a thought 5 years ago has virtually transformed the dynamics in the energy market of the United States.


Normally when we see oil prices fall at such a rapid pace OPEC (lead by Saudi Arabia) steps in and lowers production to bring the market back into equilibrium and stabilize prices. But that won’t be the case this time with OPEC announcing last week that they were maintaining production at 30 million barrels per day.

So what is going to happen with oil and what does that mean for investors?

The political drama in the oil market is complex but let’s make it simple. Saudi Arabia is the largest exporter of oil in the world and has a very low cost of production. The United States has burst onto the scene just in the last few years with the EIA (Energy Information Administration) predicting that they can be a net exporter of oil by 2020. But the ‘Achilles Heel’ of the U.S. is that most of this new oil they are bringing to market. Estimates are really all over the map, but generally speaking, the consensus seems to be that most of the shale oil production in the U.S. starts to become unprofitable at less than US$60 per barrel (which we are at now). So it makes perfect sense that Saudi Arabia doesn’t want to cut its production if all that is going to do is make their competitor’s product economical. With oil prices where they are we eventually expect to see higher cost producers curtail oil production which will reduce supply and bring the market back into equilibrium.

There is also another factor at play. Lower oil prices while a net negative for Canada is a net positive for most of the rest of the world. Regions like Europe and Asia, which have been struggling, should get a bit of a boost from the lower energy prices. More economic growth means higher energy demand which further helps to bring the market back into equilibrium.

It’s impossible to say how long all of this will take to play out (perhaps 12 to 24 months) or what the equilibrium price will be. Prices could certainly continue to weaken from here, in the short-term, as fundamentals fly out the window in the face of market fear. But eventually the forces will even out as they always do and the volatility will open up opportunity for investors who are willing to take advantage of it. 

KeyStone’s Latest Reports Section

12/4/2014
CASH RICH, STRONG CASH PRODUCING NETWORK SOFTWARE-HARDWARE PROVIDER, 33% OF MARKET-CAP IN CASH, ZERO DEBT, GROWTH INDUSTRY – INITIATE COVERAGE

12/1/2014
ENERGY SERVICES STOCK POSTS DECENT QUARTER, TRADES AT LOW CURRENT VALUATIONS, LONG-TERM INTACT, NEAR-TERM UNCERTAIN HOLD

11/28/2014
EXTRUSION & AUTOMOTIVE MANUFACTURER REPORTS STRONG 2014 FINANCIAL RESULTS, ACCRETIVE ACQUISITION ADDS TO GROWTH, OUTLOOK POSITIVE FOR 2015 – BUY RATING MAINTAINED

11/28/2014
NATIONAL AND INTERNATIONAL WIRELESS RETAILER GLENTEL RECEIVES 121% TAKEOVER BID FROM BCE INC. – SELL

11/21/2014
STAPLE AUTO REPAIR COMPANY ANNOUNCES RECORD Q3 2014, REVENUE & ADJUSTED EBITDA GROWTH ACCELERATES – STOCK UP OVER 1,900% – MAINTAIN RATING

test-php-789