
Personal Finance
 Here are my 15 surprises for 2015 (with a strategy that might be employed in order for an investor to profit from the occurrence of these possible improbables).
Surprise No.1 – Faith in central bankers is tested (stocks sink and gold soars).
“Investment bubbles and high animal spirits do not materialize out of thin air. They need extremely favorable economic fundamentals together with free and easy, cheap credit and they need it for at least two or three years. Importantly, they also need serial pleasant surprises in such critical variables as global GNP growth.” – Jeremy Grantham
“The highly abnormal is becoming uncomfortably normal. Central banks and markets have been pushing benchmark sovereign yields to extraordinary lows – unimaginable just a few years back. Three-year government bond yields are well below zero in Germany, around zero in Japan and below 1 per cent in
the United States. Moreover, estimates of term premia are pointing south again, with some evolving firmly in negative territory. And as all this is happening, global growth – in inflation-adjusted terms – is close to historical averages. There is something vaguely troubling when the unthinkable becomes routine.” – Claudio Borio
European QE Backfires: The ECB initiates a sovereign QE in January 2015, but it is modest in scale (relative to expectations) as Germany won’t permit a more aggressive strategy. Markets are disappointed with the small size of the ECB’s initiative and European banks choose to hold their bonds instead of selling. ECB balance sheet still can’t get to 3 trillion euros and the euro actually rallies sharply. Bottom line, QE fails to work (economic growth doesn’t accelerate and inflationary expectations don’t lift).
….continue reading HERE

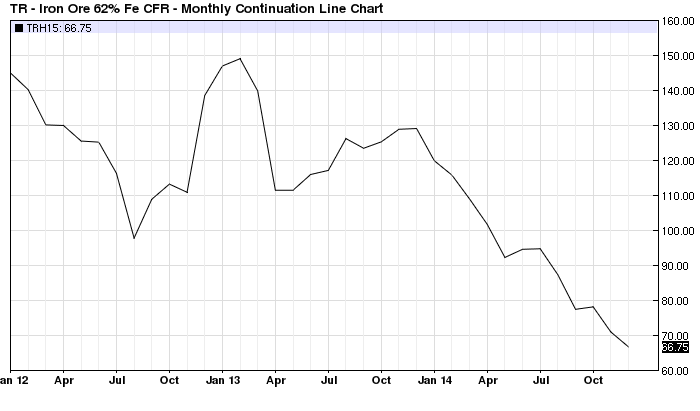
Crude oil is not the only commodity that is crashing. Iron ore is on a similar trajectory and for a common reason. Namely, the two-decade-long economic boom fueled by the money printing rampage of the world’s central banks is beginning to cool rapidly. What the old-time Austrians called “malinvestment” and what Warren Buffet once referred to as the “naked swimmers” exposed by a receding tide is now becoming all too apparent.
This cooling phase is graphically evident in the cliff-diving movement of most industrial commodities. But it is important to recognize that these are not indicative of some timeless and repetitive cycle—–or an example merely of the old adage that high prices are their own best cure.
Instead, today’s plunging commodity prices represent something new under the sun. That is, they are the product of a fracturing monetary supernova that was a unique and never before experienced aberration caused by the 1990s rise, and then the subsequent lunatic expansion after the 2008 crisis, of a cancerous regime of Keynesian central banking.
Stated differently, the worldwide economic and industrial boom since the early 1990s was not indicative of sublime human progress or the break-out of a newly energetic market capitalism on a global basis. Instead, the approximate $50 trillion gain in the reported global GDP over the past two decades was an unhealthy and unsustainable economic deformation financed by a vast outpouring of fiat credit and false prices in the capital markets.
For that reason, the radical swings in commodity prices during the last two decades mark the path of a central bank generated macro-economic bubble, not merely the unique local supply and demand factors which pertain to crude oil, copper, iron ore, or the rest. Accordingly, the chart below which shows that iron ore prices have plunged from $150 per ton in early 2013 to about $65 per ton at present only captures the tail end of the cycle.
….continue reading HERE
As 2015 begins I’d like to briefly follow up on my most recent article in which I discussed the oversold condition in the miners. Breadth indicators as well as technical indicators (such as distance from the 200-day moving average) showed the miners reaching an extreme oversold condition in November and nearly again only a few weeks ago. Miners essentially were at their third most oversold point since 2001. The other two were during the 2008 financial crisis and during Gold’s spring collapse in 2013. The current oversold condition combined with the failure of most indices to make new lows in December could be the setup for a first quarter rebound.
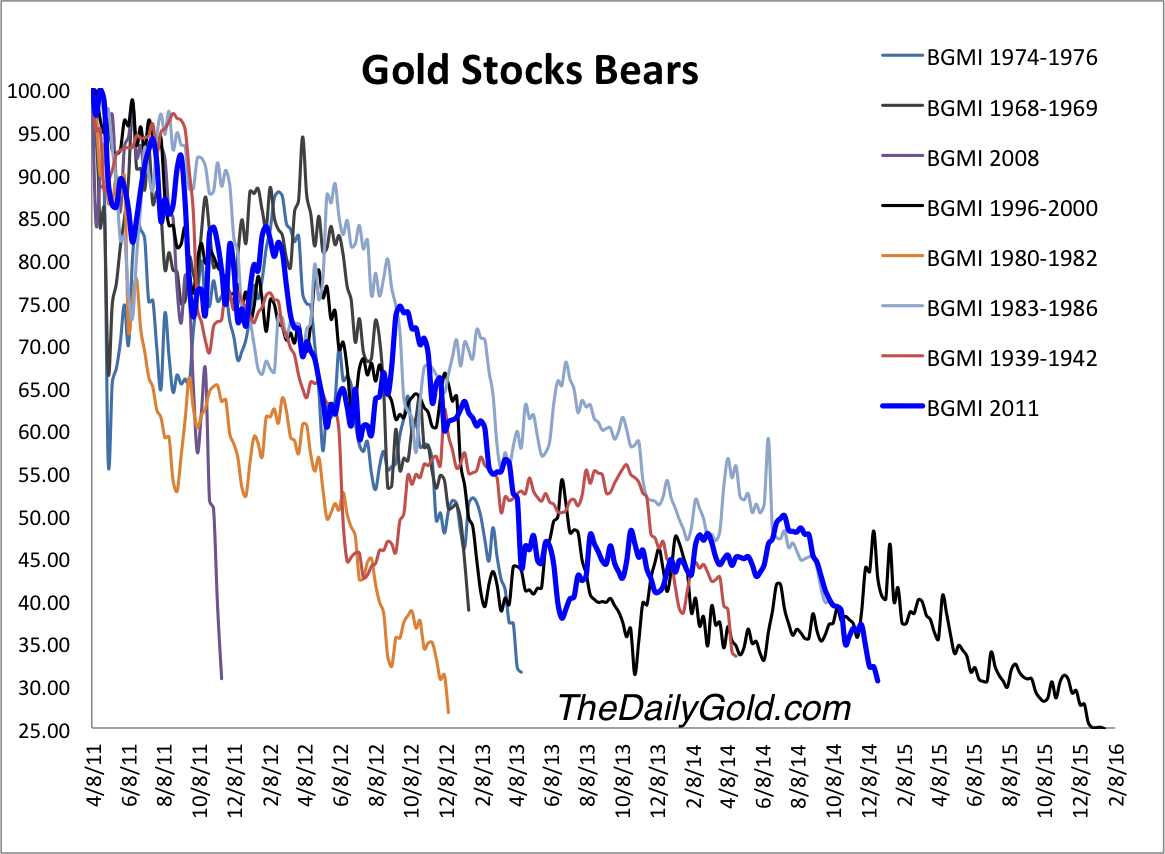
Before I get to GDXJ I’d like to show an updated bear analog chart for gold mining stocks. We use data from the Barron’s Gold Mining Index dating back to 1932. The current bear market is in blue. Other than during the final weeks of the 1996-2000 bear market gold stocks (according to this chart) could be at their most oversold point in history. It certainly is very close. Bull markets began from similar points. Three times the 1996-2000 bear became this oversold. Twice it rebounded and the final time it consolidated for weeks before falling to its bear market low in the second half of 2000.
Below is a weekly bar chart of GDXJ. Note the confluence of trendline and lateral resistance just below $33. The 50% retracement of the recent 53% decline (June to December) is $33. Clearly $33 figures to be important overhead resistance. GDXJ closed Wednesday pennies below $24.
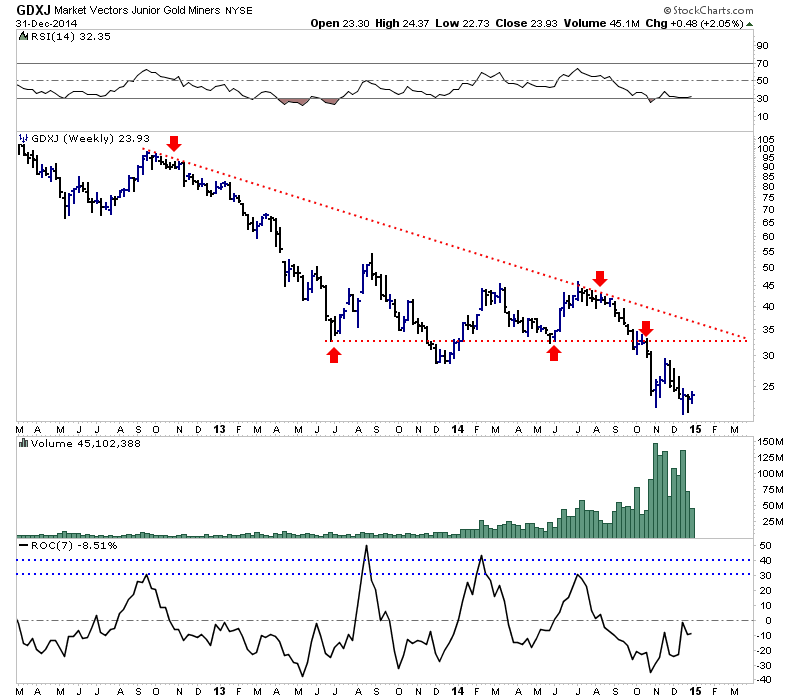
At the bottom of the chart we plot a rolling 7-week rate of change for GDXJ. Over the past two years GDXJ has gained at least 30% within seven weeks on four different occasions. Twice it gained at least 40%. A 40% advance from Wednesday’s close would take GDXJ to $33.50.
Whether or not a new bull market is about to begin does not change the near term outlook. Gold and silver miners (and juniors especially) became extremely oversold and are ripe for a good rebound. It appears to be an excellent long opportunity for traders as well as an opportunity for investors to start scaling into long positions. Consider learning more about our premium service which includes a report on our top 10 juniors to buy for the coming bull market.
Good Luck!
Jordan Roy-Byrne, CMT

 On behalf of Michael Campbell and the whole MoneyTalks team we wish you all the best for 2015.
Thank you again for your support and we look forward to continuing to provide the finest independent financial and market information available.
 “What is most ironic is that the power used by Greenpeace in Europe to fight the “tar sand’s” theoretical destruction of boreal forests is provided by the cutting down and grinding up of actual Canadian boreal forests.’
The sad part is that in almost every case biofuels start out sounding like a good idea. The argument goes that biofuels made from waste biomass can give power without incurring an environmental cost and would be carbon neutral. The problem is that there is only so much waste biomass out there and power plants need a steady source of fuel. So in almost every case power producers need to rely not only on waste biomass but on virgin materials. As described in the linked Economist article, in Poland and Finland, wood meets more than 80% of renewable-energy demand and in Germany, wood makes up 38% of non-fossil fuel power consumption.So where is this wood coming from? As described in the web posting at FSC-Watch in the southern US, NGOs have shown that the biggest US pellet producer, Enviva, is sourcing a high proportion of wood from the clear cutting of bottomland hardwood forests – some of the most biodiverse temperate forests and freshwater ecosystems worldwide.
As for Canada we export about 1.3 million tons of wood pellets, most of it from boreal forests, to Europe every year. As for being “carbon neutral”, boreal forests grow slowly and model simulations reported in the journal Climate Change indicate that harvest of a boreal forest will create a “biofuel carbon debt” that takes 190–340 years to repay. So boreal forest wood is carbon neutral as long as you wait 3 centuries or so. To put it in perspective, in order to provide power for the factories and electric cars in Europe, Canadian and US forests are being cut down, often at an unsustainable rate, resulting in the destruction of valuable habitat and loss of ecosystem diversity. What is most ironic is that the power used by Greenpeace in Europe to fight the “tar sand’s” theoretical destruction of boreal forests is provided by the cutting down and grinding up of actual Canadian boreal forests.
….to read the entire article go to “On renewables and the need for compromise Part IV: biofuels – just bad or really bad?“
…related: Biomass: The Chain of Destruction


-
I know Mike is a very solid investor and respect his opinions very much. So if he says pay attention to this or that - I will.
~ Dale G.
-
I've started managing my own investments so view Michael's site as a one-stop shop from which to get information and perspectives.
~ Dave E.
-
Michael offers easy reading, honest, common sense information that anyone can use in a practical manner.
~ der_al.
-
A sane voice in a scrambled investment world.
~ Ed R.
Inside Edge Pro Contributors

Greg Weldon

Josef Schachter

Tyler Bollhorn

Ryan Irvine

Paul Beattie

Martin Straith

Patrick Ceresna

Mark Leibovit

James Thorne

Victor Adair