
Energy & Commodities
With interest rates front and center these days, I thought we would take some time to explore the yield curve and some of the information that can be gleaned from it. The yield curve represents the relationship between interest rates on bonds of different maturities, but equal credit quality. For our purposes, we’ll be discussing the US Treasury yield curve.
The slope of the yield curve has proven to be a good forecaster of economic growth. There are three basic shapes the yield curve can take, each with different implications regarding economic growth. We’ll explore these below and then take a look at the what the current yield curve is saying.
A normal, upward sloping yield curve is shown below. This is how the yield curve looks when an economy is growing and investors are confident. In a growing economy, investors demand additional premium (yield) for longer maturity bonds. This is logical considering there is more risk associated with having money tied up for longer periods of time. Healthy economies nearly always have an upward sloping yield curve, although the interest rates that make up that curve may differ substantially from one period to another.

A flat yield curve indicates that investors are not being compensated for the additional risk of longer maturity bonds. This is a warning sign that an economy is under duress; investors expect slow growth, and economic indicators are sending mixed signals. As investors buy and sell bonds to flatten the yield curve, they are demonstrating through their behavior that they are worried about the outlook of the economy. As a result, they prefer to have their money tied up longer in safe investments, and demand less of a return for doing so.

A flat yield curve can develop into the dreaded “inverted” yield curve when the economic outlook is very bleak. When the yield curve inverts, it indicates tough economic times ahead. The logic goes like this: If I’m worried the economy is going to crash, I want to look for safe ways of preserving my capital. If I suspect falling equity prices, and falling interest rates, I’m going to try to lock my capital away in longer-term bonds as a way to ride out the storm. As more and more investors do this, it drives longer maturity bond prices up, and the yields down. These same investors will shy away from short-term bonds, which may have to be reinvested during the downturn. This lack of demand drives short-term treasury prices down and the yields up.

There are multiple ways to analyze the slope of the yield curve, so which is the most accurate? Statistically, the method that has shown the most reliability in predicting future economic growth has been to look at the difference between the rates on the 10-year Treasury Note and the 3-Month Treasury Bill. When the yield on the 10-year is greater than the yield on the 3-Month, the slope is positive, and when this relationship reverses (3-Month rate greater than the 10-Year rate), the slope is negative and the yield curve is considered inverted.
Historical observations using this method show that an inverted yield curve indicates a recession approximately one year away. Inverted yield curves have preceded each one of the last seven recessions, as can be seen on the chart below.
This chart contains a wealth of information, so let’s study it carefully. On the chart, the brown line represents the measure of slope we just discussed (the difference between yields on the 10-Year Treasury Note and the 3-Month Treasury Bill), going back to 1953. Each time this brown line drops below zero, the yield curve is considered to be inverted. Notice that this occurs immediately preceding the last seven gray vertical bars — which indicate recessions as defined by the Bureau of Economic Analysis.
The blue line shows GDP growth, and for the purposes of this chart, the GDP figures have been shown with a lag of one year. Looking at the chart with this lag allows us to see how closely correlated an inverted yield curve is with a drop in GDP one year out.

The last time the yield curve inverted was in August 2006; it provided advance warning for the recession that “officially” began in December 2007. Before that, the yield curve inverted in April 2000, predicting the 2001 recession. The only time this indicator gave a false signal was in 1966.
I’m guessing some of you are wondering whether this relationship will still hold in light of the massive amounts of quantitative easing. If I had to venture a guess I would say yes, and here’s why. First, the FED can generally control short-term rates, but has much less effect on long-term rates, which are typically set by the market. Second, even the FED’s control of short-term rates is not perfect, as evidenced by previous spikes in short-term Treasuries.
So what is the yield curve saying now? A sustained strong demand for Treasuries, combined with the recent rush to safety, has pushed the yield on the 10-year down below 2%. We have to look back almost two years, to when the Fed was heavily engaged in QE, to find a sustained period of rates this low. If the Fed does want to reduce the size of its large balance sheet by selling longer-dated bonds, this would be an opportune time, as a global rush for safety and yield is suppressing rates in a way the Fed could only have dreamed of.

With short rates held at zero, continued declines in the yield on longer dated maturities are acting to flatten the yield curve. In the chart below, the red line shows the current state of the yield curve. The black “trail” shows where the yield curve has been recently. As you can see, the yield curve is flattening, and this has precarious economic implications.
At this moment we should be attentive but not overly concerned. What will be interesting to see is how the yield curve responds to changes in Fed policy. I will go into much more detail on this topic in upcoming remarks, but prior to the financial crisis it was actually the Fed raising short rates, without the long end rising in tandem, that triggered the inverted yield curve which preceded the last recession. The curious side of me is constantly wondering if, when the Fed finally decides to tighten, it would be a better idea to sell longer dated maturities (which would theoretically raise the long end of the curve), rather than raise the short end of the curve and “hope” it translates out. If I were Fed Chairman for a day, there is a good chance that would be my course of action.

Perhaps we shouldn’t be surprised that investor behavior is acting to flatten the yield curve. After all, the Eurozone economy is stagnant, Japan is in recession, China’s economy is slowing, and oil exporting countries and their currencies are under pressure. If it weren’t for a robust US economy, including solid gains in employment and corporate profits, I would be deeply concerned. What we need to watch closely here is to what extent global conditions act as an anchor for the US economy, or whether worldwide conditions finally begin to improve as a result of continued central bank stimulus and renewed global growth.


The Euro elected the Yearly Bearish Reversal at the 12150 area and it has penetrated the 2010 low so far of 11880 intraday reaching so far 11801. The key support lies at a set of DOUBLE WEEKLY BEARISH REVERSALS found at 11778. If we elect that this year, the Euro will fall most likely BELOW par to the 103 area. We do have Weekly Bearish Reversals at 11850 and 11640. A weekly closing below 11640 will be devastating.
This is all part of the game at foot. I have warned the dollar had to rise and this will TURN DOWN the US economy later this year. Welcome the return of volatility. The banks may be able to trade proprietary again as they technically establish internal hedge funds for their own money, yet the real problem is emerging the lack of liquidity. You can raise heaps of cash these days. But the markets are returning to their infancy – lack of participants leading to more and more illiquidity, which translates into higher volatility. Now only a weekly closing back above the 12510 area will suspend the free fall temporarily.
The current trendy reason for the mainstream to dislike Gold is strength in the US Dollar. On the surface it makes quite a bit of sense. Gold is priced in dollars. Dollar strength automatically pressures the Gold price. However, this popular view reveals a total lack of introspection. Since the end of 2013 Gold is essentially flat (positive by a fraction) while the greenback has gained a whopping 14.9%. Better yet, since Gold’s early November low it has gained 6.0% even while the US$ is up 5.8%. This type of relative strength within the context of an aging bear market may be another sign of a major trend change brewing under the surface.
Gold has a history of leading the buck at important lows. It makes sense because if Gold is going to rebound strongly it should do so in real terms and not just as a mirror of the buck. The chart below plots weekly line charts of Gold and an inverted US$ index. In blue we plot important bottoms in Gold with the corresponding bottoms in the inverted US$ in red. Note how Gold started to rebound at least a few months before the inverted US$. We should also note that during 1976 Gold bottomed in August while the US$ didn’t peak until December.

Turning to the present, Gold is on the cusp of a mini breakout but we’d really like to see it show more strength against equities. We’ve recently noted that Gold has broken out to a 16-month high against foreign currencies and a 17-month high against commodities. Yet it has remained weak against global equities.
Below we plot Gold, Gold against the S&P 500 and Gold against the MS World index (world excluding the USA). If Gold can push above $1220 in the coming days then it could rally up to $1270-$1280. Gold is very close to an important breakout against global equities (ex USA) but still has work to do against the S&P 500.

Though Gold has been flat over the past three months it has quietly gained important relative strength. It recently touched a 16-month high against the Euro and a 17-month high against commodities. It has rallied even as the US$ has rallied. These are some very positive signs that hint that the worst could be over. In my opinion, the last thing Gold needs to do for bulls to win the argument is break its downtrend relative to the S&P 500. That negative correlation has killed Gold throughout the bear market and a reversal in favor of Gold would be very significant. We are long select juniors as we believe at worst, a decent rebound in the sector has begun. Time will tell if it evolves into a new bull market. Consider learning more about our premium service which includes a report on our top 10 juniors to buy for the coming bull market.
Good Luck!
Jordan Roy-Byrne, CMT

Chen Lin was one of the very few who foresaw the collapse in oil prices, so investors are well advised to pay attention to his advice. In this interview with The Energy Report, the author of the What is Chen Buying? What is Chen Selling? newsletter touts the prospects of a few oil companies that can prosper in the downturn, and explains why cheap oil means high profits for U.S. ethanol producers.

The Energy Report: You anticipated the collapse of the price of oil. How did you see this coming when so few others did?
Chen Lin: I was very fortunate. In an interview with The Energy Report last year, I expressed my fear that the price of oil could fall as low as $47 per barrel ($47/bbl). Because I invest in and follow a lot of fracking companies around the U.S. and Canada, I knew how fast North American oil production was increasing. Coincidentally, major Wall Street firms started to agree with my assessments one year later.
On Sept. 5, 2014, I alerted my subscribers that I had sold out a lot of energy stocks and reduced a lot of other positions to raise cash. Thanks to these timely sales, I’ve had a good year so far. But it’s been very tough watching oil fall as far and as fast as it has.
As the oil price is in free fall, many companies with high leverage to the price will likely go under. Investors need to be extra careful in picking beaten-down stocks in the energy sector. My personal view is that the oil price is likely to continue to fall into next year, and possibly won’t find a bottom until next spring. I am watching it closely. It is very important to stay with companies that can survive this downturn, if not benefit from it.
TER: Angelos Damaskos of Sector Investment Managers Ltd. told The Energy Report that increased North American oil production due to development in the shales has been balanced by decreased oil production elsewhere in the world. Therefore, he argued, there must be another cause for the oil price fall, and suggested significantly reduced buying from China. Do you agree?
CL: No. China’s oil demand has been increasing, and there’s no way the Chinese government can hide it. China is the second-largest oil importer after the U.S. In fact, China’s oil imports have increased by as much as 50% recently because of the price reduction. China is filling up its strategic reserve.
North American oil production has increased, so if demand stays constant, the Organization of the Petroleum Exporting Countries (OPEC) would have to reduce production to keep the price stable.
TER: Since the price has fallen, does this suggest that OPEC has increased production?
CL: Possibly. I can understand Saudi Arabia getting sick of Canada and the U.S. taking its market share and acting accordingly. Partly because of the American military presence in the Gulf region, those countries cannot squeeze U.S. shale production without American permission.
Another possibility is the U.S. acting to squeeze Vladimir Putin and Russia. The U.S. and the Saudis, acting together in the 1980s, brought the price of oil so low it was a big factor in the collapse of the Soviet Union. I can see the Saudis and the U.S. doing that again. You have Goldman Sachs calling for an oil price crash, and the Saudis are selling aggressively—and selling to the U.S. at much lower price than to Asia and Europe. The West Texas Intermediate (WTI) price is based in the U.S., and Saudi Arabia wants WTI to go down.
TER: About 90% of Saudi Arabia’s revenues come from oil production. How long can the country keep prices down?
CL: When oil was over $100/bbl, Saudi Arabia built up its cash reserves, so it can easily ride out $80/bbl prices for 2–3 years. The real losers in this price war are oil producers with much higher costs—countries such as Russia and Iran. In November, the Russian ruble was defending 40 to the U.S. dollar; now it’s defending 50.
TER: Back to China, are you worried or sanguine about the state of the Chinese economy? We hear stories about overleveraging, problems with debt and the banks, and a real estate bubble.
CL: All this is true. China definitely has a property bubble. Bank leverage is definitely high. The situation is not good and getting worse. But the Chinese government has more freedom to take action than the U.S. does, or the countries of the European Union do.
Ideally, China needs to depreciate its currency to stimulate exports to Japan and Europe, its biggest trading partners. The U.S. would not allow devaluation, however, so China is somewhat stuck. But I believe China can weather this situation for some time.
TER: Is the “revolution of rising expectations” a threat to China’s stability? People who have long been poor become inured to poverty. When they become a little bit richer, however, they come to expect ever-increasing prosperity. When this doesn’t happen, people can get very angry very quickly.
CL: That’s a very good point. It’s a possibility. We must keep in mind, however, that the Chinese government retains strong control of the media and other means of popular discontent. Despite the recent problems, the current Chinese regime has been very popular because of its anti-corruption campaign and its moves against the state monopoly. The new regime’s honeymoon isn’t over yet and is likely to continue for the near term.
TER: How long before oil prices again reach $100/bbl?
CL: It’s hard to say. The lower oil price will decrease production, but not immediately. This will occur in 2–3 years. As I see it, the drop in oil price will actually help the price reach $100/bbl in the future. Many oil companies are now reducing capital expenditures (capexes), so exploration is being curtailed. Fracking companies are reducing their activities. Ultimately, this must lead to higher prices.
TER: Lower oil production will lead to higher oil prices, but lower gold production hasn’t led to higher gold prices. What’s the difference?
CL: We cannot live one day without energy, without oil. Without oil, we cannot drive our cars, get to our jobs, heat our homes. We can, however, live without gold for a few years. Gold is more of a financial instrument than a commodity.
TER: How much damage will oil at less than $70/bbl cause to shale oil and oil sands operations?
CL: Many companies in these spaces are cutting capexes by 20–30% for next year. Production could be down 20-30% in 2–3 years.
TER: Shale oil and oil sands operations are, by their nature, very high capex. And shale oil wells don’t produce for long. Could three years of $70/bbl oil kill off shale oil?
CL: No. I have checked with a lot of companies—some I own, some I follow—and the word is that prices of $50–60/bbl would be needed to kill shale oil.
TER: Now that the Republicans control both houses of Congress, will the Keystone XL Pipeline be approved?
CL: This is one of the top priorities for the Republicans in Congress. Though the recent efforts to approve the pipeline failed, Congress will likely bring it up next year. Keystone approval would be great news for Canada. Canadian oil producers have suffered so much, so I’m glad they would profit the most. The oil sands would benefit hugely as well.
But this would be a long-term benefit because it will be years before Phase 4 would go into operation. In the near term, what could be a huge problem for the Canadian producers are new rail regulations coming into effect in 2015. This is in reaction to the many shipping accidents of recent years. These regulations will be really tough. They will raise shipping costs and reduce exports. Canadian oil companies are facing more pain before the Keystone starts.
TER: Which oil sands company is your favorite, and why?
CL: I own Pan Orient Energy Corp. (POE:TSX.V). Its pilot oil sands project is in Alberta, but it also owns many conventional projects in Asia. Pan Orient is my favorite energy play because of its very strong balance sheet. The company just announced a $42.5M asset sale in Thailand. This brings its cash value, plus the other 50% of the Thai project, to CA$2.25 per share. It is trading now at $1.70/share. Beyond that, you get Canada and Indonesia for free.
Pan Orient plans to sell its Canadian asset. But right now, that asset is valued, for share purposes, at zero. At rock bottom, it’s worth $100M. In Indonesia, Pan Orient’s partner will cover drilling costs for 2015. The company announced the Indonesia deal with Talisman Energy on Nov. 11, so its cash position will go even higher. In addition, Pan Orient will have an experienced partner with major Indonesia presence drilling on its very large concessions; the target is as large as half a billion barrels of oil equivalent. That’s a huge wild card the market didn’t expect. The company is in an ideal situation now because the cash position is there, Canada is producing, Thailand is producing, and the cash flow is covering the expenses.
TER: Which pure oil play junior is your favorite?
CL: Mart Resources Inc. (MMT:TSX.V) has been my home run of the past few years. I’ve already received a dividend that was more than my original investment. Mart just announced the new pipeline has started flowing. Once the new pipeline is fully ramped up, we should see the production triple, which will generate huge cash flow. Mart’s production cost is exceedingly low.
TER: Is Mart seeking aggressively to expand its operations?
CL: It is. Mart is part of a consortium that has just acquired a new Nigerian asset from Royal Dutch Shell Plc (RDS.A:NYSE; RDS.B:NYSE), Total S.A. (TOT:NYSE) and Eni S.p.A. (E:NYSE). The consortium will control 45% of a block producing 30,000 barrels per day (30 Kbbl/d).
TER: Which natural gas juniors do you like?
CL: I used to own Rex Energy Corp. (REXX:NASDAQ), but not anymore, the main issue being its heavily indebted balance sheet.
TER: Rex Energy is in the Appalachian and Illinois basins. How long before these regions are tapped out?
CL: They will probably last for quite some time. Right now, prices are low, and producers aren’t generating much cash flow. But we may have a very cold winter, and natural gas stocks could be back in favor. And we might start to export natural gas from the U.S. and Canada as early as next year. That could be very positive in the long run.
TER: Are we looking at a natural gas price crash due to overabundance?
CL: Some recent finds have been phenomenal, so the price could potentially go even lower. Hopefully, we can build up liquefied natural gas exports soon.
TER: Is there another company you like in this sector?
CL: One I do own is Cub Energy Inc. (KUB:TSX.V), which is drilling in Ukraine. Unfortunately, more than half of its production is in East Ukraine, a conflict area. It is still producing, but it cannot drill more wells. It is, however, getting good results from West Ukraine. Cub is a good, long-term Ukraine gas play.
TER: The first oil shock was in 1973, 41 years ago. Since then alternative energy has been all the rage. But we remain essentially dependent on oil and gas, four decades later. Do you worry that the 30% decrease in the oil price could cripple alternative energy companies and their projects?
CL: That depends. Some alternative energy companies will be hurt. One such company I own is Alter NRG Corp. (NRG:TSX; ANRGF:OTCQX). It uses plasma to burn garbage to generate natural gas that’s very clean, with no waste and no pollution. That could be attractive to such highly polluted countries as China and India. Currently, new garbage-burning plants in China generate a lot of resistance, but adopting plasma technology makes it much more attractive.
Alter NRG has already built a plant in the United Kingdom (U.K.), and is building a second. In an island country like Britain, garbage is a huge problem. There is no room for landfills, so garbage must be shipped outside the country. There’s a high tipping fee, raised from consumers, to pay for collection. The natural gas price in the U.K. is very high as well. The return on investment in Alter NRG’s U.K. operations is very high, even after the fall in energy prices.
TER: Can you explain Alter NRG’s business model?
CL: The tipping fee alone makes its U.K. projects worthwhile, so the natural gas generated is free. The company can sell the gas or use it to generate electricity, which is sold for a high price. And this is renewable electricity, so it is of premium value. The ash produced by incineration is pure, and can even be used in construction.
I’ve been to Puerto Rico, another island nation, and I’ve talked to local people and companies that would love technology like Alter NRG’s. The only problem for this company is that it’s a long process from recognition of the technological benefits to government approval and construction.
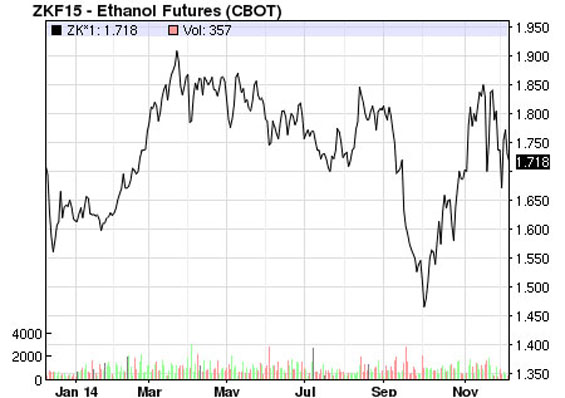
TER: Why do you believe the future is so bright for ethanol producers?
CL: In September, ethanol followed oil down in price. But there was a complete rebound and more in October. The conventional wisdom is that ethanol is considered part of gasoline, 10% by law. So when the oil price falls, and the gasoline price falls, the price of ethanol should fall too. That explains the coordinated short attacks on ethanol in the past two months. Shares of Pacific Ethanol Inc. (PEIX:NASDAQ) fell 60%, while the short interests in REX American Resources Corp. (REX:NYSE) more than tripled. I own both these companies, as well as Green Plains Renewable Energy Inc. (GPRE:NASDAQ).
The conventional wisdom about ethanol has been proved wrong. Lower oil and gas prices encourage more consumption. More gas consumption, by law, requires more ethanol—more ethanol, in fact, than can be produced. According to the Environmental Protection Agency, U.S. plants are running at 930,000–940,000 barrels per day. Maximum daily U.S. ethanol capacity is 925,000 barrels per day. That’s why the ethanol price rebounded sharply in October and is now higher than in the summer, when oil sold at $100/bbl.
On the supply side, few ethanol plants are coming on line because it is very difficult to get Renewable Identification Number (RIN) permits from the Environmental Protection Agency. So don’t expect any major new plants in the next few years. This issue was discussed in detail during the question-and-answer session of the Great Plains’ recent conference call.
TER: But ethanol share prices are still depressed.
CL: That’s why I’m so excited. The oil index funds are short ethanol, but they don’t understand the situation. Last quarter, Pacific Ethanol beat its earnings estimate with $0.33/share. Its margin has since risen from $0.35/gallon to more than $1/gallon. Imagine how much money it’s making now. The company has some debt, but its cash exceeds that by $30M. The company is now considering a dividend and a share buyback, as is Green Plains.
REX American and Green Plains also boast robust balance sheets and record-high margins. I am bullish on ethanol stocks.
TER: The use of ethanol for fuel requires the diversion of agricultural products, which leads to higher food prices. We’ve seen significantly higher food prices in the last few years. Do you think it’s possible that, given the lower prices of oil and gas, politicians might cut the 10% requirement?
CL: Actually, they are looking to increase it to 15%. Thanks to genetic modification, harvests of corn and soybeans are at historic highs, and the commodities are priced at historic lows. That’s another reason why ethanol companies are so profitable. Input costs are at an all-time low, with output prices at an all-time high.
TER: Do you think ethanol companies are a better bet than oil companies?
CL: I do, especially from now until the end of the year. We have a tax-loss selling season. I see a lot of funds potentially going out of business or facing heavy reduction. Meanwhile, ethanol is booming.
Earlier, I mentioned the rail-transportation regulations coming into effect in 2015. They will be particularly beneficial for Pacific Ethanol because it is selling ethanol in California, and its price is based on the ethanol from the Corn Belt, in Iowa, which is transported by rail. Shipping costs will jump in 2015, so ethanol margins will increase.
Again, by law, gasoline must contain at least 10% ethanol, and when shortages occur, the price of ethanol skyrockets. The law is the law. The most recent conference calls of Green Plains and Pacific Ethanol confirmed the coming, strong ethanol price. This is not reflected in share prices yet, which are already bound to increase greatly based on current margins.
TER: Chen, thank you for your insights.
\Chen Lin writes the popular stock newsletter What Is Chen Buying? What Is Chen Selling?, published and distributed by Taylor Hard Money Advisors Inc. While a doctoral candidate in aeronautical engineering at Princeton, Lin found his investment strategies were so profitable that he put his Ph.D. on the back burner. He employs a value-oriented approach and often demonstrates excellent market timing due to his exceptional technical analysis.
Read what other experts are saying about:
Want to read more Energy Report interviews like this? Sign up for our free e-newsletter, and you’ll learn when new articles have been published. To see a list of recent interviews with industry analysts and commentators, visit our Streetwise Interviews page

Today’s chart illustrates how the stock market has performed during the average pre-election year. Since 1900, the stock market has tended to outperform during the first seven months of the average pre-election year. For the remainder of the year, pre-election performance has tended to be choppy and slightly subpar. In the end, however, the stock market has tended to outperform during the entirety of the pre-election year. One theory to support this behavior is that the party in power will make difficult economic decisions in the early years of a presidential cycle and then do everything within its power to stimulate the economy during the latter years in order to increase the odds of re-election.
Quote of the Day
“If you are planning for one year, grow rice. If you’re planning for 20 years, grow trees. If you’re planning for centuries, grow men.” – Chinese proverb
Events of the Day
January 01, 2015 – New Year’s Day – Rose Bowl – Sugar Bowl
January 11, 2015 – Golden Globe Awards
January 12, 2015 – BCS Championship Game
Stocks of the Day
— Find out which stocks investors are focused on with the most active stocks today.
— Which stocks are making big money? Find out with the biggest stock gainers today.
— What are the largest companies? Find out with the largest companies by market cap.
— Which stocks are the biggest dividend payers? Find out with the highest dividend paying stocks.
— You can also quickly review the performance, dividend yield and market capitalization for each of the Dow Jones Industrial Average Companies as well as the performance of the Dogs of the Dow.

-
I know Mike is a very solid investor and respect his opinions very much. So if he says pay attention to this or that - I will.
~ Dale G.
-
I've started managing my own investments so view Michael's site as a one-stop shop from which to get information and perspectives.
~ Dave E.
-
Michael offers easy reading, honest, common sense information that anyone can use in a practical manner.
~ der_al.
-
A sane voice in a scrambled investment world.
~ Ed R.
Inside Edge Pro Contributors

Greg Weldon

Josef Schachter

Tyler Bollhorn

Ryan Irvine

Paul Beattie

Martin Straith

Patrick Ceresna

Mark Leibovit

James Thorne

Victor Adair