Bonds & Interest Rates

A Central Bank World

The Central Banks of Switzerland, Canada and the EU have rocked the markets…but the most important question in Central Bank land is, ”Will the Fed still raise interest rates in 2015?” Our view has been that global Central Banks…despite all their “money printing”… are losing the fight against deflation…that “Currency Wars” are just passing the “hot potato” of deflation from one country to another. In his famous (helicopter money) speech in November 2002 Ben Bernanke defined deflation as a “Collapse in demand.” Well crude oil, copper and the major commodity indices, as well as CAD and the AUD are at 6 year lows…and as Dennis Gartman likes to say, “When a market is going down you have no idea how far down, down is!”

Whether or not the Fed will raise interest rates is the KEY question because the assumed “Divergence” between America and the Rest of the World has helped drive the US Dollar Index to 12 year highs. If the market begins to think that the Fed will not raise rates…for all the obvious reasons…then we’d expect to see a USD correction.

US Dollar Index:

10

Canadian Dollar: is down ~25% since the commodity boom peaked out in 2011…it’s down ~15% since July 2014…when Crude began its waterfall decline. Last week…before the Bank of Canada cut interest rates…the market was pricing in a 20% chance of an interest rate cut in 2015…it’s now pricing in a 50% chance of ANOTHER interest rate cut in 2015. Pressure on CAD rises exponentially the more Crude Oil falls….BUT…

22

The Bank of Canada action helped drive the Toronto Stock Index 500 points higher…and drive the Canadian 10 year bond to All Time Highs…

33

44

The ECB action has helped drive the German DAX and the German 10 year bond to All Time Highs…

55

66

Gold: is up ~$170 (15%) from 4 year lows made last November…gold share indices are up ~30%…as higher gold and lower oil dramatically improve the leverage for gold miners. Last July it took only 12 barrels of WTI to buy 1 ounce of gold…it now takes 28 barrels. Another “consequence” of global deflation and a surging US Dollar may be that “Resource Nationalism” will, by necessity, become a thing of the past…thereby making it easier and cheaper for gold mining companies to operate in many formerly “difficult” countries.

77

88

Screen Shot 2015-01-26 at 9.29.18 AM

Short term trading: The best results in our Model account YTD have come from short call positions in CAD and AUD. Our worst results came from short OTM puts on the CAD after it had fallen more than 3 cents in 2 weeks…after option vol had surged to 3 year highs and as crude oil looked like it was “stabilizing” around $47…BUT…we hadn’t expected the Bank of Canada to drive CAD to 6 year lows. It “feels” like we should have made good profits this month given the market action…but we are grateful we didn’t get clobbered by some of those same moves!

Long term trading: I’ve made more money over the last 3 – 4 years from my long term hedges against the CAD than from all of my short term trading. I’m especially grateful that I was able to buy more USD last fall…it was hard to do because CAD had dropped below 90 cents and I was selling new lows…but I was able to take the perspective that the ten year “Commodity boom” was over…and the “Big Risk” was that CAD might take out the 2009 lows.

10

Trade Banner

Faber: We Are heading into an Iceberg , It’s Going to End in a Complete Disaster

images
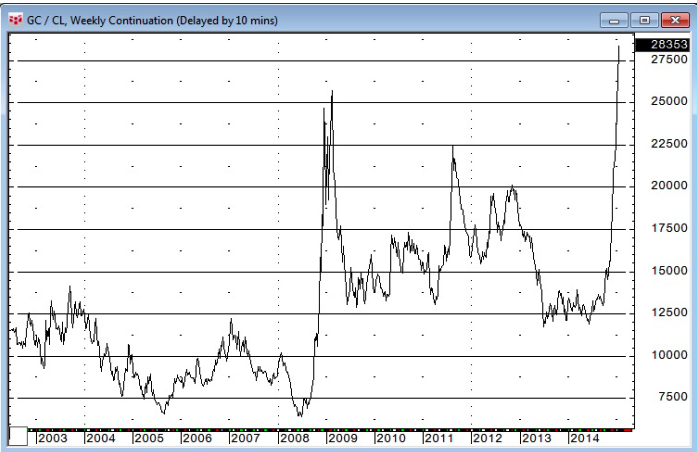
My belief is that the big surprise this year is that investor confidence in central banks collapses. And when that happens — I can’t short central banks, although I’d really like to, and the only way to short them is to go long gold, silver and platinum,” he said. “That’s the only way. That’s something I will do.”

“We simply have highly inflated asset markets. Real estate is high, stocks are high, bonds are high, art prices are high, and interest rates and short-term deposits are basically zero,” Faber said. “The only sector that I think is very inexpensive is precious metals, and in particularly precious-metals stocks.”

“It’s going to end in a complete disaster. But, we have to distinguish – the disaster may not happen for five to ten years. But we’re heading into an iceberg. And, what will eventually happen is that the population will suffer very badly from inflation and declining real wages.”

More from Marc Faber:

Marc Faber Warning : QE has Grossly inflated Asset Prices

The Central Banks will be exposed for All The Fraud they Commit

Do the world’s central bankers really have a clue what to do next?

The ABC’s Of The ECB’s QE

Screen Shot 2015-01-26 at 7.29.24 AM
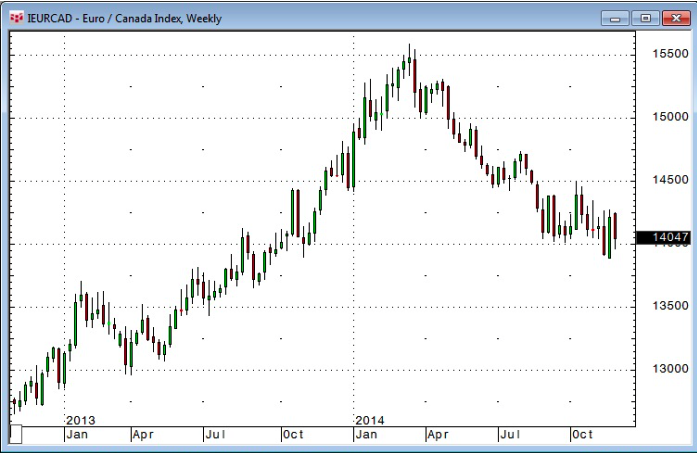
This past week, after two years of “jawboning the world to death,” the European Central Bank (ECB) launched their version of quantitative easing or QE.

Let’s walk through the program and take a look at the most important aspects of what the ECB just did.

>> Read more here

Will It Work?

Of course, the real question that needs to be answered is whether or not it will actually lead to higher levels of inflation, employment, and economic growth?

With unemployment remaining extremely elevated, inflationary pressures plunging, and economic growth waning, you can see why the ECB has become desperate to “do something” to try and reverse the tide. However, while it is certainly hoped that the ECB can spark inflation and better economic growth with the current QE program, there is little evidence that it actually worked in either Japan or the U.S.

>> Read more here


The Comprehensive Chartology of Silver…

Five days ago silver broke out of an inverse H&S bottom that has temporarily reversed the downtrend. I measured the more conservative price objective using the higher low instead of the Swiss spike low which comes in around the 19.80 area on the log chart. It will be interesting to see if the Swiss spike low will be the ultimate low for the bear market or just a short to intermediate low. Sometimes big trends can end with one last shake out of the weak hands similar to the Swiss spike low.

36494 a

Larger Image

Below is a two year chart for silver that shows its big triangle consolidation pattern that did a little morphing before it finally broke down in September of last year as shown by the red circles. Since the breakout silver has built out an inverse H&S bottom and is now in rally mode. As you can see on the chart below silver is approaching two very important trendlines from the big blue triangle consolidation pattern. The price objective of that inverse H&S bottom comes in around the 19.50 area which is slightly above the apex. One thing we need to keep in mind is that the inverse H&S bottom is a reversal pattern that can reverse a downtrend. It’s way too early yet to think about a reversal of the bear market but if silver can ever trade above the apex of the blue triangle that would be the first step in the right direction.

36494 b

Larger Image

This long term weekly chart for silver shows it bouncing off of the next lower support line at 14.65 with the Swiss spike low. Now it’s entering into the brown shaded support and resistance zone which is just over head. Bottom line is silver has to have more buyers than sellers to overcome which looks like strong resistance overhead.

36494 c

Larger Image

This next long term weekly chart for silver shows the parabolic rally phase into the April 2011 top which ended the bull market. From the bull market top silver has been trading in a parallel down trend channel for almost four years now which is a pretty lengthy move in one direction. Again it’s up to the bulls to reverse this downtrend channel in a similar fashion to the way they did back in 2008 crash low. You can see the price objective to the 50 area in 2011 using two different patterns. The inverse H&S bottom had a price target up to 45.75 and the red expanding triangle halfway pattern had a price objective up to 50. Impulse moves like that are mush easier to trade than these big 18 month consolidation patterns.

36494 d

Larger Image

This last chart for silver is a 40 year look that shows its bull market top in 1980 and the decline that followed and the long drawn out sideways trading range that went on for many years. There is actually some very nice symmetry on the left and right side of the chart as shown by the big necklines. We’ve been following a potential very large H&S top where the price action broke below the neckline about six months ago. It’s now attempting to backtest the neckline to the 19.60 area which will be critical resistance. At least you have some perspective of where silver was in the past and how it relates to the present which is important to know.

In the Weekend Report we’ll take a good hard look at some of the Kamikaze stocks to try and gain some insight on what is taking place right now with these volatile stocks. All the best…Rambus

36494 e

Larger Image

When the Dollar Crashes

On Friday, last week, the Dollar Index was up a remarkable 2% for the day. It actually went above 2% during the day . Between Thursday and the high on Friday the 23rd of January the Dollar Index climbed a remarkable 3.25% in 36 hours. I’ve never seen such a move in a currency. No one that I know saw that or at least no one remarked on the move.

02dollar index friday3day

….continue reading HERE

test-php-789