
Bonds & Interest Rates
 Greek and Eurozone officials failed to reach an agreement over Greece’s debt crisis yesterday in Brussels at an emergency Eurogroup meeting. Although Jeroen Dijsselbloem, the chairman of Eurogroup finance ministers, said that seven hours of talks were “constructive”, the euro zone finance ministers were unable to agree even a joint statement on the next procedural steps. How may the Greek problems affect the gold market?
The negotiations stem from the fact that the current EU-IMF bailout for Greece expires on February 28 and a new four-year reform plan is needed. The problem is, however, that the new Greek government, led by the radical left-wing Syriza party, says the conditions of the $272 billion bailout have impoverished Greece and resists its extension and co-operation with the hated ‘troika’. The new leftist government has proposed to overhaul 30% of its bailout obligations, replacing them with a 10-point plan of reforms, including, for example, the reduction of the primary surplus target of 3 percent of GDP to 1.49 percent or getting a ‘bridge loan’ that would enable Greece to stay afloat once the current bailout deal expires and until a new program is agreed. However, Greece’s creditors in the EU, led by austerity-focused Germany, have insisted that the terms of the bailout cannot be altered.
Is Greece going to default on its debt? On the one hand, Greece is currently running a primary surplus, which makes default
on its debt more probable. On the other hand, the European Central Bank has recently increased pressure on Greece by banning the Greek banks from using their government’s bonds to get liquidity from the ECB. It has not yet affected Greece significantly, however the signal was clear.
Assuming that negotiations will fail and Greece will (partially) default on its debt (a Grexit seems not to be on the cards), what are the implications for the financial markets and gold investors? It seems that direct effects would not be significant, because banks or other private investors generally do not possess Greek debt anymore (only about 12%). The biggest creditors are the ECB, IMF and EU (state debts and proceeds from the European Financial Stability Fund), therefore the possible default would only affect official institutions and Eurozone states. This is why Germany opposes so strongly any alterations to the bailout program.
To sum up, the failed bailout talks will be continued on Monday, however the time to find a deal is tight and the future is uncertain. As we have already written, a Grexit is rather not probable (Greek banks would lost the cheap funds from the ECB), however some form of debt restructuring is on the horizon, especially that Greece is currently running a primary surplus. Because the debt is held mostly by official institutions, the direct impact on the gold market should not be too strong. However, prolonged negotiations or any default on debt would increase market uncertainty (for example, uncertainty about the future actions of other peripheral countries in the Eurozone) and volatility, supporting the gold price. It’s unclear whether this factor alone will be enough to prevent gold from sliding further, though.
Arkadiusz Sieron
Sunshine Profits‘ Market Overview Editor

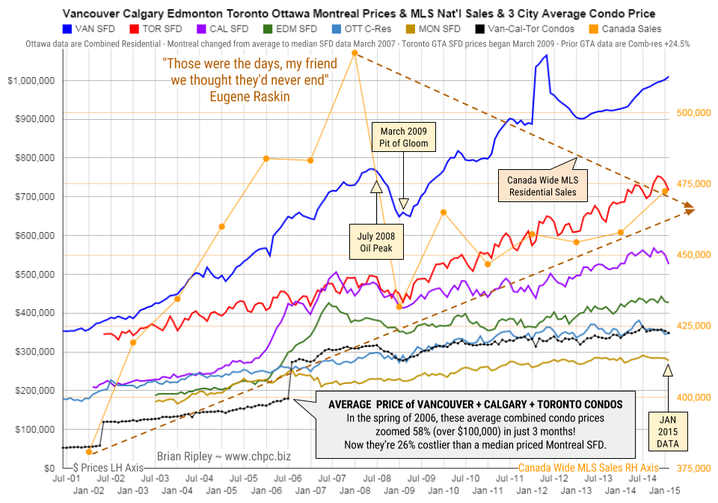
In January 2015 the big city metros took a break under their respective highs in a year that saw the total MLS sales across Canada hit the biggest single sales year since the 2008 plunge into the March 2009 pit of gloom.
It remains interesting to note that the combined average price of a Vancouver, Calgary & Toronto condo is currently 26% more expensive than a median priced Montreal SFD and note also that in the spring of 2006, those 3-City average condos zoomed 58% in price (over $100,000) in just 3 months as the buy side of the market freaked out over the inversion of the 10yr less the 2yr spread as it went negative (Yield Curve).
Mattress money has gushed into condos with no respect for fundamentals or plan for contingencies that may be required if Pit of Gloom II develops and one must write off capital gains and rely on employment earnings.

Canada or U.S. stock market? At the risk of sounding flip- pant… it depends on oil.
Seasonal tendencies favor the TSX Composite, but inves- tors should be ready to fade back to the S&P 500 if the energy trade falters.
…continue reading Brooke’s 10 page Newsletter covering Market Sectors & Key Individual stocks HERE

Mastering Moving Averages
The moving average is one of the most versatile of all trading tools and should be a part of every investor’s arsenal. The moving average is one of the most versatile of all trading tools and should be a part of every investor’s arsenal. Far more than a simple trend line, it’s a dynamic momentum indicator as well as a means of identifying support and resistance across variable time frames. It can also be used in place of an overbought/oversold oscillator when used in relationship to the price of the stock or ETF you’re trading in.
About Clif Droke:
is a recognized authority on moving averages and internal momentum. He is the editor of the Momentum Strategies Report and Gold & Silver Stock Report newsletters, published since 1997. He has also authored numerous books covering the fields of economics and financial market analysis. His latest book is “Mastering Moving Averages.” For more information visit www.clifdroke.com


-
I know Mike is a very solid investor and respect his opinions very much. So if he says pay attention to this or that - I will.
~ Dale G.
-
I've started managing my own investments so view Michael's site as a one-stop shop from which to get information and perspectives.
~ Dave E.
-
Michael offers easy reading, honest, common sense information that anyone can use in a practical manner.
~ der_al.
-
A sane voice in a scrambled investment world.
~ Ed R.
Inside Edge Pro Contributors

Greg Weldon

Josef Schachter

Tyler Bollhorn

Ryan Irvine

Paul Beattie

Martin Straith

Patrick Ceresna

Mark Leibovit

James Thorne

Victor Adair