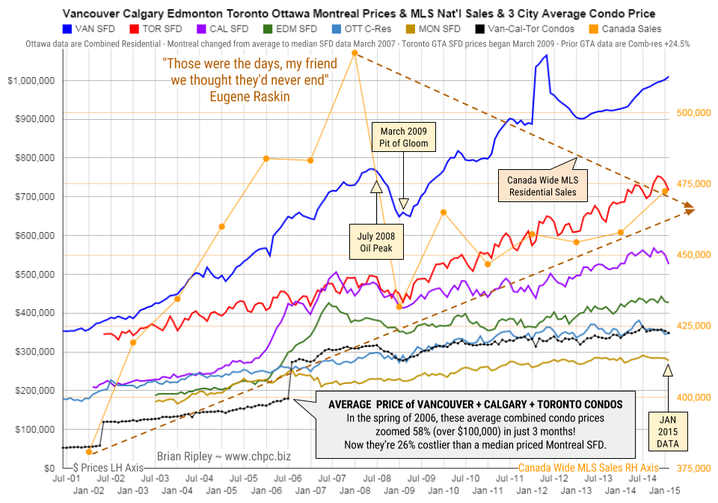
In January 2015 the big city metros took a break under their respective highs in a year that saw the total MLS sales across Canada hit the biggest single sales year since the 2008 plunge into the March 2009 pit of gloom.
It remains interesting to note that the combined average price of a Vancouver, Calgary & Toronto condo is currently 26% more expensive than a median priced Montreal SFD and note also that in the spring of 2006, those 3-City average condos zoomed 58% in price (over $100,000) in just 3 months as the buy side of the market freaked out over the inversion of the 10yr less the 2yr spread as it went negative (Yield Curve).
Mattress money has gushed into condos with no respect for fundamentals or plan for contingencies that may be required if Pit of Gloom II develops and one must write off capital gains and rely on employment earnings.