
Currency
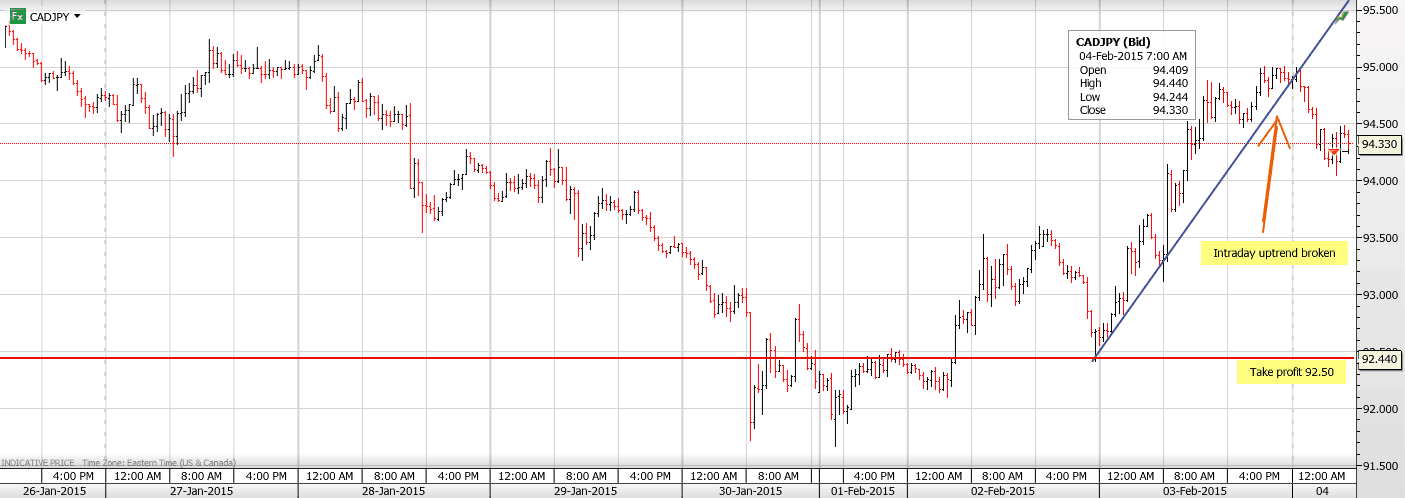
USDCAD Overnight Range 1.2468-1.2535
Friday the 13th is not considered much of a lucky day (just ask the folks at Camp Crystal Lake) and it appears traders took note and stayed on the sidelines. The Asian session showed some signs of life but not to the degree seen earlier this week. A speech by Glen Stevens, governor of the RBA, appeared to downplay the prospects for another rate cut any time soon and AUDUSD bounced. USDJPY losses in Asia were reversed in London.
In Europe, the Greek’s appear to have dialed back on the inflammatory rhetoric which has helped EURUSD hang on to earlier gains above 1.1400. The Russian/Ukraine ceasefire has eased tensions, somewhat which has helped EURUSD.
USDCAD dropped through support at 1.2510 following the release of Manufacturing Shipments which (Actual 1.7%, vs. Forecast 1%) while WTI prices gained. (Currently $52.75) However, a lack of Canadian data next week and on-going negative sentiment should limit USDCAD losses. US and Canadian holidays on Monday should ensure a quiet afternoon session, today.
USDCAD technical Outlook
The short term technicals are mixed as USDCAD is stuck the 1.2380-1.2680 trading band. Intraday, the technicals are bearish while trading below 1.2510 but needing a break of 1.2445-50 to extend losses to 1.2380. Above 1.2510 targets 1.2570 and 1.2610.
Today’s Range 1.2440-1.2510
![]()

 The natural gas market in North America is fretting about over-supply. But in another one of the world’s key natgas centers, the problem is exactly the opposite this week.
The place is Western Europe. Where unexpected events may have tipped natgas into shortage — pushing prices higher.
On Monday, the government of the Netherlands announced significant production cuts for the country’s giant Groningen natgas field. Immediately restricting the output of the field to 16.5 billion cubic meters (bcm) for the first half of 2015.
That’s a sizeable drop in output from Groningen. Suggesting that the field will produce something on the order of 33 bcm of natgas for the full-year 2015. Which would represent a 16.5% cut from the previous field production target of 39.5 bcm yearly.
This is critical to natgas supply not just for the Netherlands, but for Europe as a whole. Given that Groningen is Western Europe’s largest gas producer — and has long been an anchor of supply for the region.
And the lost production here can’t simply be brought back if prices rise. The field output is being restricted because of concerns over earth tremors in the area. With the Dutch government having come under pressure to keep output low in order to protect public safety.
That means natgas buyers across Europe will have to look elsewhere for supply. And that’s already having an effect on prices.
Platts reports that natgas prices in the U.K. particularly have been climbing. Hitting 52.50 pence per therm, or about $8 per mcf this week.
The Dutch production cuts could well drive U.K. prices even higher. Data show that natgas imports from the Netherlands into the U.K. have fallen off a cliff since the Groningen restrictions were announced. With flows on the key Bacton pipeline system having dropped to 6 million cubic meters per day, down from 30 million cubic meters just last week, prior to the Dutch decision.
This could be a sleeper trigger for natgas in this part of the world. Watch for continued data on flows into key markets like the U.K. — and surges in prices if shortages persist.
Here’s to a big shakeup,

The London Bullion Market Association represents 85% of global daily gold trading volume…..
1. Definition: Gresham’s Law
Gresham’s Law is a monetary principle stating simply that “bad money drives out good.” In currency valuation, Gresham’s Law states that if a new coin (“bad money”) is assigned the same face value as an older coin containing a higher amount of precious metal (“good money”), then the new coin will be used in circulation while the old coin will be hoarded and will disappear from circulation because of its greater inherent value. (Investopedia)
By definition, gold and silver are money.
Alan Greenspan in the fall of 2014 said that gold is superior money to all fiat currencies including the USD.
 2. The LBMA is trading digital or fiat gold (unallocated gold) that the LBMA states accounts for the vast majority of spot gold trading.
The LBMA represents 85% of global daily gold trading volume and the LBMA’s (and LPPM ) daily pricing is, according to the LBMA, the basis for “virtually all transactions in gold, silver, platinum and palladium”. What happens on the LBMA impacts the global price of silver and gold, so it is our focus.
The open interest in London can be varied to digitally increase and decrease gold and silver positions creating supply of gold and silver to market when account holders hold their ‘positions’ in the LBMA. Due to the leverage of claims vs fractional metal available for satisfaction of the claims, this dictates ulitimate market dislocation.
According to Gresham’s Law, by creating and trading virtual ‘bad money’ (i.e. unallocated or virtual gold and silver positions ), the LBMA is guaranteeing its own demise as the ‘good money’ (i.e. real gold and silver physical bars) will simply disappear from the exchange resulting in market dislocation. Virtual metal created on the LBMA short-circuits the pricing mechanism for precious metals by creating artificial supply.
The markets flow and choose a path to solve problems and the markets will flow around the LBMA and leave it stranded as it is a trading platform that has been used to short-circuit market pricing of gold and silver.
We can see from our discussion last week that the LBMA has an estimated open interest position (claims) of 400M to 600M oz of gold and 3.5 to 5.0 billion oz of silver. These open positions are completely unsustainable as the impossibility of delivery into these positions is clear to the market.
http://www.lbma.org.uk/clearing-statistics
http://www.lbma.org.uk/assets/Loco_London_Liquidity_Surveyrv.pdf
http://www.lppm.com/OTCguide.pdf

3. Dubai intends to open spot gold trading by the end of March 2015
http://gulfnews.com/business/markets/dgcx-aims-to-start-spot-gold-contract-by-the-end-of-first-quarter-1.1453407
Goal of the new Dubai gold exchange is to “set it as a benchmark Loco Dubai price for all stakeholders in China, India, and Africa etc.”
Dubai wishes to develop benchmark gold pricing for Asia and Africa.
Other physical exchanges in Singapore, Hong Kong, Shanghai, Moscow, etc. are going to rapidly bypass the LBMA’s pricing and will ultimately make the LBMA an historic artifact.
4. Some commentators say that the BRICs hold a nuclear bomb on the West which will detonate if they move to a sound money (gold) system
In reality, the LBMA and COMEX are nuclear bombs that are guaranteed to detonate because they are used to distort markets (and have been used to suppress gold and silver markets while fueling decades of financial bubbles with loose monetary policy) and according to Gresham’s Law, these exchanges will, by definition, fail as ‘good money’ leaves these exchanges with only the ‘bad money’ (digital gold and silver claims) remaining behind unsatisfied.
5. We have seen complete market failure before.
Kuwait’s “Souk al-Manakh” also dubbed the Kuwait Camel Market (KCM).
In the early 1980s, the KCM market did a round trip from $5 billion to $100 billion in market cap and back again – at its peak it had the third highest total market capitalization in the world.
Used leverage to explode the value of the Camel Market to astronomical heights (think about the 3.5 billion to 5.0 billion ounce silver open interest (claims on silver) on the LBMA)
“Adding fuel to the fire was the type of informal margin financing through the use of postdated checks, which were accepted as a cash equivalent, as per Kuwaiti custom. This type of personal credit didn’t require a bank balance; the “receiver hopes that there will be one when the due date rolls around.”… …As the Souk al-Manakh market soared to incredible new heights, many speculators became willing to issue postdated checks for double or triple a stock’s purchase price, confident that the share prices would rise by that much by the time they had to pay. (1) An informal futures market arose in postdated checks as investors, upon receiving their shares, used them as collateral to borrow even more money for stock speculation. … By September 1982, the Ministry of Finance ordered all dubious checks to be turned in for clearance, tallying the value of worthless checks at $91 billion.”
http://www.thebubblebubble.com/souk-al-manakh/
In the end, the KCM opened and there was simply silence at the Kuwait Camel Market with stocks going with zero bid. The market had seized and this is what the LBMA is heading for due to the unsatisfiable open interest claims for gold and silver created on that Market.
“It did not take a trigger to burst this bubble; it simply crested sometime in the dreadful heat of the Middle East’s summer. Its decline was so discontinuous it cannot be called a crash. There were simply no bids.”

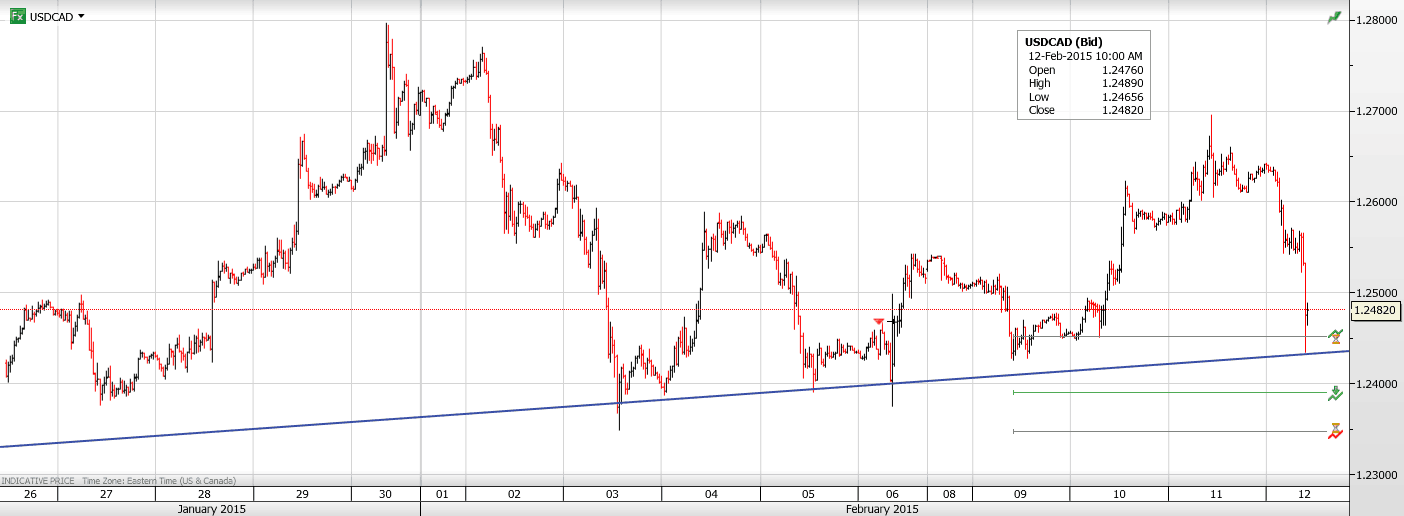
….dropping from 1.2565 since Toronto walked in, due to the unexplained 5.6% jump in WTI prices (Currently $51.41/bbl) with a dash of general US dollar weakness thrown in. A softer than expected US retail sales report is behind the US dollar sell-off vs. the majors. US Retail Sales was a negative 0.8% vs. forecast of -0.5% which has served to muddle the rate hike waters.
It wasn’t all fun and games overnight, especially for long AUDUSD positions. A weaker-than-expected Australian employment report sent AUDUSD plunging while increasing fears of another rate cut. USDJPY couldn’t break 120.30-50 and sank on a report that the BoJ thought a falling JPY would hurt consumer sentiment.
EURUSD seems to have shrugged off news of a Russia/Ukraine ceasefire while the EU/Greece negotiations are still on-going. The Bank of England’s Quarterly Inflation Report was seen as hawkish and GBPUSD rallied strongly.
USDCAD technical Outlook
The intraday USDCAD technicals are bearish following this morning’s break of support at 1.2540. The plunged halted at the next major support level of 1.2440, representing a series of bottoms following the January 15 BoC rate cut. Additional support is seen at 1.2420 representing the uptrend from the end of December, which if broken will extend losses to 1.2115. For today, USD support in the 1.2420-40 area should hold.
Today’s Range 1.2440-1.2540
![]()

It is said that an image is worth a thousand words. This chart conveys a very important message when it comes to the future direction of the stock market and whether investors should be concerned about a coming bear market. We explain the chart in more detail below.

In the very top panel of the chart you’ll notice that the stock market as measured by the S&P 500 is overbought on a long-term basis. This is no surprise and shows that we are now trading at levels seen during the two prior bubbles. That said, the stock market can remain in overbought territory for an extended period of time, which is why we need to focus on more timely signals for when this condition may reverse.
One
The first technical warning sign that we should heed is marked by a significant divergence between the relative strength index (RSI) and the market itself. This is noted by a declining pattern of lower highs in the RSI as stocks continue to make higher highs, a sign that the market is “topping out”. In the late ‘90s this divergence persisted for around two years each time the market pushed higher and began to signal alarm starting around 1998. In 2007 this divergence took place over a much shorter period (around six months) before the market finally succumbed to massive selling. Starting around late 2013 we’ve seen the RSI flatten while the market has pushed higher. At this point, it will be important to monitor whether this divergence is resolved or confirmed in subsequent moves. Again, such a divergence can persist for longer than expected (as in the late ‘90s), but does raise a red flag and indicate the market is in a topping process.
Two
The second technical sign to look for is a major crossover in the MACD (moving average convergence-divergence) indicator shown in the bottom panel. This is often used by technical analysts as a buy and sell signal. As Investopedia explains, “when the MACD falls below the signal line, it is a bearish signal, which indicates that it may be time to sell.” As shown by the dotted lines, a MACD crossover occurred in May of 2000 and December of 2007. Currently, the MACD is close to giving a crossover sell signal and will likely do so if the market again breaks below its 12-month moving average. That brings us to the third technical signal.
Three
When a major line of support becomes resistance, you now have confirmation of a trend change in the market. This occurred around January-February of 2001 and May-June of 2008 (see red circled regions on the chart) when the S&P 500 failed to break back above its 12-month moving average. After that point in time, the market persisted in a bearish downtrend until a confirmed change of direction with a new bull market. Currently, the market is trading above this major line of support but did briefly break below in October of last year.
Summary
The market is overbought and showing signs of divergence, which may indicate a market peak. Since this condition can persist, we will want to confirm whether any subsequent highs (if they occur) coincide with lower RSI readings. Secondly, we will want to see a major sell signal triggered by a crossover in the MACD, as occurred at both prior tops in 2000 and 2007. Thirdly, it will be important to confirm a major trend change in stocks when the 12-month moving average no longer acts as support, but now becomes a line of major resistance.
Again, we should not presuppose this pattern will play out on an immediate timeframe. The market may make new highs and remain in overbought territory longer than anticipated. As always, opinions are quite divided on whether stocks are already in a bubble or, conversely, in the beginning stages of a much larger advance. There are too many moving parts to predict such outcomes with any certainty. Instead, we must monitor market action, incoming data, and make adjustments as the situation requires. The chart presented is one of many tools for doing just that.

-
I know Mike is a very solid investor and respect his opinions very much. So if he says pay attention to this or that - I will.
~ Dale G.
-
I've started managing my own investments so view Michael's site as a one-stop shop from which to get information and perspectives.
~ Dave E.
-
Michael offers easy reading, honest, common sense information that anyone can use in a practical manner.
~ der_al.
-
A sane voice in a scrambled investment world.
~ Ed R.
Inside Edge Pro Contributors

Greg Weldon

Josef Schachter

Tyler Bollhorn

Ryan Irvine

Paul Beattie

Martin Straith

Patrick Ceresna

Mark Leibovit

James Thorne

Victor Adair