
Energy & Commodities
This last of three issues covering my thoughts about 2015 will focus on base metals and a couple of bulk materials with some guesses on major markets. The editorial was a long one and has been split into two parts of which this is the first. As you already know the news from this corner of the commodity universe has not been good.
The results of the ECB meeting and Greek election were as expected, only more so.
Credit where it’s due; Mario Draghi did a masterful job of playing both the traders and the Germans. He had to make a major concession to Germany and other northern central banks to close the deal. That concession will weaken the impact of the QE program but let’s not quibble during Mario’s victory lap.
The ECB is starting a €60 billion per month QE program (€50 billion new money and €10 billion in an existing program). The program is slated to run until September 2016 and the ECB left the door open to extending it. The date is not random choice. It brings the total potential buying to over €1 trillion. The ECB needed to announce a program at least that large to convince traders it was serious.
One drawback of the program is the lack of risk sharing. Central banks within the EU will buy their own country’s bonds in proportion to their size within the ECB’s capital pool. The Germans and other northern Europeans won’t be buying debt from the southern or peripheral countries. That weakens the program but Germany would not go along with any form of risk sharing and would have never agreed to a 1€ trillion price tag otherwise.
Even with all the “leaks” Draghi still managed to present surprises and deliver the weakening in the Euro he hoped for. The QE announcement caused the Euro to drop 4% in two days. The Greek situation means continued uncertainty but I think we may have just seen the bottom on the Euro now that all the “bad stuff” is out there.
There have been some better than expected economic readings out of Europe lately. That has been tempered by the ongoing Greek tragicomedy. Currently, there is optimism that a debt deal will be struck which is generating risk on buying in NY and selling in the gold market. A deal would be a good thing but I don’t think we are out of the woods yet. Germany and France insist Greece has to stick to the austerity program. Reduction or removal of that program was THE election plank for the Greek government. I don’t see how that government retains power or credibility unless it dismantles some of the austerity measures. Either the EU is willing to compromise or this drama will have more acts before it’s done. If a solution is found however I think the Euro starts moving higher.


The lower chart above shows the gold price and with the gold/USD correlation below it. The correlation has weakened quite a bit and the one shown is a moving average. Using single data points the correlation has gone negative in recent sessions. Unfortunately it picked poor times to do it. The gold price was trounced when the US released a very strong payroll report. Nonetheless, the USD has been trading sideways lately as the Euro bottomed and traders get concerned the strong greenback will be a negative for the US economy. If that trend continues we may see some support for gold and other commodity prices if the Euro does strengthen.
The deflationary trend continues to strengthen everywhere and more and more central banks cut rates. Inflation rates are still dropping in all major economies. The pullback in most commodities is but one aspect of this larger trend.
Dollar strength takes some of the blame for all this, but not all. Commodities have individual supply/demand backdrops. In the end, the supply balance for each metal will be the main determinant of price in the coming years. I don’t want to weigh you down with too much detail but I will give a quick overview of a few metal markets we have the most interest in and where I think prices will go.
Copper—a Canary or a Canard?
Copper traded much as I expected through 2014. A surplus was expected for this year and I thought the copper price would, and should, reflect that. I assumed there would be a drop in price in the 10%+ range last year. That is pretty much what happened. Then the wheels came off in January.
The chart below shows how wild the ride was. At the time I suspected the 20% drop in two days was driven by hedge funds or China based traders who had used copper as collateral on loans. Large changes in Shanghai copper inventories through 2014 seemed strange. Some of that may have been traders using copper as loan collateral much as other traders had done with iron ore.

In recent days it’s become clear my suspicions were correct. The mid-January drop was a bear raid by China based funds. That news calmed the market a bit and put in a bottom for now. Whether that lasts will depend on how large this year’s supply surplus is.
Note that Shanghai is, by far, the fastest growing metal trading market. It’s taking an ever larger market share from the London Metal Exchange. The day is coming where you’ll routinely check prices in Shanghai rather than London so China based funds cannot be ignored.
A year or so ago, the copper sector expected a surplus of as much as a million tonnes in 2015, followed by (probably) renewed supply deficits from mid-2016 on as mines depleted. Recent comments by some of the world’s biggest producers (BHP, Freeport, Codelco) indicate most of that surplus is not going to arrive. All three have cut back planned mine site expansions and development level copper projects are scarce.
China is, of course, the dominant user. Slowing growth there is a good reason to be cautious about base metals. Not too cautious though. China is still expected to grow at 6-7%. Real estate construction has slowed but there has been talk about accelerating infrastructure spending. We should still see demand growth from China.
While the recent price drop is concerning it could pave the way for a stronger rebound later. It may be enough to curtail marginal projects and has already halted several mine expansions. Nowhere is the phrase about bear markets giving birth to bull markets truer than in metals and commodities.
Big copper producers are talking their book when they claim there will be no surplus this year. I don’t expect traders to take that at face values unless they see the combined London and Shanghai copper inventories falling back later this year. They haven’t climbed much and are still relatively low compared to the past three years but after the recent scare bulls will be hesitant.
Assuming the US posts good growth, the EU a bit better and China continues accelerated infrastructure investment I think Copper should be stable this year.
One possible positive wild card is the rapid buildup of deflationary forces in China. With consumer inflation and producer input prices collapsing China now has high real interest rates. Beijing has room to cut rates quite a bit. I think they are hesitating because they fear reflating China’s property and mal-investment bubble. Understandable, but pressure to cut rates will increase and if Beijing succumbs that will be taken as a positive for copper other base metals.
If inventories fall do later this year the price should work its way closer to $3/lb by year end. I don’t think copper will get a three handle this year unless there is clear evidence of renewed growth outside the US, particularly in China.
Zinc: “Miss Congeniality”
Everyone loves it, just not quite enough. Yet.
Always the bridesmaid, never the bride. That seems to be zinc’s lot. 2014 was another year with little price movement but most commodities did worse. Zinc was one of the best performers and I think this will get repeated in 2015.

I’ve said before that zinc’s year is coming, I just wasn’t sure which year. Warehouse inventories climbed as high as 1.25 million tonnes between 2009 and 2012 but have been declining since at a rate of 2-300,000 tonnes per year. We’re not down to the levels that would trigger a real price move yet.
Current warehouse inventories are a bit under 650,000 tonnes. To see a real price move I think we need to get under 400,000 tonnes or preferably 300,000. That won’t happen this year but we will continue moving in the right direction. Production growth of 3+% per year in the next 2-3 years will be less than demand growth which is estimated at 4%+.
There are only small new operations planned during this period and the world’s third largest zinc mine, Century in Australia, should be depleted in Q3 of this year.
Galvanized steel is the largest end use and most of that us consumed by the auto industry. Worldwide car sales have hit records in the past two years and another is expected this year. We can thank zero interest rates and loose credit checks for that. The loose credit part will probably come back to bite us at some point but for now it’s all good.
Continued inventory drawdown will support the zinc price this year. It should get back above the $1.00/lb. level and could see $1.10 later in the year. Once Century goes off line the decline in warehouse inventories should accelerate as long as car sales stay up. 2016 may finally be the year when zinc stops being the bridesmaid. Once it really starts to move prices above $1.50/lb. could come quickly. It has that sort of market. I’m looking hard at a few zinc explorers and will probably add one or two in coming months.
Nickel: déjà vu all over again?
Nickel traders got pretty excited last January when the Indonesian government banned the export of unprocessed nickel concentrate. It made similar moves with copper though some of the large copper producers have been given timing extensions for getting smelters built. Indonesia wants more of the value adding activity to stay in-country particularly smelting.
There aren’t enough smelters in country for either the nickel or copper sectors. New ones are being permitted but it will take time to get them built. Indonesia does not have a great power grid and smelters are voracious power consumers. I don’t know how that will be resolved.

You can see from the chart above that nickel had a good run after the announcement tough the gains petered out fairly quickly. Like Indonesia, the Philippines has large reserves of lateritic and saprolitic nickel that can be simply upgraded to a low quality direct shipping product that Chinese smelters will buy.
A number of small Philippine operations stepped up production and helped fill the supply gap. After an initial 50% price run nickel prices softened though the remainder of the year.
Significantly perhaps, nickel has not seen declines in LME warehouse inventories. They aren’t huge but have been building steadily for a couple of years. That was one reason I was a skeptic about nickel prices staying high. Most analysts expect another good year for nickel. I think we may see a gain if growth doesn’t slow too much but I’m not sold on it being a moon shot. If LME inventories actually top out I would start looking a lot harder at nickel deals. I didn’t see many that looked good a year ago.
It may happen though I’ll be a lot more comfortable seeing inventory levels I can check dropping. I find it hard to be as bullish as many others at this point.
I do keep an eye out for new nickel plays however. Even at $6-7/lb a high grade nickel find can have impressive value per tonne. There are few good ones so a new high grade find will always get attention. Indonesia’s new Prime Minister does not sound mining friendly to me so I don’t see export restrictions getting softened. That should support a $7-8 price for nickel this year.
This early year overview will conclude with “Tarnished – Part II” that will discuss bulk minerals, oil (again) and major equity indices.
Ω
Join me at our annual Toronto Subscriber Investment Summit on February 28, 2015. For more details or to register for this limited seating event, go to: www.subscribersummit.com or watch the video now.
The HRA–Journal and HRA-Special Delivery are independent publications produced and distributed by Stockwork Consulting Ltd, which is committed to providing timely and factual analysis of junior mining, resource, and other venture capital companies. Companies are chosen on the basis of a speculative potential for significant upside gains resulting from asset-based expansion. These are generally high-risk securities, and opinions contained herein are time and market sensitive. No statement or expression of opinion, or any other matter herein, directly or indirectly, is an offer, solicitation or recommendation to buy or sell any securities mentioned. While we believe all sources of information to be factual and reliable we in no way represent or guarantee the accuracy thereof, nor of the statements made herein. We do not receive or request compensation in any form in order to feature companies in these publications. We may, or may not, own securities and/or options to acquire securities of the companies mentioned herein. This document is protected by the copyright laws of Canada and the U.S. and may not be reproduced in any form for other than for personal use without the prior written consent of the publisher. This document may be quoted, in context, provided proper credit is given.

Precious Metals have had an interesting week. Both Silver and the gold stocks rebounded off their 50-day moving averages only to do a 180 the following day. Meanwhile Gold has given back most of its January gains. In this missive we consider the near term outlook for Gold and the gold stocks.
In the chart below we plot Gold and Gold priced in foreign currencies (Gold/FC) which is essentially the inverse of the US$ index. Gold put in a strong rebound, rallying over $150/oz from November through January. That was also its strongest rally in real terms in several years. As we can see, Gold/FC drove that rally as its driving the current decline (to some degree). Gold/FC has a bit more downside to go to reach support. The fact that Gold could not hold above $1240 tells us that Gold will need more time before it can retest trendline resistance. However, Gold’s strength against foreign currencies is a major character change that wasn’t in place during 2013-2014.
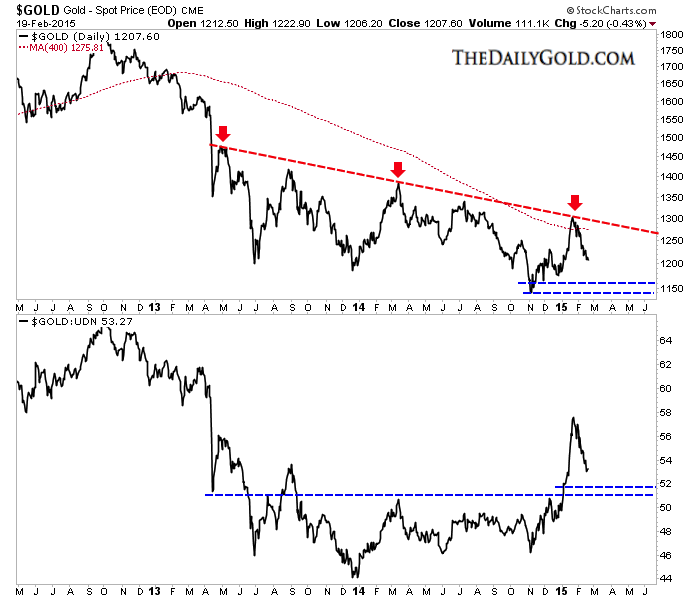
Gold & Gold priced in Foreign Currencies
Turning to the stocks, let’s start with the bears analog chart. We use weekly data from the Barron’s Gold Mining Index which dates back to 1938. Back in December we noted that gold stocks were likely at their second most oversold point in history. The most oversold point was the months and weeks prior to the bottom in 2000. Markets can do anything in the short term but this chart makes a strong case that miners are extremely ripe for a new bull market.
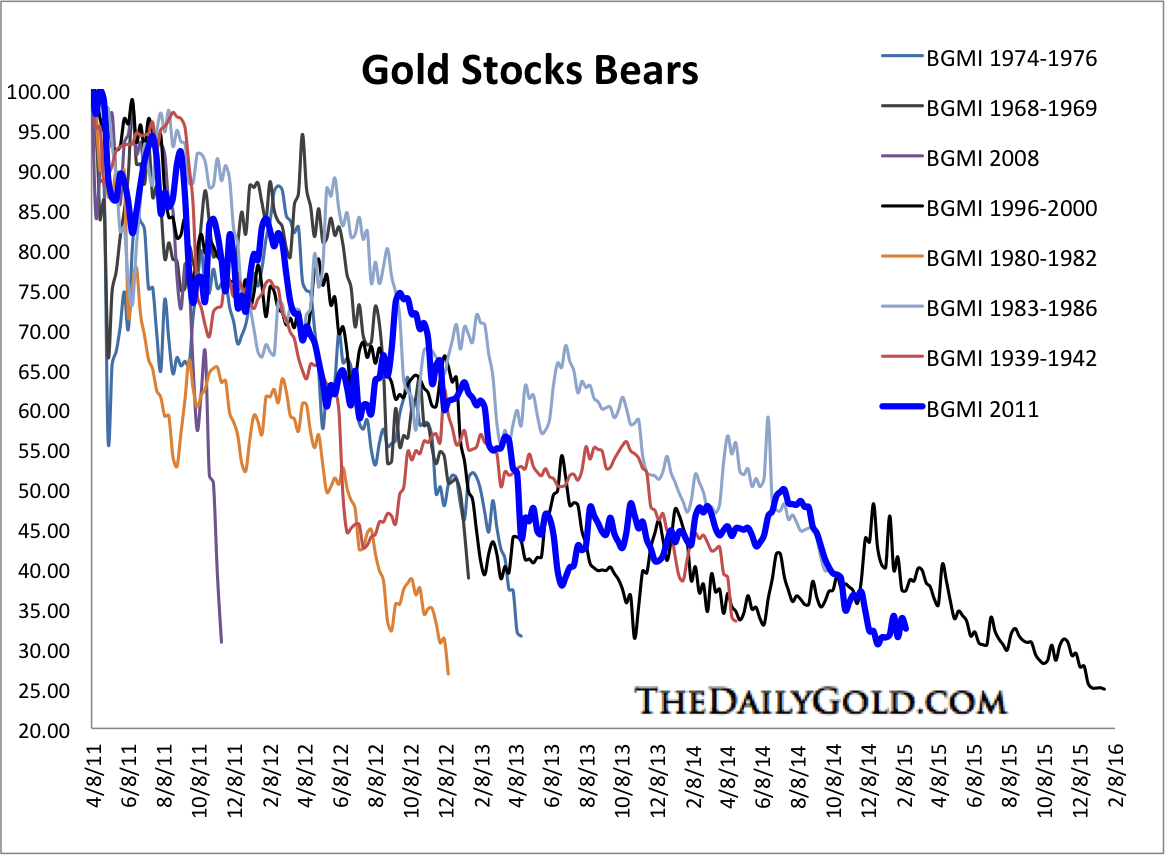
Gold Stocks Bear Markets
Next is a chart of GDX and our Top 40 Index. Both formed a strong double bottom at the end of 2014 and both will need to surpass their 400-day moving averages to be in a new bull market. The miners formed the recent low amid an extreme oversold condition. After a strong rebound, resistance has come into play. The range between strong support and strong resistance is getting smaller.
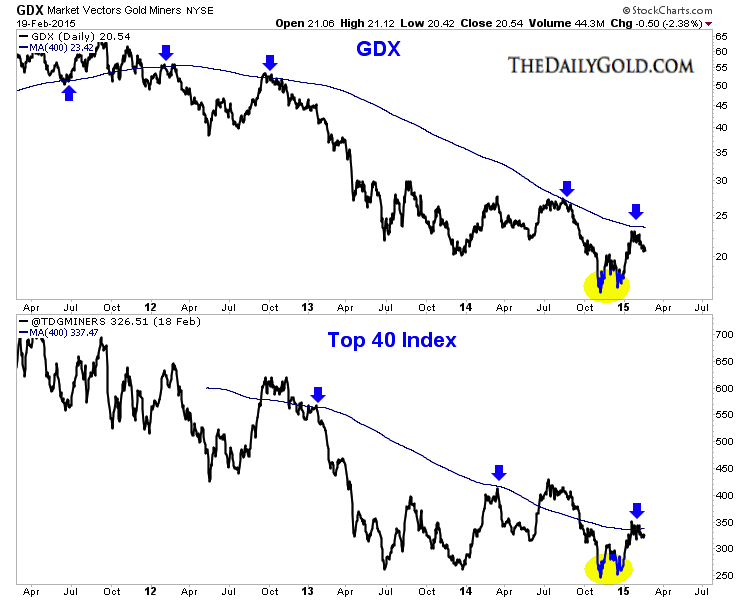
GDX & Top 40 Index
The trend for precious metals can be considered neutral or range-bound with a current bearish bias. After strong rebounds, Gold and gold shares are backing off from resistance. They aren’t yet ready to make major breakouts to lift them into bull markets. This is bearish but there have been key bullish developments in recent months which should caution bears. Both Gold and gold shares performed well amid a very strong US$ which signals a major change. Gold companies are benefitting from the collapse in energy prices and weak currencies within the jurisdictions they operate.
Because gold companies can benefit from lower energy costs and weaker foreign currencies, it’s quite possible that they could be the first, ahead of Gold to break into new bull market territory. Market heavyweights such as Jeff Gundlach and Jim Rogers may sense that as they recently became investors in the miners. A new bull market lies ahead sooner rather than later but investors and traders need to maintain their discipline and patience.
Good Luck!
Jordan Roy-Byrne, CMT

USDCAD Overnight Range 1.2442-1.2552
USDCAD spiked to 1.2550 from 1.2490, just as local traders were getting to their desks, indicative of either a “one-off”order, a simultaneous bullish USDCAD bias or both. The move may have also been a case of “if the bottom holds, try the top”.
The US dollar has recouped almost all of yesterday’s post FOMC minutes losses in a thin and choppy overnight session although the re-existing currency ranges remain intact. The FOMC minutes were considered doveish, initially and eventually dismissed with a few analysts noting that the meeting occurred prior to the strong non-farm payroll report. The Fed focus shifts to Tuesday and Janet Yellen’s Humphrey-Hawkins Testimony.
The Asian markets suffered from greatly reduced liquidity due to the Year of the Ram festivities with AUD, NZD and JPY all down. EURUSD trading was erratic within a narrow range. Another EU meeting about Greece is slated for Friday.
USDCAD technical Outlook
The short term technicals are bullish with the break of resistance in the 1.2490-1.2500 area but need to extend gains through 1.2550-75 resistance to target the 2015 highs again or risk further consolidation within the 1.2360-1.2560 trading band. For today, USD support is at 1.2520 and 1.2490. Resistance is at 1.2550 and 1.2575
Today’s Range 1.2490-1.2555


It may be difficult to look beyond the current pricing environment for oil, but the depletion of low-cost reserves and the increasing inability to find major new discoveries ensures a future of expensive oil.
While analyzing the short-term trajectory of oil prices is certainly important, it obscures the fact that over the long-term, oil exploration companies may struggle to bring new sources of supply online. Ed Crooks over at the FT persuasively summarizes the predicament. Crooks says that 2014 is shaping up to be the worst year in the last six decades in terms of new oil discoveries (based on preliminary data).
Worse still, last year marked the fourth year in a row in which new oil discoveries declined, the longest streak of decline since 1950. The industry did not log a single “giant” oil field. In other words, oil companies are finding it more and more difficult to make new oil discoveries as the easy stuff runs out and the harder-to-reach oil becomes tougher to develop.
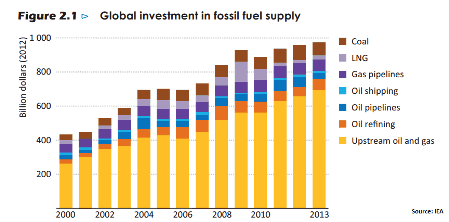
The inability to make new discoveries is not due to a lack of effort. Total global investment in oil and gas exploration grew rapidly over the last 15 years. Capital expenditures increased by almost threefold to $700 billion between 2000 and 2013, while output only increased 17 percent (see IEA chart).
Despite record levels of spending, the largest oil companies are struggling to replace their depleted reserves. BP reported a reserve replacement ratio – the volume of new reserves added to a company’s portfolio relative to the amount extracted that year – of 62 percent. Chevron reported89 percent and Shell posted just a 26 percent reserve replacement figure. ExxonMobil and ConocoPhillips fared better, each posting more than 100 percent. Still, unless the oil majors significantly step up spending they will not only be unable to make new discoveries, but their production levels will start to fall (some of them area already seeing this begin to happen). The IEA predicts that the oil industry will need to spend $850 billion annually by the 2030s to increase production. An estimated $680 billion each year – or 80 percent of the total spending – will be necessary just to keep today’s production levels flat.
However, now that oil prices are so low, oil companies have no room to boost spending. All have plans to reduce expenditures in order to stem financial losses. But that only increases the chances of a supply crunch at some point in the future. Put another way, if the oil majors have been unable to make new oil discoveries in years when spending was on the rise, they almost certainly won’t be able to find new oil with exploration budgets slashed.
Long lead times on new oil projects mean that the dearth of discoveries in 2014 don’t have much of an effect on current oil prices, but could lead to a price spike in the 2020’s.
All of this comes despite the onslaught of shale production that U.S. companies have brought online in recent years. U.S. oil production may have increased by 60 to 70 percent since 2009, but the new shale output still only amounts to around 5 percent of global production.
Not only that, but shale production is much more expensive than conventional drilling. As conventional wells decline and are replaced by shale, the average cost per barrel of oil produced will continue to rise, pushing up prices.
Moreover, with rapid decline rates, the shale revolution is expected to fade away in the 2020’s, leaving the world ever more dependent on the Middle East for oil supplies. The problem with that scenario is that the Middle East will not be able to keep up. Middle Eastern countries “need to invest today, if not yesterday” in order to meet global demand a decade from now, the International Energy Agency’s Chief Economist Fatih Birol said on the release of a report in June 2014.
In fact, half of the additional supply needed from the Middle East will have to come from a single country: Iraq. Birol reiterated those comments on February 17 at a conference in Japan, only his warnings have grown more ominous as the security situation in Iraq has deteriorated markedly since last June. “The security problems caused by Daesh (IS) and others are creating a major challenge for the new investments in the Middle East and if those investments are not made today we will not see that badly needed production growth around the 2020s,” Birol said, according to Reuters.
If Iraq fails to deliver, the world could see oil prices surge at some point in the coming decade. Despite the urgency, “the appetite for investments in the Middle East is close to zero, mainly as a result of the unpredictability of the region,” he added.
Source: http://oilprice.com/Energy/Oil-Prices/Why-Oil-Prices-Must-Go-Up.html
By Nick Cunningham for Oilprice.com

Stock Markets
The last headline about “trajectory” prompts the vision of parabolic blow-offs. In this market this would definitely include loans bundled up to finance not just new cars on the “never-never” but also second-hand cars. Of course, the latter would not include good old “beaters” that always trade for cash or a couple of six packs.
In the magnificent bull market that completed in 2007, the outstanding frenzy was in new and second-hand houses.
Despite the obvious superiority of the focus of that mania it succumbed to the usual changes in the credit markets.
General weakness into January was prompted by the initial panic in crude oil, which low was likely to be found in January. This was based upon previous crashes for crude that ran for some 6 to 7 months. January was Month 7, when the decline might have maxed out. Easing of the pressures since has popped a rally in Junk, and this is correcting spread widening.
Which is helping stock markets.
In weaker currencies, it is the adjustment in intrinsic value. In the US it is the world playing the dollar and rising P/E multiples.
How much help?
The following chart revisits NYSE margin debt and the S&P. Analyst Doug Short has updated his very good graphics. The pattern is that the amount of margin enthusiastically surges to a high and some time later the S&P peaks.
In this presentation the plot is of the differences between positive and negative credit balances. This reached the extreme in January 2000 and the highest Monthly Close in the S&P was set in August of that fateful year. The lead was 7 months.
In 2007, the extreme in employed (negative) credit was reached in June 2007 and the S&P high was set in October. The lead was 4 months.
This time around, the credit extreme was reached in July and on the Monthly basis the high for the S&P was set at 2094 in December. The lead counts out to 5 months, which number is becoming interesting.
Doug Short (www.dshort.com) deflates the series by the CPI and the S&P’s mighty effort has martched but not exceeded the peak reached in 2000. Deflated margin reached $380 billion then, and is at $410 billion on the December posting.
Stockwise, the Fed is not getting the “bang for the buck” that it got in 2000. Wonder if this relates to the old saw about it taking ever-increasing issuance of debt to get a unit of GDP growth.
Worth adding is that since 2011, it seems that even an infinite credit expansion would not have been unable to ramp up many commodity prices.
The truth of the matter, is that the success of speculative policy by the FMOC ultimately rests upon speculators in the private sector. And it is worth repeating that it’s the people around the world that decide which asset is to be ramped up. On the latter, the individual speculator has never had such encouragement from the establishment. It reminds of the Barrett-Jackson car auctions. Mainly American “collector” cars are dramatically presented and B-J has representatives (in nice blazers) standing in front of bidders and cheerleading them to keep raising their bids.
Not dignified – quite like central bankers Draghi and Yellen.
It is a privilege to be in the markets during such an extraordinary segment of financial history.
And just where is this history heading?
At some time, into the greatest mark down of wealth in history, which has always been consequent to massive inflation of credit.
In the meantime, the stock market continues to work on the big Rounding Top. Buyer excitement has registered sentiment and momentum numbers only seen at cyclical peaks. This marked the Enthusiasm phase, which has been followed by Divergence and Volatility. The sequence eventually discovers Resolution.
That will start when the NYSE Comp (NYA) decisively takes out some key markers. It has been trading either side of the 50-Week ma, which had provided key support since 2012. Staying under for a few weeks would show change.
Such a change would likely be associated with disappointment in earnings and/or in having to fix yet another problem de jour.
Change is what the establishment is trying to prevent.
NYSE: Leverage

- The highlight of this graphic is that impetuous expansion of margin spikes well before the senior indexes do.
- The extension of trend in the stock market is impressive.
- It reminds of the Wile Coyote cartoons.

Cartoonist Chuck Jones created the coyote and his biography notes that when “Wile”discovered gravity, he always plunged for 18 film frames.
Credit Markets
A little old-fashioned stuff going on recently. This business cycle is maturing and over the past few weeks long rates are increasing as junk rates decline. The long bond got overdone with the plunge in crude oil and – drum roll – Draghi’s announcement about actually buying Eurobonds. Junk rallied out of a Springboard Buy, and on a flight to risk.
Car sales and Consumer Confidence numbers have been soaring and Obama’s Gallup Approval reached 50 percent (highest since May 2013) at the end of January. Not to overlook an unbelievably good unemployment number at 5.6%.
How long will the confidence remain so lofty?
The bond future reached an exceptional high at 152 at the end of January. It also reached exceptional technical readings. Early in January we began the theme about an important “Ending Action”. Subsequent Chartworks outlined what was needed for an important top.
In two steps the future has declined to 146.46, takes out the 50-Day ma.
This represents serious technical damage, but it is temporarily oversold. A bounce seems likely.
Over in Europe, the bond-buying mania became very excited; on the expectation of the ECB finally figuring out how to implement the plan. Our question has been about just how much of this has been discounted by the market.
That’s on the overall market and we have been watching for a growing awareness that risk can’t be limited to just Russia, or more recently Greece.
Russian Ten-Year yields have been rising since 2013, due to self-inflicted problems. However, we can now consider that the rise since the low in February 2014 has been a leading event. That low was 9.85% and the high in January due to crude oil concerns was 14.39%.
The Greek yield set its serene low in August at 5.56% and its panic high at 11.31% at the first of the month.
It was a long time from Greece’s August low to the low for Spanish yields in January. This has reversed trend and charts follow. The same pattern holds for England, Italy and Portugal.
The German yield continues its decline to 0.317% earlier today. This in no way can be considered “reaching for yield”. Positioning must be mainly by highly speculative accounts. Should the trend continue to zero (0), would the note become currency?
We a watching to see if the trend change extends in the other issues. Perhaps after the Bond Future has a brief bounce.
The US Treasury curve corrected in January and flattening has resumed. The boom can run for some 12 to 16 months against a flattening curve. The “low” was in late November, which makes March the 14th month on the count.
Commodities
Crude oil continues to work on the “Paradigm Shift”. This would be due to the usual post-bubble pressures on most commodities and in crude’s case, the lead provided by a similar “Shift” for natural gas prices.
On timing, once the price cracked we noted that severe bears for crude ran for 6 to 7 months. That counted out to January when we noted that a “pause” was possible. The low was 53.58 in late January.
There has been some wild swings within a possible period of stability. Also noted was that after a crash, it can take a number of months to set the base from which an intermediate rally would follow. The big swings could be due to aggressive traders expecting a “V” bottom when Mother Nature has something else in mind.
With this, natural gas has plunged to new lows for the move. The last high was 6.49 in February last year. This was driven by last winter’s unusually low temps. With a modest El Nino, this winter in North America is not as severe.
Natgas is somewhat oversold and could recover with crude.
Stable to rising energy prices would be a positive for junk bonds, other commodities as well as for the overall stock market.
Precious Metals
There seems to be a few Paradigms in the air these days.
Crude oil is working on one kind and gold is working one of different nature.
Both have 300 years of precedent, so there are no surprises.
They are opposite and this is important. During booms orthodox investments in stocks, junk and commodities go up and the real price, or purchasing power of gold goes down. This is within the pattern of booms and busts going back to the first financial mania – the South Sea Bubble of 1720.
It is a consistent record with gold’s real price generally declining during a long expansion and declining distinctively during a financial bubble. Then it turns up, starting a cyclical bull market against the initial post-bubble collapse.
One proxy for gold’s real price is our Gold/Commodities Index (GCI), which set a key low in May 2007 and in turning up signaled the beginning of the financial collapse that was “discovered” in early 2008.
Going the other way, the GCI set its cyclical high in February 2009 and in turning down signaled the end of that collapse.
This bottomed in June and is on a cyclical bull market that is signaling the eventual end of the first orthodox boom out of 2009. Gold’s real price will continue to rise and will eventually prompt a cyclical bull market in most gold shares.
In November we were not looking for a “V” bottom. We were looking for a “precarious” bottoming process with some guidelines. This would have gold shares beginning to outperform the bullion price and silver outperforming gold.
This has been working out and while the advice has been to accumulate on weakness, we are not fully invested.
Greece: Ten-Year

- Upon the inspiration of “all can be made well”, the low yield was set in August at 5.57%.
- The key breakout to increasing rates occurred at 6.75% at the end of September.
- The initial panic drove the yield to 11.72% at the end of January.
- Russian notes have led the action. The key breakout was at 9.85% in February 2014. The initial panic high was 14.39% in January.
Spanish Ten-Year

- The low yield was set at 1.40% on January 26th.
- The key breakout was rising through 1.47% on February 2nd.
- Rising above 1.71% will extend the trend.
Fed Funds Rate

- There has not been a decline like this since the early 1930s.
- As Aristotle observed: “like events have like causes”.
- There are now “veterans” in the markets that have never experienced a meaningful increase in the administered rate.
- That would hold for some central bank staffers as well.
Zero Hedge Finds an Amusement

Link to Bob Hoye interview on TalkDigitalNetwork.com: http://talkdigitalnetwork.com/2015/02/a-privilege-to-witness-our-financial-times/


-
I know Mike is a very solid investor and respect his opinions very much. So if he says pay attention to this or that - I will.
~ Dale G.
-
I've started managing my own investments so view Michael's site as a one-stop shop from which to get information and perspectives.
~ Dave E.
-
Michael offers easy reading, honest, common sense information that anyone can use in a practical manner.
~ der_al.
-
A sane voice in a scrambled investment world.
~ Ed R.
Inside Edge Pro Contributors

Greg Weldon

Josef Schachter

Tyler Bollhorn

Ryan Irvine

Paul Beattie

Martin Straith

Patrick Ceresna

Mark Leibovit

James Thorne

Victor Adair