
Timing & trends
I’m writing to you today from the 30th floor of the Hilton Chongqing in Chongqing, China — where I just arrived to kick off a two-week tour of China’s Silk Road 2.0 — the 21st century version of the ancient, 2000 year old Silk Road trading route that connected China to Europe and beyond.
You probably never hear of Chongqing. Yet it’s a city of 8 million people and the capital of the province, where nearly 34 million Chinese make their home.
Chongqing covers a large area crisscrossed by rivers and mountains. The Daba Mountains stand in the north, the Wu Mountains in the east, the Wuling Mountains in the southeast, and the Dalou Mountains in the south.
 The province slopes down from north and south toward the Yangtze River. I’ll be here for a few days scouting opportunities for my subscribers to my Real Wealth Report.
From here, I’ll cruise down the Yangtze River to various spots along China’s entirely new Maritime Silk Route which will create a new trading route from China down to Indonesia.
And then, I’ll be off to Xian and Lanzhou, two more cities along China’s new Silk Road — all in the name of finding my subscribers the many new opportunities here for enormous wealth creation …
In what is rapidly becoming the biggest infrastructure build out in the history of civilization. A nearly trillion dollar project that is unprecedented in scope and size.
Don’t worry, if you are not a subscriber to Real Wealth Report, you’ll still be able to follow my travels and learn of the luscious profit opportunities. I’ll make sure of it.
Also, don’t worry: Though I’ll be traveling through some pretty remote places in China via water and rail, I have full access to the Internet to monitor the markets, speaking of which …
The U.S. Dollar Remains in a Raging New Bull Market
Sure, there will be some setbacks along the way for the dollar. But the recent rally in the greenback — a whopping nine-month 20.9 percent gain in the Dollar Index, a basket of six currencies including the euro, the Japanese yen, the pound, Swiss franc, Canadian dollar and Swedish krona — is merely just the beginning phase of the dollar’s new bull market.
There are several reasons the dollar is strong. I’ve covered most of them in various columns and in even more detail in my Real Wealth Report.
For now, simply know this: All the pundits out there calling for the death of the dollar and hyperinflation in the United States are dead wrong!
They simply don’t understand the global economy. They don’t understand that the trillions of dollars printed by the Federal Reserve mostly went to foreign investors, who in turn, used those dollars to borrow still more dollars.
They don’t understand that private sector dollar-denominated loans around the globe are now as high as $3 trillion, meaning not only that the world is awash in dollars, but the constant creating of new dollar loans as well as the rolling over and paying off of older dollar loans means dollar demand is also soaring.
And they don’t understand that the fiscal and monetary measures being taken by the leaders of Europe are also dollar bullish, euro bearish.
What’s worse is that they can’t see the writing on the wall: The leaders of Europe and Washington are both waging tax witch hunts on their citizens, actions that are also dollar bullish …
As Europeans seek shelter outside their own country …
And Washington wages a witch hunt on every American citizen, myself included, who has money overseas.
All this is dollar bullish and it will remain so for many months to come. It will only end, unfortunately, when the dollar becomes so strong — and deflation in the U.S. so bad —
That the Treasury and the Federal Reserve both begin to aggressively devalue the U.S. dollar once again.
That’s many moons away. For now and for the foreseeable future, you can expect …
FIRST, more downside pressure on the euro. In fact, as I pen this issue from my hotel room in Chongqing, the euro is approaching a new low, the Dollar Index a new high.
SECOND, a continued bear market in commodities. Yes, there will be some short-covering rallies now and then, in the precious metals, in the energy markets, in grain markets and more.
But overall, the commodity sector, precisely as I have been forecasting, remains in a bear market that has not ended …
And will not end until we see rivers of blood in the streets in all commodity sectors … including fresh new lows in virtually all commodities.
For now, stay safe and stay tuned …
Best wishes,
Larry
– See more at: http://www.swingtradingdaily.com/2015/03/04/larry-here-reporting-from-china-on-silk-road-2-0/#sthash.Iq6yFiDE.dpuf

 Is there anything Apple can’t do?
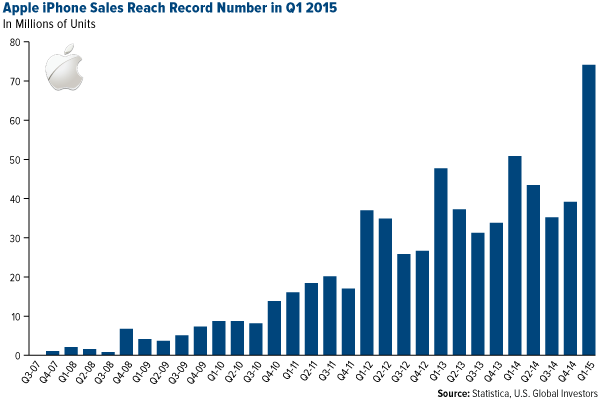
First it revolutionized the personal computing business. Then, with the launch of the iPod in 2001, it forced the music industry to change its tune. Against initial market reservations, the company succeeded at making Star Trek-like tablets hip when it released the iPad in 2010. And in Q1 2015, a record 75 million units of its now-ubiquitous iPhone were sold around the globe. The smartphone’s operating system, iOS, currently controls a jaw-dropping 89-percent share of all systems worldwide, pushing the second-place OS, Google’s Android, down to 11 percent from 30 percent just a year ago.
As you might already know, the company that Steve Jobs built—which we own in our All American Equity Fund (GBTFX) and Holmes Macro Trends Fund (MEGAX)—is history’s largest by net capitalization. In its last quarterly report, Apple posted a record $75 billion in revenue and is now sitting pretty on a mind-boggling $180 billion in cash. Many analysts believe the company will reach a jaw-dropping $1 trillion in market cap.
So what’s Apple’s next trick?
How about moving the world’s gold market?
iGold
 This April, Apple will be venturing into the latest wearable gadget market, the smartwatch, joining competitors such as Samsung, Garmin and Sony. All of the models in Apple’s stable of watches look sleek and beautifully designed—just what you’d expect from Apple—and will no doubt be capable of performing all sorts of high-tech functions such as receiving text messages, monitoring the wearer’s vitals and, of course, telling time.
But the real story here is that the company’s high-end luxury model, referred to simply as the Apple Watch Edition, will come encased in 18-karat gold.
What should make this news even more exciting to gold investors is that the company expects to produce 1 million units of this particular model per month in the second quarter of 2015 alone, according to the Wall Street Journal.
That’s a lot of gold, if true. It also proves that the Love Trade is alive and well. Apple chose to use gold in its most expensive new model because the metal is revered for its beauty and rarity.
To produce such a great quantity of units, how much of the yellow metal might be needed?
For a ballpark estimate, I turn to Apple news forum TidBITS, which begins with the assumption that each Apple Watch Edition contains two troy ounces of gold. From there:
If Apple makes 1 million Apple Watch Edition units every month, that equals 24 million troy ounces of gold used per year, or roughly 746 metric tons [or tonnes].
That’s enough gold to make even a Bond villain blush, but just how much is it? About 2,500 metric tons of gold are mined per year. If Apple uses 746 metric tons every year, we’re talking about 30 percent of the world’s annual gold production.
 To put things in perspective, the Sripuram Golden Temple in India, the world’s largest golden structure, is made from “only” 1.5 tons of the metal.
TidBITS acknowledges that the amount of gold is speculative at this point. Two troy ounces does seem pretty hyperbolic. But even if each luxury watch contains only a quarter of that, it’s still an unfathomable—perhaps even unprecedented—amount of gold for a single company, even one so large as Apple, to consume.
Ralph Aldis, portfolio manager of our Gold and Precious Metals Fund (USERX) and World Precious Minerals Fund (UNWPX), likens the idea of Apple buying a third of the world’s gold to China’s voracious consumption of the metal. As I mentioned last week, China is buying more gold right now than the total amount mined worldwide.
“If the estimates of how much gold each watch contains are close to reality, and if Apple’s able to sell as many units as it claims, it really ought to help gold prices move higher,” Ralph says.
But Can Expectations Be Met?
Here’s where this whole discussion could unravel. Although we don’t yet know what the Apple Watch Edition will retail at, it’s safe to predict that it will fall somewhere between $4,000 and $10,000, placing it in the same company as a low-end Rolex.
With that in mind, are Apple’s sales expectations too optimistic?
Possibly. But remember, this is Apple we’re talking about here. Over the years, it has sufficiently proven itself as a company that more-than-delivers on the “if you build it, they will come” philosophy. Steve Jobs aggressively cultivated a business environment that not only encourages but insists on “thinking different”—to use the company’s old slogan—risk-taking and developing must-have gadgets.
“Our whole role in life is to give you something you didn’t know you wanted,” says current Apple CEO Tim Cook. “And then once you get it, you can’t imagine your life without it.”
A perfect case study is the iPhone. When it launched in June 2007, the cell phone market was decidedly crowded. Consumers seemed content with the choices that were already available. Why did we need another phone?
Yet here we are more than eight years later, and as I pointed out earlier, 75 million iPhones were sold in the last quarter alone.
So it’s not entirely out of the realm of possibility for Apple to move 1 million $10,000 Apple Watch Editions per month.
Early in January I shared the following chart, which shows various analysts’ Apple Watch shipment forecasts for 2015, ranging from 10 million to 60 million units. Of course, allmodels are included here, not just the luxury model.
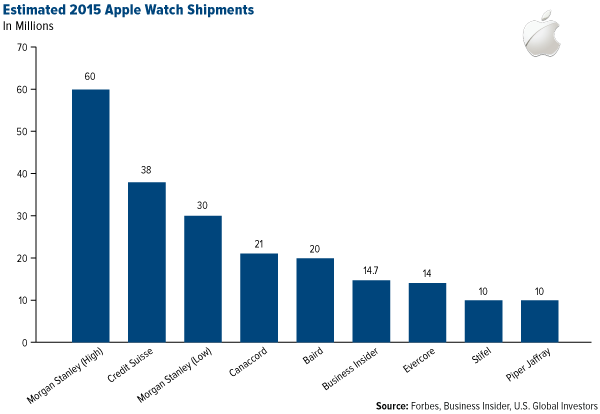
Looking at it now, many of the predictions seem a little understated. After all, Apple hasn’t released a dud product in at least two decades (remember the Newton?). Come April, we’ll see for sure what the demand really is—for the Apple Watch as well as gold.
Global Metals & Mining Conference
The weekend before last, I attended the BMO Metals & Mining Conference in Hollywood, Florida, along with Ralph, Brian Hicks, a portfolio manager of our Global Resources Fund (PSPFX), and junior analyst Alex Blow.
“Generally speaking, companies have streamlined operations and are focused on shareholder returns,” Brian said.
Alex came away from the conference with renewed conviction that the global climate is conducive for gold, citing central bank easing policies and increasing volatility in world currencies, both of which support the yellow metal’s performance.
“It looks as though gold has technical support and that a bottom has been reached,” he said. “If the eurozone really picks up, gold demand should rise, which would also benefit China since its primary gold export destination is the eurozone.”
The past year month has been flowing into risk on assets like US equities. And when money is flowing into one investment class there is typically an outflow in others. Commodities in general have been beaten up bad but there is some money to be made here using the livestock COW ETF.
I is amazing how almost all us equity sectors have rallied as big as they have with many still making new sector highs. The only true weak areas in the market look to be commodities specifically precious metals, oil, natural gas, grains, sugar and livestock.
When the US equities market starts to sell off and volatility rises money should start to flow into some of these underperforming areas. At the moment COW is the only one that looks ready for a bear market rally currently.
Precious metals miners are another area I am looking to trade but I have not seen any signs why anyone should enter yet.
The chart below shows my analysis and forecast going forward. Those who prefer trading spot prices via FOREX/CDF/Spread Betting can use a company like AVAFX which I use also. The nice thing about trading this way is that you can trade 24/7, you get a lot of leverage, and it’s commission-free trading.

To Have A Cow Or Not? That Is The Question!
The COW ETF could be a choppy ride for a while, but the upward momentum looks to have started as of today.
I am currently long COW with my peak target set around the $29 level.
Follow all my trades in real time at www.TheGoldAndOilGuy.com

Going into 2015 the economic outlook held by the U.S. investment establishment could not have been much more positive, and more unified. Pundits saw all the variables aligning to create the best of all investment worlds, a virtual “no-brainer” of optimism. Many believed that the 5.0% annualized growth in 3rd quarter would stay strong in the 4th Quarter and then usher in a strong 2015, which many believed would be the best economic year since the crash of 2008. The only question that divided most forecasters was how good the year would be.
High degrees of certainty can be dangerous. Herd mentality can cause investors to chase returns en masse and pile into positions that may already be overvalued. But herds can be spooked, most often by unexpected developments which can catch the herd wrong-footed and spark major movements when the masses scatter at the same time. When that occurs, those who resisted the herd may find themselves rewarded. We believe that we are approaching such a point.
Although the employment reports continue to bathe the economy in the diffuse light of recovery, many of the less followed economic indicators have further diverged from expectations in the opening months of 2015. Many economists initially believed that GDP in the 4th quarter 2014 would come in at an annualized pace north of 3.0%. But, in January the actual number came in at 2.6% (which was revised down to 2.2%). Recent data in such categories as consumer spending (which after falling in December, declined again in January – the first consecutive monthly declines since 2009), factory orders, trade, manufacturing, and business investment have missed on the downside. But these lesser reports are often explained away and have not made much of a dent on overall optimism.
In the six years since the Great Recession began in 2008, the economy has been boosted by both monetary and fiscal stimuli. The Federal Reserve has held its overnight rate at 0% while expanding its balance sheet by almost $4 trillion, and the Federal government had run four consecutive $1 trillion plus budget deficits (before pulling back to less than half a trillion annually more recently). But despite these unprecedented levels of stimulus, real GDP growth in the U.S. averaged just 2.2% from 2010 through 2014, which compares with an average of almost 3.5% in the post-WWII period. If this substandard growth is all we could achieve with the floodgates wide open, why should we expect that the economy will improve in 2015 if the stimulus doesn’t return, as few expect it will?
Despite the records being set almost daily on Wall Street, (today the NASDAQ eclipsed 5,000 for the first time in almost 15 years), optimists claim that the market is not overvalued because the current S&P 500 price-to-earnings ratio, of about 19 times trailing 12 months earnings, is not too far above the historical norm of about 14. But most investors have not considered the extraordinary factors that helped push up earnings, artificially we believe, in 2014.
According to Bloomberg, in 2014 S&P 500 companies spent an estimated $565 billion (or 58% of corporate earnings) on share buybacks, a figure that is extremely high by historical standards. Money spent on buybacks is not available to purchase new plant and equipment, to fund research and development, or to spend on marketing and logistics. In that sense, buyback spending generates current earnings at the expense of future earnings. Corporate results have also been boosted by zero percent interest rates, which have allowed businesses to borrow cheaply.
To factor out these short-term earnings distortions, we suggest that investors should look past current P/E ratios and instead look at Cyclically-Adjusted-Price-to-Earnings (CAPE), which is also known as the Shiller Ratio, a metric that looks at earnings over a 10-year period thereby smoothing out cyclical and economic anomalies. Looked through a lens of CAPE ratios, the U.S. markets begin to look very expensive in comparison to other global markets. The graph below tells the tale:
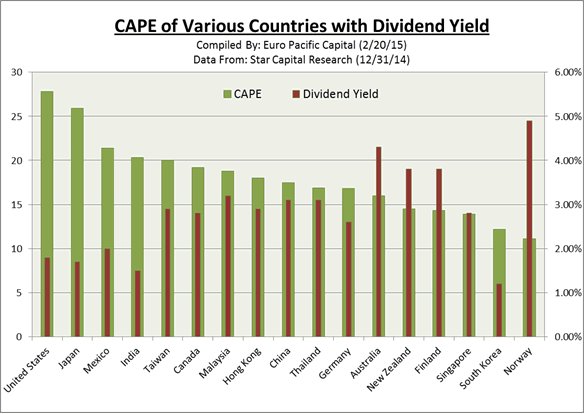
In addition, U.S. stocks currently offer some of the lowest dividend yields to compensate investors for the higher valuations (see chart above). The current estimated 1.87% annual dividend yield for the S&P 500 puts it far below the annual dividend yields of Australia, New Zealand, Finland and Norway.
In 2014 the S&P 500 outperformed stocks in the rest of the world (as represented by the MSCI Index of non-U.S. global markets) by an astounding 20%. This was by far the largest gap in the past 13 years. But on Wall Street, investors generally chase returns. After six consecutive years of positive gains in the S&P 500 (and more than 200% return since March of 2009), few forecasters see any reason to suspect that the upward run of U.S. stocks will end anytime soon.
But should we really expect another year of such results? Would it not be more logical to suggest that the slowing economy will crimp potential over-performance of U.S. markets in 2014? Given that the S&P 500 has not been among the top performers over a 10-year timeframe [see 2015 Global Investor Newsletter] news, would we not at least expect the index to begin moving back to trend, and perhaps underperform world markets in coming years?
Don’t be fooled by the madness of the crowd. The U.S. is not the sole remaining engine of world growth as the talking heads would seem to have you believe.
The good news is that unloved assets may be attractively priced. At a time when energy and labor costs are at multi-year lows, and gold priced in some non-dollar currencies is approaching all-time highs, there are overseas gold mining stocks trading at levels consistent with lower gold prices. The fall in oil has pushed many energy stocks down by 50% or more. In addition, currencies issued by fiscally solvent nations are at fresh multi-year lows.
The above is an abridged version of a longer article that appears in the Winter 2015 Euro Pacific Global Investor Newsletter


-
I know Mike is a very solid investor and respect his opinions very much. So if he says pay attention to this or that - I will.
~ Dale G.
-
I've started managing my own investments so view Michael's site as a one-stop shop from which to get information and perspectives.
~ Dave E.
-
Michael offers easy reading, honest, common sense information that anyone can use in a practical manner.
~ der_al.
-
A sane voice in a scrambled investment world.
~ Ed R.
Inside Edge Pro Contributors

Greg Weldon

Josef Schachter

Tyler Bollhorn

Ryan Irvine

Paul Beattie

Martin Straith

Patrick Ceresna

Mark Leibovit

James Thorne

Victor Adair