
Asset protection
 As people continue to digest breaking news out of Greece and Ukraine, today the Godfather of newsletter writers, 90-year-old Richard Russell, warned central bankers are now moving to protect themselves ahead of a historic global crash.
Richard Russell: “Everybody and his brother are talking about when the Fed may raise rates, but few are talking about why the Fed may raise rates. But Richard Russell knows. The Fed will raise rates to protect its fanny. Remember when Alan Greenspan let the housing market go crazy and then crash? Greenspan’s answer was that nobody can tell when things get too hot, but after they crash, we should simply clean up the mess.
…..continue reading HERE

The precious metals sector is oversold and due for a bounce. Miners and metals have endured severe declines in recent weeks and are likely to rebound from the 2014 lows. The miners are just starting to rebound and the metals should follow. However, until proven otherwise this appears to be an oversold bounce that could last only a few weeks. Potential danger lies ahead before a sustained turnaround.
Below is Gold’s weekly line chart dating back to 2007. The metal has traded within in a slight descending channel for nearly two years. A break below such a channel would typically lead to an accelerated decline. If Gold makes a clear weekly close below $1150/oz then it could start to break lower in accelerated fashion towards $1080/oz, the 50% retracement of the entire bull market. Gold does not have strong support until the $1000 to $1040/oz range. Also, though Gold is extremely oversold in a long term sense, that is not the case from a near term view. A move below $1080/oz within the next seven weeks would bring Gold to an extreme near-term oversold condition.
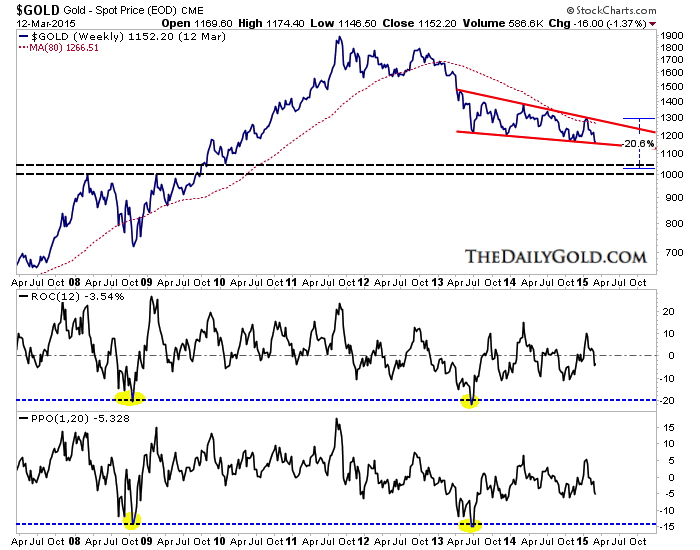 Gold Weekly
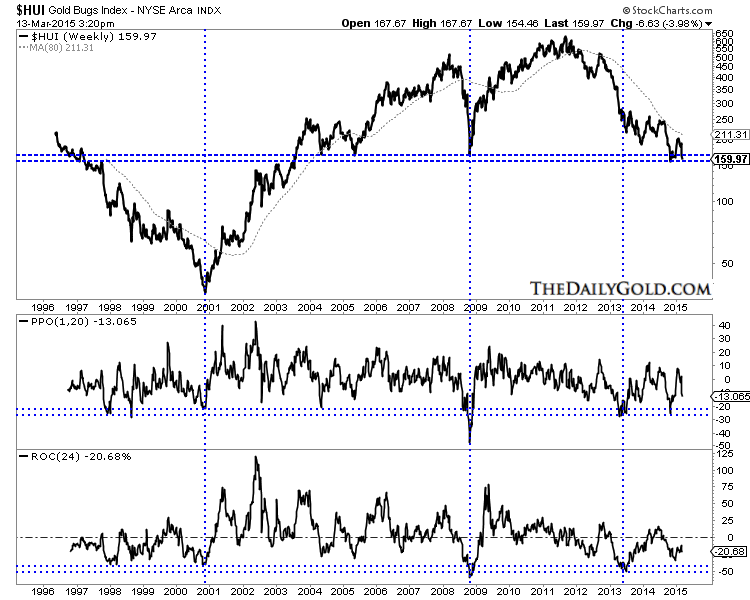
The gold stocks are entering the fourth year of their bear market and have essentially repeated the 1996-2000 bear market. In the chart below we compare the HUI’s current bear with its 1996-2000 bear. Note that the HUI made a marginal new high five months after the majority of mining stocks peaked. Otherwise its resemblance would be even closer to its 1996-2000 bear.
 HUI Bears: 2011-2015 & 1996-2000
A few weeks ago we posited that gold stocks could hold the recent lows and perhaps form a huge double bottom. That is now highly unlikely as the sector sold off aggressively when Gold lost $1200. The HUI, trading around 160 has support at 150 to 160. Like Gold it is not yet extremely oversold in the near term sense and lacks immediate downside support. The indicators shown on the chart have much further to go before they reach the extremes seen in 2000, 2008 and 2013. Traders and investors need to be aware of the severe downside potential before a bear market bottom.
Gold bugs should strongly consider using any strength to defend themselves against the potential downside that lies ahead. Other than at $1080/oz, Gold does not have strong support until $1000 to $1040/oz. The HUI lacks strong support below 150. Also, gold miners tend to have severe losses before major bottoms. During the financial crisis the HUI declined roughly 50% within a month of its final low. The HUI also declined 34% during the last two months of its 1996-2000 bear. It’s important to note that this is a small sector and forced selling by a few funds can exacerbate losses. A break below 150 HUI could get quite ugly but it would ultimately lead to a spectacular V bottom.
Jordan Roy-Byrne

In the movies, an edgy musical score is an effective tool that warns the audience something really bad is about to happen. Like the shrill screech in Psycho, certain sound effects forebode impending doom. In like manner, economics also has a similar warning sign of imminent market chaos. This omen is called the inverted yield curve. And it’s no coincidence that the last seven recessions have been preceded by this ominous predictor of economic and stock market disaster.
The yield curve graph depicts the slope of sovereign bond yields across all maturities. When investors desire to purchase longer-dated maturities, they typically demand a higher yield to compensate for inflation risks that tend to increase over time. Therefore, under normal circumstances, longer-term bonds yield more than their short-term counterparts. Typically, the yield on 30-year Treasury bonds is three percentage points (300 basis points) above the yield on three-month Treasury bills. When the yield curve steepens from that usual spread it means long-term bond holders believe the rate of inflation will increase sharply in the future.
At the other end of the spectrum we have the inverted yield curve. This occurs when the Fed Funds Rate and short-term U.S. Treasuries offer higher yields than longer-dated issues. The signal here is that investors anticipate an environment of sharply slowing economic growth, deflation and economic turmoil.
How This Played Out During The Past Two Recessions?
By the late spring of 2000, the rate on the 10 year note was lower than the Fed funds rate; thus officially inverting the yield curve. The Federal Reserve raised the Fed funds rate 25 basis points on March 21st from 5.75, to 6.0%. Afterwards, the Fed ended its rate hike campaign in May of that year with a 50 basis point rate increase to 6.5%, while the Ten-year Note traded below 6.0% by June. After this, the S&P 500, which was not a part of the tech bubble, peaked in July of 2000 and dropped 40% by September of 2002.
Likewise, in June 2006 the Fed ended its multi-year cycle of rate increases, taking the Funds Rate up 25 basis points to 5.25%, while the 10-year Note yielded around 5.0% during that same timeframe. The yield curve officially inverted for the second time that decade — investors once again heard the ominous music playing. The backward yield curve first caused the massive housing bubble to rollover in the summer of 2006. And, since the yield curve remained inverted for over one year, the equity market quickly followed the collapsing real estate market. The S&P 500 plummeted 50% from July of 2007, to March 2009.
Today the 10 year note is trading around 2.25% and the Fed Funds rate is in the 0-25 basis point range. During the Fed’s previous rate hike campaign, it had to move short-term rates up 400+ basis points before the yield curve became inverted. However, this time around the Fed will only have to increase the Fed Funds Rate half that amount before the yield curve will become inverted. And it may take even less than that, as the economy is already experiencing anemic growth and disinflation — which will put downward pressure on long-term rates. In addition, interest rates on foreign sovereign debt are well below those in the United States, which will push domestic rates down even further.
Therefore, this time around the yield curve will invert at a much lower level than at any other time in history. What’s more, the Fed has historically raised rates in order to combat a rising rate of inflation, a weakening U.S. dollar and rapid GDP growth. Now, it will be raising rates in the midst of low inflation, a soaring Greenback and anemic economic growth. And, the Fed won’t have to make many rate hikes before the yield curve inverts.
So Why Will The Fed Raise Rates?
The Fed has drawn a Maginot line with its use of the unemployment rate as the main indication of when to raise rates. The Fed is relying on an indicator for when to raise rates that is painting an inaccurate picture of growth and inflation. The U-3 unemployment rate, which is now sitting at 5.5%, isn’t taking into account the unusual amount of part-time and discouraged workers. That U-6 unemployment rate, which includes those partially and fully separated from the workforce, is currently 11%. That figure is two full percentage points higher than where it was the last time the U-3 rate was at this level, which was during the epicenter of the financial crisis.
But the Fed’s Keynesian illogic dictates that a low unemployment rate is the very cause of all that is inflationary, despite alternative measures of labor slack. Therefore, in Pavlovian fashion, it will feel compelled to start raising rates in the next few months.
Most importantly, it will be raising short-term rates when the long end of the yield curve has been artificially manipulated to a record low level. Our hapless central bank may be venturing down the short and dangerous path to an inverted yield curve. But at the same time, economic growth and inflation are decelerating.
Interest Rate Obsession
Foreign central banks will also soon have to abandon their reckless policies of QE to infinity due to its futile effect on GDP growth. Likewise, since sovereign yields are near zero percent in Japan and Europe, it will take just a few basis points in rate hikes to send the entire developed world into an inverted yield curve situation for the first time in global economic history. This is what lies ahead for global investors as central banks begin to move away from the massive distortion of asset prices for the last 7 years. Unfortunately, in the aftermath of this next deflationary collapse, global governments will embark on an unprecedented economic experiment that will involve the further erosion of free markets as part of their effort to reflate asset prices.
In the movies, when a character is unaware of the ominous warning signs that the director has provided the audience, it usually leads to their imminent demise. Ms. Yellen and company may be unaware how important an inverted yield curve is to the banking system and money supply growth. But investors should not let the ignorance of central banks lead to the demise of their wealth.
 About Michael Pento
Michael Pento produces the weekly podcast “The Mid-week Reality Check”, is the President and Founder of Pento Portfolio Strategies and Author of the book “The Coming Bond Market Collapse.”

Strengths
- The new Apple watch could revive the allure of gold for young consumers. Apple, which called gold “uniquely luxurious” in its advertising, has a history of swaying consumer tastes. U.S., U.K. and Italian demand for wearables made out of gold has been cut in half over the past decade, according to data from the World Gold Council, as shoppers favored white-colored metals such as silver and platinum. Apple’s status as the arbiter of cool means its new $10,000 gold watch and yellow iPhones and MacBooks may entice consumers to buy gold wearables and ornaments again.
- South Africa’s Deputy Mineral Resources Minister Godfrey Oliphant said lessons learned from a record platinum-industry strike last year will help prevent a similar stoppage during gold wage talks in 2015. Pay negotiations between labor unions and gold mining companies are set to begin next month.
- Atico Mining announced it has drilled solid extensions to its El Roble copper gold mine, which comprises a series of massive volcanogenic sulphide pods. The extensions could meaningfully boost mine life at its Colombian property. In addition, the company reported the results for three diamond drill core holes, which included 86.4 m of 5.04 percent copper and 3.71 g/t gold and 116 m of 3.05 percent copper and 2.38 g/t gold.
Weaknesses
- Gold traders are the most bearish in four months on the outlook for a continuation in the dollar’s rise. Bullion slid 4.9 percent in the past nine days and this week reached a three-month low. Further, ANZ Bank cut its second quarter 2015 outlook to $1,100/oz from $1,240/oz while UBS lowered its three-month forecast to $1,170/oz from $1,200/oz.
- Allied Nevada Gold Corp. filed for Chapter 11 bankruptcy on Tuesday after negotiating a reorganization plan that gives holders of $315.5 million in senior unsecured notes 75 percent of the new common stock when it emerges from bankruptcy. Noteholders providing bankruptcy financing are to convert $25 million of that debt into the rest of the new equity.
- The precious metals analysis consultancy Metals Focus revealed that the world’s top ten gold miners had moved into a combined negative cash flow position during the last quarter of 2014. This is after three consecutive quarters where they had recorded positive free cash flow. Perhaps most significant was a 9 percent quarter-over-quarter rise in capital spending, mostly sustaining capital expeditures. The consultancy notes that while in 2010-2013 sustaining capex accounted for less than 50 percent of total capex, in the fourth quarter of last year that figured had risen to around 70 percent. Another factor pointed out by Metals Focus is the high level of net debt within the grouping. Cumulatively it stood at $27.5 billion at the end of 2014 and will take several years to pay off based on earnings before interest and tax. If the gold price remains weak or falls further it could take even longer.
Opportunities
- Kirkland Lake Gold reported financial results above expectations on lower costs. Fiscal year 2015 production guidance was revised upwards to 153,000–157,000 ounces as operational improvements take hold.
- Lake Shore Gold announced results of its annual reserve update which included a 29 percent increase in total reserves to 773,300 ounces. The company said it has numerous opportunities to grow resources through drilling for extensions at the existing operations and for new discoveries. In 2014, exploration drilling to the southwest of Timmins West Mine resulted in an important new discovery within 500 meters of Thunder Creek. The 144 Gap Zone is a large zone covering 350 meters along strike and 350 meters down dip, which remains open for expansion. The company continues to generate net free cash flow, with cash and bullion having increased more than $10 million to approximately $72 million. The company also continues to reduce debt, with three payments remaining in their senior secured credit facility.
- The charts below show that the S&P 500’s returns in the past six years have been the best since 1929 and 1999. In addition, earning momentum is U.S. stocks has reversed and is now in a strong downtrend. Contrasting record gains to record lows, the price to free cash flow multiple of gold miners currently stands at 5.7x, making them historically very cheap. Given the stark contrast, it would be prudent to consider adding gold mining stocks as a means of portfolio diversification.


Threats
- Venezuela’s central bank is in talks with Wall Street banks to create a gold swap that would allow it to monetize some $1.5 billion of the metal held as international reserves. Under the swap, the central bank would provide 1.4 million troy ounces in exchange for cash. After four years, it would have right of first refusal to buy the gold back. Venezuela would have to pay interest on the funds but the central bank would most likely be able to maintain gold as part of its foreign currency reserves. The country faces a cash crunch due to the combination of low oil prices and hefty debt payments, including the maturity of a 1 billion euro bond this month and coupon payments of nearly $700 million in April.
- All eyes are on India’s gold savings plan as it could negatively impact demand for physical gold in the country. With Indian households estimated to own about 20,000 tonnes of gold, even if 5 percent of it were to be unlocked by the new gold deposit scheme, it might reduce the country’s imports by 1,000 tonnes. For 2014, the country imported 769 tonnes of gold.
- According to commodities analysts, the plunge in the gold price following strong U.S. jobs data could be repeated over the coming months. There is speculation that jobs, which were never a big driver of gold, have now become a very big one.
Forex Trading Alert originally sent to subscribers on March 12, 2015, 11:54 AM.
Earlier today, the Commerce Department showed that retail sales fell 0.6% in the previous month, which was the third consecutive monthly decline. Additionally, core retail sales (without automobiles, gasoline and food) were flat following a 0.1% decline in January. Thanks to these disappointing numbers the USD Index declined from a fresh 2015 high, slipping under the barrier of 100. How did this drop affect the euro?
In our opinion the following forex trading positions are justified – summary:
- EUR/USD: none
- GBP/USD: none
- USD/JPY: none
- USD/CAD: short (stop loss order at 1.2876)
- USD/CHF: none
- AUD/USD: none
EUR/USD
(Ed Note: for larger charts click HERE for 5 charts and continue reading)
Quoting our previous Forex Trading Alert:
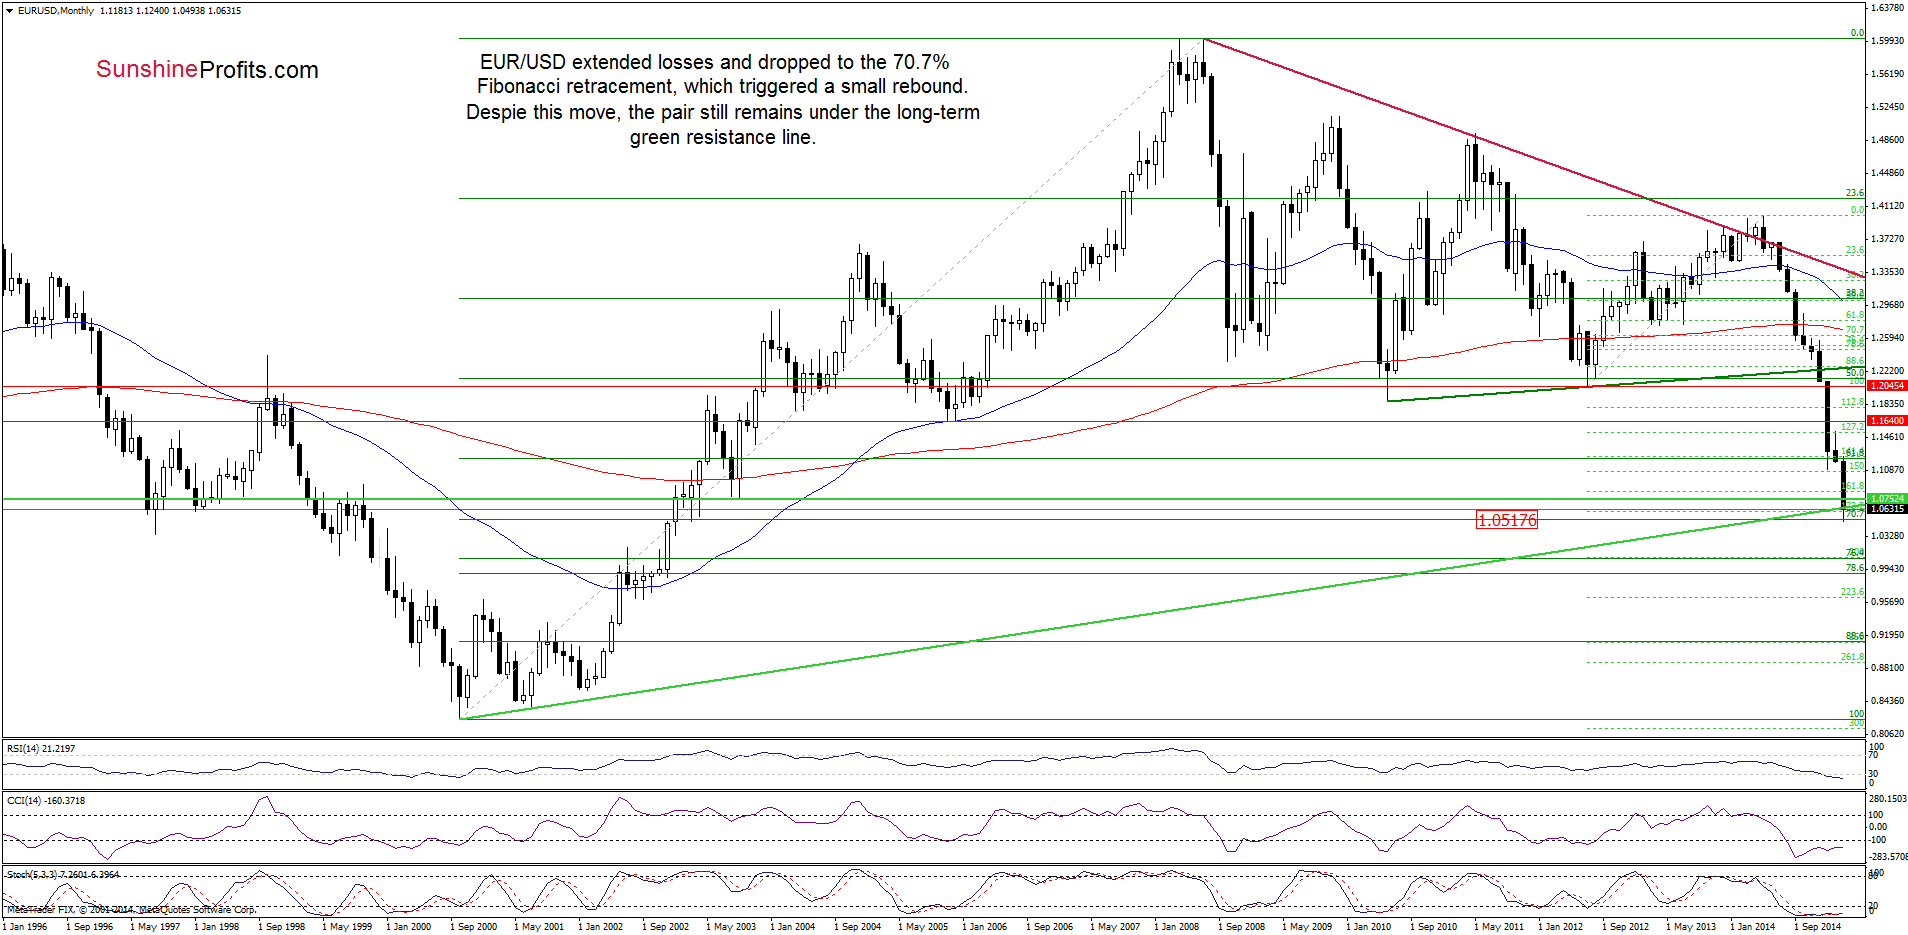
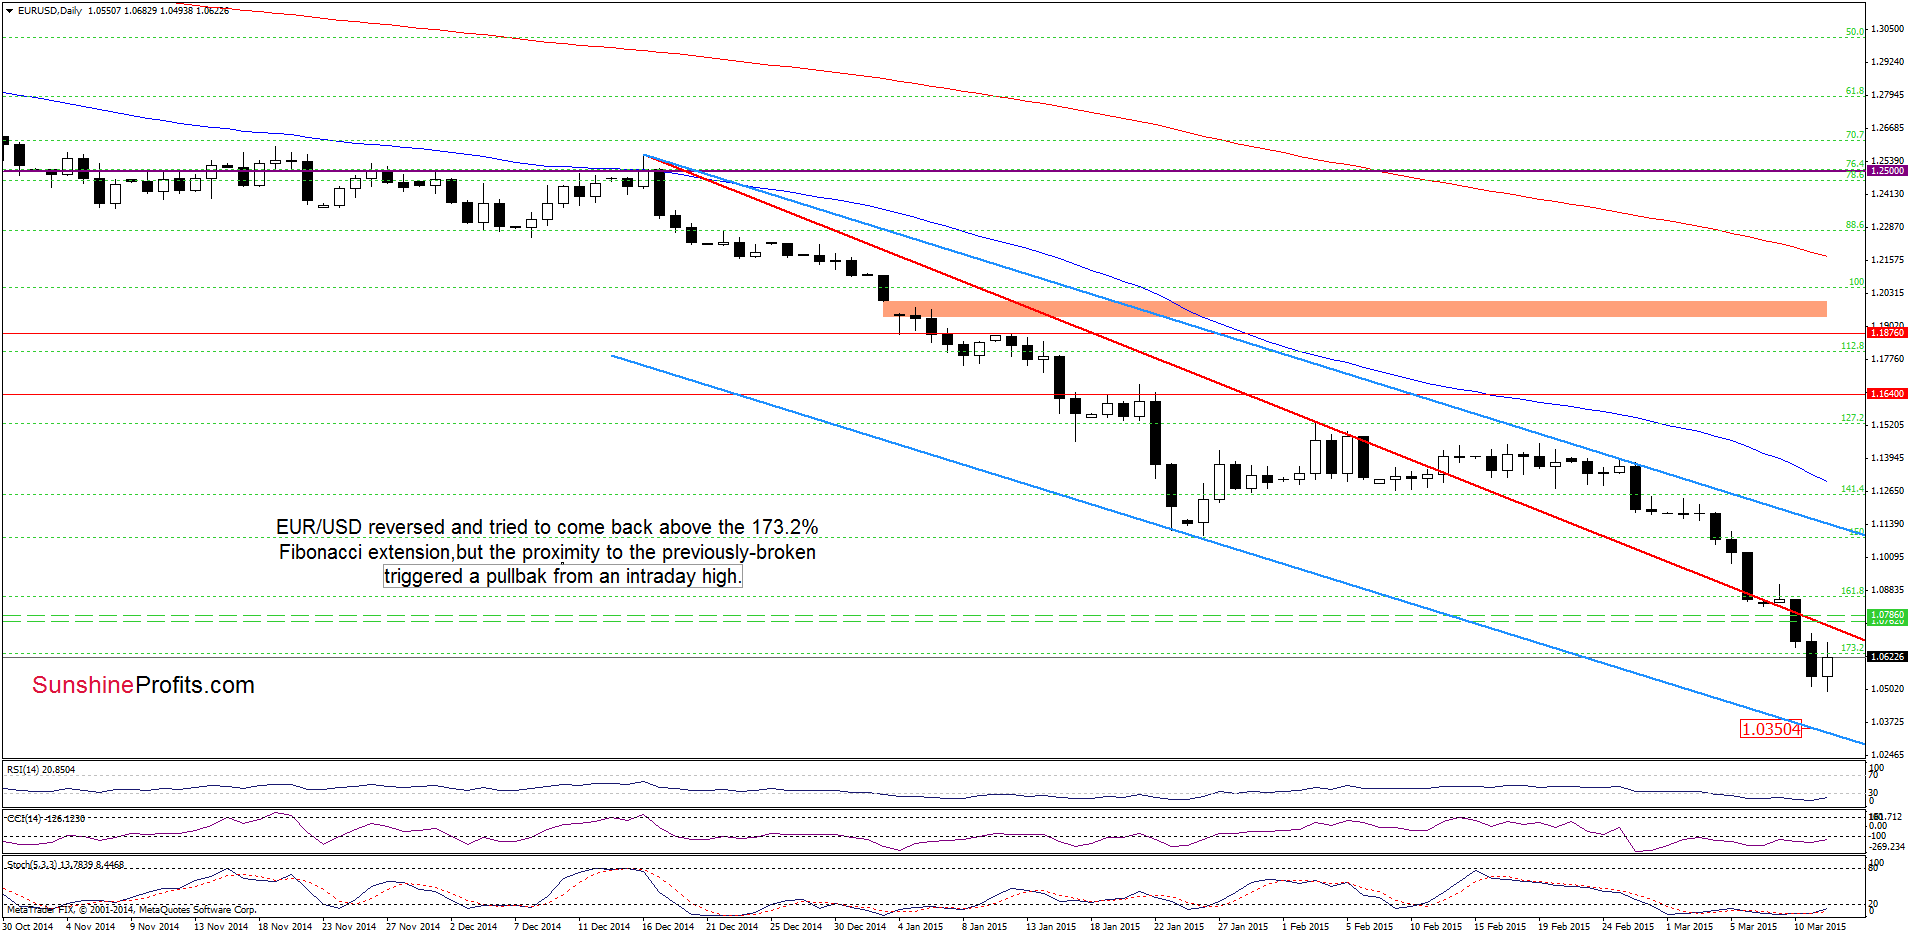
(…) EUR/USD (…) slipped under the long-term green support line (based on the Oct 2000 and Jul 2001 lows). This is a solid negative signal, which suggests further deterioration in the coming day(s). How low could the exchange rate go? (…) the next target for currency bears will be around 1.0517, where the 70.7% Fibonacci retracement is.
Looking at the charts, we see that the situation developed in tune with the above-mentioned scenario and EUR/USD dropped to our downside target earlier today. Despite this deterioration, the exchange rate reversed and rebounded slightly in the following hours, which resulted in an invalidation of the breakdown under the 70.7% Fibonacci retracement. Although this is a positive signal, we should keep in mind that the exchange rate still remains under the previously-broken long-term green and medium-term red resistance lines. In our opinion, as long as there is no comeback above these lines further improvement is questionable and another downswing (and a test of yesterday low) should not surprise us.
Very short-term outlook: mixed
Short-term outlook: mixed
MT outlook: mixed
LT outlook: mixed
Trading position (short-term; our opinion): No positions are justified from the risk/reward perspective at the moment. We will keep you informed should anything change, or should we see a confirmation/invalidation of the above.
(Ed Note: for larger charts and 3 more charts and commentary continue click HERE)


-
I know Mike is a very solid investor and respect his opinions very much. So if he says pay attention to this or that - I will.
~ Dale G.
-
I've started managing my own investments so view Michael's site as a one-stop shop from which to get information and perspectives.
~ Dave E.
-
Michael offers easy reading, honest, common sense information that anyone can use in a practical manner.
~ der_al.
-
A sane voice in a scrambled investment world.
~ Ed R.
Inside Edge Pro Contributors

Greg Weldon

Josef Schachter

Tyler Bollhorn

Ryan Irvine

Paul Beattie

Martin Straith

Patrick Ceresna

Mark Leibovit

James Thorne

Victor Adair