
Gold & Precious Metals
With all the data finally out, the United States gold market suffered a massive deficit over the past three years. How large was this deficit? Actually, large enough to supply all the gold for the U.S. Mint’s production of its Gold Eagles for the past twenty years… a huge amount indeed.
While the U.S. gold market enjoyed some annual surpluses in previous years, the amount of the gold that left the country since 2012 was quite remarkable. In order to calculate a surplus or deficit in the U.S. gold market, we have to include the following data:
Total Supply = Imports + Mine Supply + Recycled Scrap
Total Demand = Exports + Consumption
By inputting this data over the past three years, we have the following chart:

From 2012 to 2014 the U.S. imported 955 metric tons (mt) of gold, had mine production of 677 mt, and recycled 335 of scrap for a total of 1,967 mt of supply. In contrast, total demand was significantly higher including 1,883 mt of gold exports and 530 mt of consumption for a grand total of 2,413 mt.
Here is the breakdown of the annual U.S. gold market deficits:
2012 = 139 mt
2013 = 228 mt
2014 = 79 mt
Total = 446 mt
As we can see, the U.S. gold market suffered a huge 446 mt deficit since 2012. The annual gold deficit was the highest in 2013 due to record exports and consumption of 880 mt compared to lower imports, mine supply and scrap of 652 mt.
By converting this 446 mt figure to troy ounces we get a massive 14.3 million ounces (Moz) of gold. As I mentioned in the beginning of the article, this deficit was large enough to supply all the gold for twenty years worth of U.S. Mint Gold Eagle sales. Since 1995, the U.S. Mint produced and sold 14.6 Moz of Gold Eagles. Yeah, I realize it’s a tad bit more than the 14.3 Moz U.S. gold market deficit (2012-2014), but it’s close enough.
So, where did all this gold come from? That’s a good question. Probably some of it came from the U.S. Comex gold inventories which declined from 11.5 Moz in 2012 to 7.8 Moz currently. However, the decline of gold inventories at the Comex was less than 3 Moz, so this wasn’t enough to supplement the 14.3 Moz deficit.
It’s really impossible to know which public or private stocks were drained to fill this huge U.S. gold market deficit, but we can certainly guarantee for sure… it did happen.
I highly doubt the Fed would want to see the price of gold (in U.S. Dollars) falling below $1,100, as some major bank forecasts have stated will occur in the next several years. I would imagine the Fed has a pretty good idea of the amount of gold fleeing the U.S. to countries abroad. If the paper Dollar price of gold were to fall below $1,100, this would be another huge buying opportunity for the EAST.
At some point, the Greatest Financial Ponzi Scheme in history will unravel just like the Bernie Madoff scam. Unfortunately, this will impact the majority of U.S. citizens who have no idea that the Great American Dream will turn into a horrible nightmare.

 As people continue to digest breaking news out of Greece and around the world, the Godfather of newsletter writers, 90-year-old Richard Russell, announced that the “bear market in gold is over!” Russell also covered everything from a desperate Fed ushering in QE4, to global hyperinflation, the California drought and coming Great Depression-style work programs.
….read it all HERE

This is the first day of the FX week for many markets. The US dollar has recouped all of its post-NFP losses against EUR and JPY but still has a ways to go against CAD. The weak NFP report (Actual 126k vs. Forecast 245K) is being dismissed as a weather-influenced blip and nothing to sway the FOMC from their rate hike path.
AUDUSD was the big story in Asia. The RBA left rates unchanged, catching many traders by surprise and AUDUSD soared. The question is whether the RBA is merely delaying the inevitable until the next meeting or will it be a more protracted pause. The BoJ monetary policy meeting has started and is expected to be a non-event for FX. In Europe, traders ignored PMI data from the Eurozone, Germany and the UK.
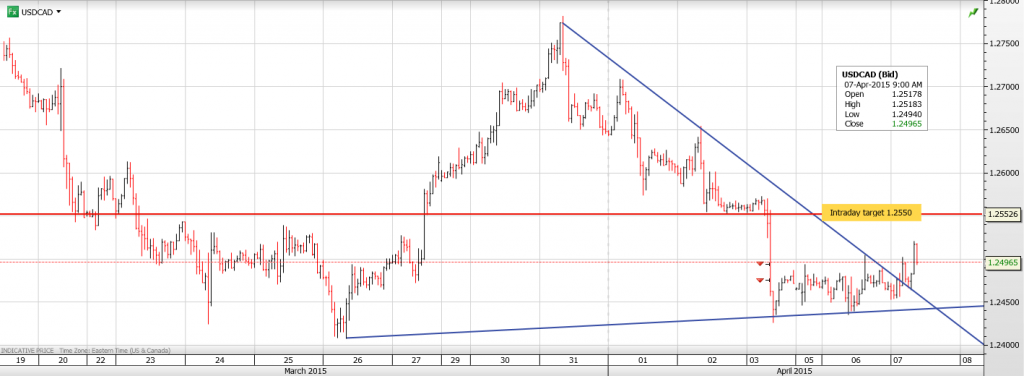
The Canadian dollar traded in a narrow range ignoring chatter of oil price downside risks on Iran/China discussions and yesterday’s BoC Business Outlook survey. That changed in the early NY session will USDCAD buyers testing resistance at 1.2520, which has held. The lack of both US and Canadian data suggests further range trading today.
USDCAD technical outlook
The intraday USDCAD technicals are bullish while trading above 1.2440 with the break above 1.2470 suggesting further gains to 1.2550. A move below 1.2440 will lead to another test of support in the 1.2380-1.2410 area.
The short term 1.2350-1.2820 range since mid-January remains intact.
Today’s Range 1.2450-1.2520
 We’re just days past a tentative nuclear agreement with Iran. And already signs are emerging that projects opportunities that could be coming here.
Such as in the oil and sector. Where Iranian officials said this week they are already eying Western involvement in the domestic sector.
The head of Iran’s committee to review oil contracts, Mehdi Hosseini, announced Sunday that the government will unveil a new array of contracts in the petroleum sector this September. Hosseini added that the government is specifically looking to investment from U.S. and European firms.
As proof, the government said it will hold an international conference in London to unveil the September oil contracts. Demonstrating exactly who the target audience is for this bid round.
This obviously signals a major potential opportunity for E&P players. Iran’s oil and gas fields have proven, high-potential geology, and a lack of modern exploration — with foreign-backed investment in the sector having been limited over past decades to “risk service contracts”, where companies aided in development but were prohibited from owning reserves.
That hang-up — along with recent sanctions — led most big firms to pass by Iran’s fields. But the Iranian government has indicated that could all change this year. Suggesting that petroleum contracts will be reworked to offer attractive terms — including ownership of in-ground oil and gas reserves.
This week’s pro-West announcement from Iran also suggests opportunities could be coming in other resource sectors here. Mining, for example, where Iran holds world-class potential for copper porphyries, lead-zinc deposits and even gold mines. (Just last month, the scholarly journal Ore Geology Reviews dedicated a full volume to new research on Iran’s mineral potential.)
Of course, all of this is contingent on a final deal with the West going through (and holding up). Watch for developments on the political front — if peace looks to be sticking, it may be time to think about adding this nation to our watch list.
Here’s to going un-rogue,
Dave Forest

-
I know Mike is a very solid investor and respect his opinions very much. So if he says pay attention to this or that - I will.
~ Dale G.
-
I've started managing my own investments so view Michael's site as a one-stop shop from which to get information and perspectives.
~ Dave E.
-
Michael offers easy reading, honest, common sense information that anyone can use in a practical manner.
~ der_al.
-
A sane voice in a scrambled investment world.
~ Ed R.
Inside Edge Pro Contributors

Greg Weldon

Josef Schachter

Tyler Bollhorn

Ryan Irvine

Paul Beattie

Martin Straith

Patrick Ceresna

Mark Leibovit

James Thorne

Victor Adair