
Gold & Precious Metals
 An asset class: commodities. Do you think they have bottomed or is it that there would be a long trough for this asset class?
Marc Faber : We have to distinguish because the price of oil has very little to do with the price of orange juice or coffee. So each commodity has its own price dynamics driven by global production and global demand.
Now industrial commodities have performed miserably along with emerging markets over the last couple of years because the demand was slowing down especially from China. So, you have prices of iron ore and steel and copper and oil that have collapsed. I happen to think that at this level a lot of commodities are reasonably priced, does not mean they will go up right away. But they come now into a buying rate and I have been buying some oil stocks recently.


Here are today’s videos and charts (double click to enlarge):
Silver Triangle Action Video Analysis
Gold Volume & MACD Video Analysis
GDX Two Triangles Video Analysis
GDXJ Triangle Breakout Video Analysis
Key Junior Stock Buy Signals Video Analysis
Thanks,
Morris
Friday, Apr 17, 2015 Super Force Signals special offer for Money Talks Readers:
Send an email to trading@superforcesignals.com and I’ll send you 3 of my next Super Force Surge Signals free of charge, as I send them to paid subscribers. Thank you!
The SuperForce Proprietary SURGE index SIGNALS:
25 Surge Index Buy or 25 Surge Index Sell: Solid Power.
50 Surge Index Buy or 50 Surge Index Sell: Stronger Power.
75 Surge Index Buy or 75 Surge Index Sell: Maximum Power.
100 Surge Index Buy or 100 Surge Index Sell: “Over The Top” Power.
Stay alert for our surge signals, sent by email to subscribers, for both the daily charts on Super Force Signals at www.superforcesignals.com and for the 60 minute charts at www.superforce60.com
About Super Force Signals:
Our Surge Index Signals are created thru our proprietary blend of the highest quality technical analysis and many years of successful business building. We are two business owners with excellent synergy. We understand risk and reward. Our subscribers are generally successfully business owners, people like yourself with speculative funds, looking for serious management of your risk and reward in the market.
Frank Johnson: Executive Editor, Macro Risk Manager.
Morris Hubbartt: Chief Market Analyst, Trading Risk Specialist.
website: www.superforcesignals.com
email: trading@superforcesignals.com
email: trading@superforce60.com
SFS Web Services
1170 Bay Street, Suite #143
Toronto, Ontario, M5S 2B4
Canada
###
Apr 17, 2015
Morris Hubbartt

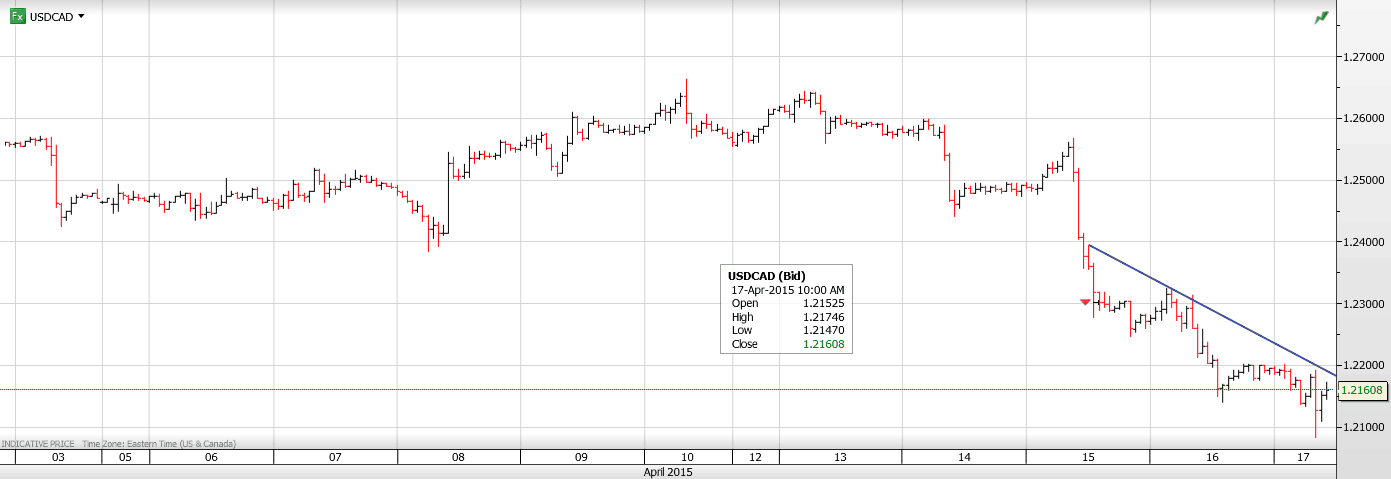
USDCAD Overnight Range 1.2093-1.2200
The Canadian dollar gained 3.5% against its US counterpart and outperformed against the rest of the G-7 currencies thanks to a less dovish Bank of Canada outlook, strong domestic data, higher oil prices and a generally soft US dollar.
Today’s Canadian CPI data (Actual 0.7% vs forecast of 0.5%) combined with a big jump in Retail Sales appears to have validated the slightly rosier outlook in the BoC’s Monetary Policy Report. The news led to additional demand for the Canadian dollar which managed to touch 1.2092 but has since bounced on the back of profit taking and a rise in the Michigan Consumer Confidence Index.
Overnight, the US dollar lost even more ground continuing the trend that started earlier this week when a series of weak economic reports crushed rate hike hopes for June and seriously debased the September call as well.
The Asian session was relatively tame but that wasn’t the case in Europe where the shifting outlook for US rates fueled EURUSD demand. A stronger than expected UK employment report put additional selling pressure on the US dollar and GBPUSD powered above 1.5000.
The outlook for the balance of the day will be one of consolidation. The US dollar should recoup some lost ground against the majors on profit taking ahead of the weekend.
USDCAD technical outlook
The intraday USDCAD technicals are bearish while trading below 1.2210.A break of minor support at 1.2140 and 1.2090 will extend losses to 1.2050. (61.8% Fibo of 2015 range). A move above 1.2210 will lead to a test of 1.2250. The 38.2% Fibo retracement of the July 14-March/15 range comes in at 1.1980.
Today’s Range 1.2140-1.2210
 As people continue to digest breaking news out of Greece and around the world, the Godfather of newsletter writers, 90-year-old Richard Russell, warned that we will see skyrocketing prices for gold and silver as the global crisis accelerates. He also discusses Silver Scarcity.
Richard Russell: “I note that many advisors are warning of massive movements in the stock and bond markets ahead. Some are warning of a crash in the US dollar. The rising dollar has hurt US exports.
The Truth, QE4 And Silver Scarcity
My suspicions are that the government and the Fed have praised the US economy beyond reality. In due time, the truth will come out. The US economy is sadly lagging and a few observers have even suggested that the US economy is in recession. If this turns out to be true, the dollar will crash and the Fed may even turn to QE 4. It’s a dramatic situation unlike anything I’ve ever seen. Physical silver will be scarce in the coming months and is now priced below the cost of production…...continue reading a viewing charts HERE

 I can’t even count the number of analysts who believe Europe’s financial crisis is over.
They claim that the massive 25 percent-plus decline in the euro is starting to stoke inflation … that economic indicators are starting to turn positive … that the recent record highs in Germany’s DAX are proof positive the crisis is over … and more.
But based on all of my research and trading models, nothing could be further from the truth.
 First, the annual inflation rate in the euro zone was -0.1 percent in March. While a tad better than February, one month’s numbers don’t make a trend, and as far as I’m concerned, -0.1 percent is still deflation.
Moreover, that figure is skewed due to the size of Germany’s economy. Actual deflation in most of the euro zone is far worse. Greece is running at -1.9 percent, and France is seeing prices fall at an annual average of -0.3 percent.
Prices in Spain are falling at a -0.7 percent rate, Cyprus at -1.88 and Poland at -1.6 percent. Hardly the stuff of strong economic growth and normalized inflation.
Second, unemployment remains high at 11.3 percent. Yes, that’s a slight improvement from February, but again, not enough to claim a trend reversal is underway.
And here too, the numbers are skewed due to Germany’s low unemployment of 4.8 percent. Greece is still seeing unemployment at 26 percent, Spain at 23.2 percent, Ireland 9.9 percent, Cyprus 16.3 percent, Croatia at 18.5 percent.
Youth unemployment, meanwhile, is still off the charts. 4.85 million Europeans under the age of 25 are unemployed, an amazing 21.1 percent. Again, it understates the problem. Greece has 51.2 percent youth unemployment, Spain, 50.7 percent, and Italy, an amazing 42.6 percent.
Third, severe austerity measures continue to this day and they are hollowing out Europe’s economic growth. The proof is in the numbers. Before the Greek crisis flared up,debt-to-GDP in Greece stood at 113 percent. Today — according to the most recent data and even after all the write-offs — Greece’s debt-to-GDP stands at a whopping 174 percent.
In Spain, pre-crisis debt stood at 40 percent of GDP. Today it’s 97.7 percent.
In Italy, debt-to-GDP is hovering near 132 percent while France is running at 92.2 percent … Ireland, 123.3 percent … Greece, 174.90 percent.
Clearly, all the austerity measures that Europe has implemented have done nothing to reduce debt levels. Instead, they are further hurting the people of Europe, causing economic growth to crater even more.
In short, there is ZERO evidence Europe’s economy is improving. And anyone who takes an uptick in one or even two or three months’ worth of economic numbers to make such claims is a fool. And unfortunately, there are a lot of them out there.
It’s kind of like saying gold has bottomed just because it rallied five or 10 dollars.
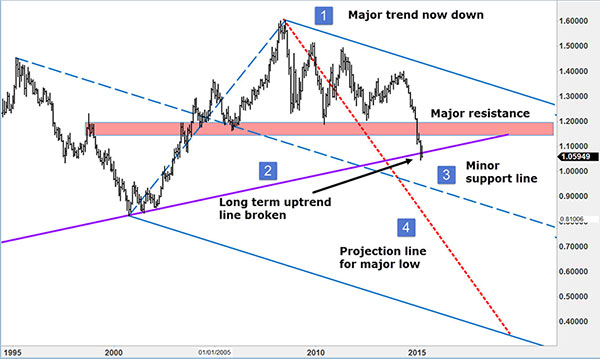
Most importantly, the long-term chart of the euro currency couldn’t be more bearish. Follow along with me by referring to the numbers on the chart below.
1) As you can clearly see, the major trend for the euro is now down. Solidly down. Virtually any rally in the euro is a counter trend move that should be sold.
2) As you can clearly see from this long-term uptrend line, it’s recently been broken. Another confirmation the long-term trend has changed to the downside.
3) Minor cyclical support is declining, a bearish sign too. That support currently stands at the 0.94800 level, well below the market, and declines all the way down to the 0.74 percent level by 2020, when I expect the final bottom in the euro, which will signal the collapse and breakup of the European Union.
4) This is what I call a projection line, a type of line I developed many moons ago that aids in determining where major lows can form (or conversely, highs in a bull market).
It acts as a kind of magnet for price moves, and it’s a leading technical indicator in the sense that it melds both time and price.
As you can clearly see, the slope of this projection line is seriously negative, a sign of just how bearish the euro is.
Moreover, it points to as low as 0.36 for the euro by the next major cyclical target for the euro currency in 2019/2020.
I don’t think the currency will go that low, since there will be complete chaos in Europe once the currency falls back to its 2001 low of roughly 0.82.
But as noted above, I have no doubt the euro will plunge to at least the 0.74 level, by 2020 at the latest, and probably much sooner than that.
Bottom line: Based on the long-term chart of the euro, there is virtually no way Europe is recovering, not in any way, shape or form.
So don’t buy into all the analysts who take an uptick or two in economic stats and say otherwise.
Instead, the smart thing to do is …
A. Recognize the long-term trend, the European Union is decaying and the grand experiment of a single currency and a United States of Europe is failing.
B. Steer clear of European sovereign debt. Period. It’s a disaster in the making.
C. If you’re a speculator, sell short the euro on rallies, either in the forex markets, in futures, or by purchasing an inverse ETF, such as ProShares UltraShort Euro, symbol EUO.
D. If your business is vulnerable to a decline in the euro, consider hedging your exposure via similar methods.
E. If you’re looking to invest in Europe, either its stock markets or via buying a business or real estate — I say be patient. You’ll be able to buy those assets 40 percent cheaper than they currently are, if not cheaper, a few years from now.
In the meantime, there are better things to do with your money.
Best wishes, as always …
Larry

-
I know Mike is a very solid investor and respect his opinions very much. So if he says pay attention to this or that - I will.
~ Dale G.
-
I've started managing my own investments so view Michael's site as a one-stop shop from which to get information and perspectives.
~ Dave E.
-
Michael offers easy reading, honest, common sense information that anyone can use in a practical manner.
~ der_al.
-
A sane voice in a scrambled investment world.
~ Ed R.
Inside Edge Pro Contributors

Greg Weldon

Josef Schachter

Tyler Bollhorn

Ryan Irvine

Paul Beattie

Martin Straith

Patrick Ceresna

Mark Leibovit

James Thorne

Victor Adair