
Asset protection
 90-year-old Richard Russell, warned that China and the super wealthy are preparing for something big but silver will surprise everyone.
Richard Russell: “Negative news is coming out about the US economy. The result will be the Fed will put off raising rates to as far as the eye can see. If the economy continues to deteriorate, we might even see QE4 as the Fed struggles to offset a declining US economy. My advice continues to be: buy and accumulate physical silver and gold.
…..read more HERE

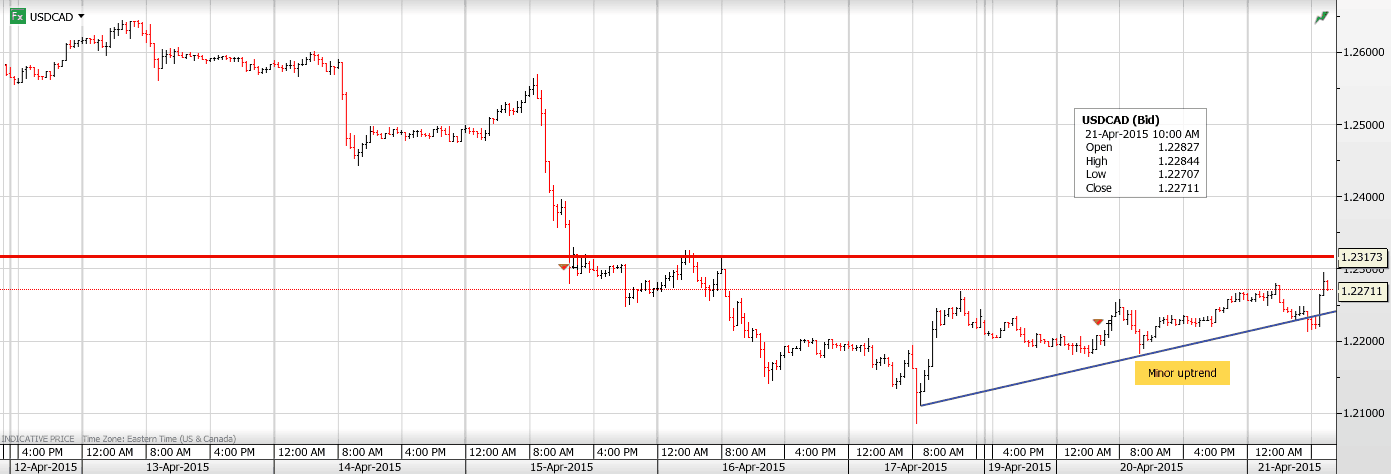
USDCAD Overnight Range 1.2218-1.2294
The US dollar has caught a bit of a bid in NY after being mostly offered overnight.EURUSD has dropped from 1.0710 to 1.0660 while USDJPY popped up from 119.25 to 119.75. There hasn’t been any real catalyst for the moves and USDCAD has been rising in sympathy with the US dollar gains. Today’s weak Wholesale Prices data didn’t help, but that data series is usually ignored anyway.
In Asia, USDCAD climbed steadily, continuing the NYC afternoon trend on the back of both profit-taking and AUDUSD weakness. That move reversed itself when Europe came in.AUDUSD was sold on verbal intervention by the RBA governor, yesterday, in NYC, and by doveish RBA minutes that led to a May rate cut conclusion.Further debate ensued and in Europe, AUDUSD recovered all of its losses, post RBA minutes. News that the ECB was studying ways to reduce Emergency Liquidity Assistance (ELA) to Greek banks sent EURUSD tumbling.
USDCAD is in consolidative mode. For the moment, the pause in the oil price rally and general US dollar strength has offset bearish USDCAD technicals and a new and more neutral BoC. However, the move below the 1.2340-60 area was significant and likely to cap any USDCAD rallies.
USDCAD technical outlook
The intraday USDCAD technicals are modestly bullish while trading above 1.2230 looking for a break above 1.2280 to extend gains to 1.2310 and then 1.2330. A move below 1.2230, targets 1.2210 and 1.2160. The longer term technicals are bearish while trading below 1.2340 looking for a retest of 1.2050.
Today’s Range 1.2240-1.2310

With the last remaining company finally releasing their year-end results, my top primary silver miners lost a combined $1.9 billion in net income in 2014. Two-thirds of the group reported significant write-downs (impairments), while the two of the largest companies suffered the highest losses.
Even though the group experienced record net losses, seven of the twelve actually enjoyed positive adjusted income. Let me explain. Companies report net income and adjusted income. Net income includes various items such as impairments, losses (or gains) on derivatives, hedges, investments or financial exchange losses (gains), and etc.
While these financial items are apart of their profit and loss statement, I like to focus on their adjusted income which removes these items in order to get a better idea of how successful they are at MINING SILVER. As I mentioned before, two of the largest silver producers in the group suffered huge net income losses due to large impairments, but their adjusted income wasn’t as bad.
For example, Coeur stated the largest net income loss of the group at $1.15 billion while Pan American Silver came in second at $545 million in the red. However, the adjusted income for Coeur was -$112 million compared to Pan American Silver at -$20.8 million. Coeur’s large adjusted loss for the year, awarded them with the third highest estimated break-even of the group at $22.38. Which means, Coeur lost an estimated $3.51 for each ounce of silver they sold at an average price of $18.87 in 2014.
Here is the combined financial data for the top 12 primary silver miners in my group:
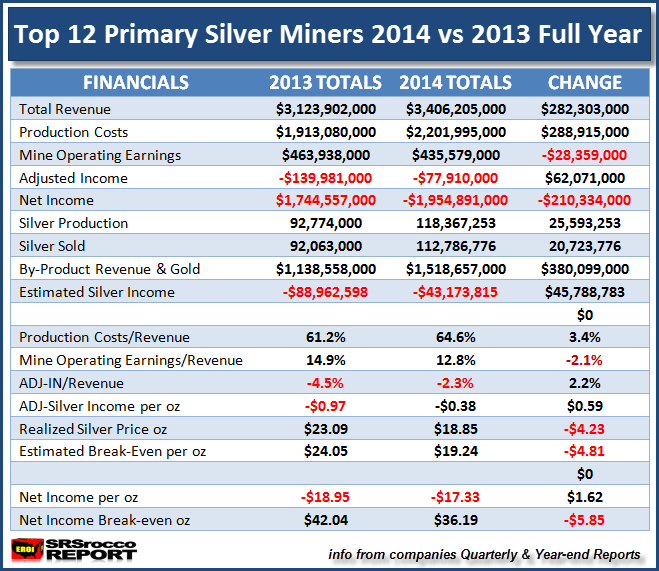
As we can see from the table above, the group sold nearly 21 million oz (Moz) more silver in 2014 than 2013, but their total revenue only increased $282 million from $3.1 billion to $3.4 billion. Basically, the group sold 23% more silver in 2014 and was awarded with a paltry 8% increase in total revenue.
The major reason the group’s total silver production and sales increased so much in 2014 was due to Tahoe Resources Escobal mine reaching full year commercial status. Tahoe’s Escobal mine produced over 20 Moz of silver in 2014, but only sold 18.1 Moz. Tahoe is the lowest cost producer of the group even though Hecla likes to brag it has one of the lowest cash costs. CASH COST accounting is not a GAAP (Generally Accepted Accounting Principle) and I believe is totally useless in determining the overall profitability of a mining company.
You will also notice the group’s total production costs increased $288 million, year over year. This was due to the addition of Tahoe Resources $127 million in production costs along with the group adding a few newly acquired primary gold mines as well as cost increases from higher silver production from the other members.
I would like to point out just how much by-product (and gold) revenue the group reported in 2014:
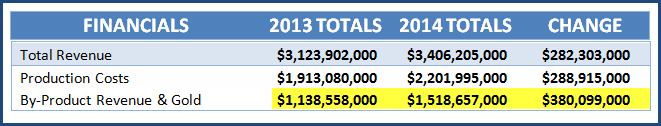
The total group’s by-product and gold metal sales in 2014 were $1.5 billion of the total $3.4 billion in revenue. Thus, the group’s by-product and gold metal sales accounted for 44% of total revenue. That’s a lot of copper, zinc, lead and gold.
CASH COST ACCOUNTING: Needs To Be Thrown Out The Window
I brought this subject up to prove to the precious metal investor that by-product sales are not CREDITS as the industry lists them on their balance sheet when they calculate their cash costs. To arrive at a CASH COST figure, the company deducts their by-product credits from the cost. What a silly and stupid waste of time.
Can you imagine the losses the individual companies and the group would have suffered if they did not include their by-product sales in their balance sheets? We must remember a CREDIT is a FREEBIE. When you go to the store and you have a CREDIT on your account, that’s a freebie. On the other hand, the mining companies need every bit of their by-product revenue to fortify their balance sheets.
Sure, some of the revenue comes from a few primary gold mines, but the majority is a by-product of mining silver. This isn’t a CREDIT, it’s a DAMN necessity… LOL.
If we were to deduct $1.3 billion of the supposed by-product credits from the total revenue, how would that impact their bottom line?? Instead of the group suffering a total adjusted loss of $77 million, it would be a whopping $1.37 billion (add $77 million to $1.3 billion). Now, I used $1.3 billion of by-product revenue instead of the full $1.5 billion shown above because I deducted a conservative $200 million of primary gold sales from their primary gold mines.
Again, for a company to actually list a CREDIT, it wouldn’t need that income or revenue to be profitable. Which means, if by-product metal sales were actually CREDITS, then the company would be profitable without them. As we can see, this is not the case.
I am quite surprised that Jeff Christian’s CPM Group still uses the worthless CASH COST metric in their annual Silver Yearbooks. CPM Group sort of bragged in their 2014 Silver Yearbook that the primary silver miners cash cost fell to $9.68 in 2013 compared to $10.01 in 2012.
Unfortunately, there still seems to be a good percentage of precious metals investors (new and old) who believe it costs $10 to produce silver. There isn’t one company in my group that has an estimated breakeven anywhere near $10. The lowest is Tahoe at $13.70 with most in the $17-22 range.
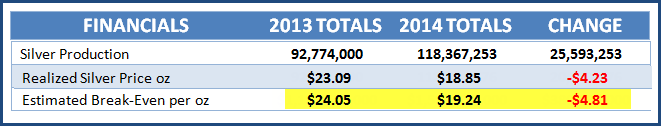
Here is the highlighted estimated breakeven for the group taken from the table above. In 2014, the top 12 primary silver miners lowered their estimated breakeven to $19.24 down from $24.05 in 2013. Even though group was able to lower costs which in turn lowered their estimated breakeven ($4.81 an oz) compared to 2013, the average realized price they received for silver ($4.23 an oz) declined significantly as well.
According to my formula, the group suffered a net loss of $0.39 for every ounce of silver they sold in 2014. How high would the group’s losses be if we didn’t include their by-product metal sales? Let’s be really conservative and subtract $1 billion of by-product metal sales and see how that would impact the loss per ounce:
$1 billion divided by 112.7 Moz of silver sold = -$8.87 an ounce
Without adding the supposed BY-PRODUCT CREDITS of a conservative $1 billion, the group would have lost another $8.87 on each ounce of silver sold. Thus, the breakeven for the group would have jumped to ($19.24 + $8.87) $28.11. If the primary silver mining industry received $18+ an ounce for the silver they produced in 2014, without their by-product revenue, they would be in REAL TROUBLE.
This is exactly how CPM Group gets away with publishing a primary silver mining industry $10 cash cost. By the industry deducting all of its by-product metal sales (credits), it can show a very low CASH COST which has nothing to do with profitability. So why does the industry continue to publish this worthless metric? That’s a good question.
How Much Lower Can The Group’s Breakeven Go?
I would imagine we will continue to see a drop in the group’s breakeven over the next several quarters. Because the price of oil is now half of what it was in 2014, this should finally make its way through the cost structure in the primary silver mining industry. However, I don’t see that much of an overall decline in the group’s breakeven for producing silver.
If the estimated breakeven for the group was $19.24 in 2014, I don’t see it falling too much below $18 this year. I believe the primary silver mining companies have done as much as they can to cut costs and there really isn’t a lot of wiggle room left.
Furthermore, even if the group’s break even was to fall to say $17.50, the average price of silver is now trading at $15.90. Thus, the primary silver miners as a group would still be losing money. This is quite a shame because these mining companies are the few entities in the world actually producing WEALTH or a STORE OF WEALTH, while the Commercial and Central Banks continue to rob, steal and loot wealth from the public.
PRIMARY SILVER MINERS: Few Bright Spots In The Future
Some readers may interpret my breakeven analysis on the primary silver miners as being bearish or critical. While I like to point out the facts as I see them, I believe the primary silver mining industry will be one of the FEW BRIGHT SPOTS in the future. This will be due to the negative ramifications of the peak and decline of global unconventional oil production on most paper and physical assets. As investors flee increasingly worthless paper assets in the future and into the primary silver miners, their share prices will explode higher.
I will be publishing PAID REPORTS on various aspects of the silver industry and market. One will focus on the top 12 primary silver miners in my group analyzing which companies are the best candidates to consider owning when we finally get the MAD RUSH IN GOLD & SILVER.
Please check back for new articles and updates at the SRSrocco Report. You can also follow us at Twitter
Stuck in a Liquidity Trap?
The Economic Singularity
The Minsky Moment
The Event Horizon
Where Does Growth Come From?
Economic Distortions and Unintended Consequences
San Diego, Raleigh, Atlanta, and New York
I can sense a growing unease as I talk with investors and other friends, from professional market watchers and traders to casual observers. What in the Wide World of Sports is going on? It is not just that markets are behaving in an unusual and volatile manner (see chart below showing multiple double-digit moves in the last few months); it’s that the data seems to be so conflicting. One day we get data that shows the economies of the developed world to be slowing, and the next day we get positive numbers. The ship of the economy seems to be drifting rudderless.

My dad used to say about a situation that just didn’t seem quite right that things were “about a half a bubble off dead center.” (This was back in the days when we used bubble levels to determine whether something was level or plumb – before today’s fancy digital gadgets.)
There is a reason, I think, that everything seems just a little out of kilter. I believe that central banks, in their valiant, unceasing efforts to restore liquidity and growth, have unleashed numerous unintended consequences that are beginning to show up in earnest. Today we are going to review the well-meaning behavior of central banks for clues about our near future.
Stuck in a Liquidity Trap?
A few years ago, Jonathan Tepper and I wrote a book called Endgame, in which we talked about liquidity traps developing at the end of debt supercycles. And we certainly did have a liquidity trap, all over the world. The major central banks came up with rather radical policies to deal with it, and those were necessary at the time. But then, like the proverbial Energizer Bunny, they just kept going and going and going.
Central banks have proven that they can make money cheap and plentiful, but the money they’ve created isn’t moving around the economy or stimulating demand. It’s like a car. Our central banker can put the pedal to the metal and flood the engine with gas; but because the transmission is busted, it’s hard to shift gears, and power isn’t delivered to the wheels. Without a transmission mechanism, monetary policy is ineffective. Study after study has shown that quantitative easing didn’t produce the “bang for the buck” that central bankers hoped it would. After a credit crisis like last decade’s, central bankers can cut the nominal interest rate all the way to zero and still not be able to get their economies in gear. Some economists call that a “liquidity trap” (although that usage of the term differs somewhat from Lord Keynes’s original meaning).
The Great Recession plunged us into a liquidity trap the likes of which the world hadn’t seen since the Great Depression, although Japan has been more or less mired in a liquidity trap since their bubble burst in 1989.
Economists who study liquidity traps know that some of the usual rules of economics don’t apply when an economy is stuck in one. Large budget deficits don’t drive up interest rates; printing money isn’t inflationary; and cutting government spending has an exaggerated impact on the economy.
In fact, if you look at recessions that followed on the heels of debt crises, growth was almost always very slow. For example, a study by Oscar Jorda, Moritz Schularick, and Alan Taylor found that recessions that occurred after years of rapid credit growth were almost always worse than garden-variety recessions. One of the key findings of their study is that it is very difficult to restore growth after a debt bubble.
Yet Paul Krugman took a victory lap this week on behalf of the reigning economic paradigm and its role in the US recovery. While he was at it, he chided Europe for not pursuing the same policies:
It’s true that few economists predicted the crisis. The clean little secret of economics since then, however, is that basic textbook models, reflecting an approach to recessions and recoveries that would have seemed familiar to students half a century ago, have performed very well. The trouble is that policy makers in Europe decided to reject those basic models in favor of alternative approaches that were innovative, exciting and completely wrong.
Actually the difference in the performance of the US and European economies was almost all attributable to our shale oil revolution. Without it, US growth would have been closer to 1% than our recent anemic 2% average (and likely to be 1% for the recent quarter).
Was it really central bank policy that made the difference? Let’s examine.
Central banks in the US, Europe, and Japan want to create modest inflation and thereby reduce the real value of debt, but they’re having trouble doing it. Creating inflation isn’t quite as simple as printing money or keeping interest rates very low. Most Western central banks have built up a very large store of credibility over the past few decades. The high inflation of the 1970s is a very distant memory to most investors nowadays, and almost no one seriously believes in hyperinflation. The UK has never experienced hyperinflation, and you’d have to go back to the 1770s to find hyperinflation in the US – when the Continental Congress printed a boatload of money to pay for the Revolutionary War. (That’s why the framers of the Constitution introduced Article 1, Section 10: “No state shall… coin money; emit bills of credit; make any thing but gold and silver coin a tender in payment of debts….”) Japan and Germany ha ve not had hyperinflation for over 60 years.
Today’s central bankers want what they consider mild inflation (~2%) but only in the short run. (They would probably tolerate 3 to 4% before they leaned heavily against it in today’s economic environment.)
As Janet Yellen has recognized, central banks with established reputations have a credibility problem when it comes to committing to future inflation. If people believe deep down that central banks will try to kill inflation if it ever gets out of hand, then it becomes very hard for those central banks to generate inflation. And the answer to that problem from many economists is that central bankers should be even bolder and crazier – sort of like everyone’s mad uncle – or, to put it more politely, they should be “responsibly irresponsible,” as Paul McCulley has quipped. And yet there is a growing chorus of serious economists beginning to suggest that keeping rates at 0% for six years is just about irresponsible enough.
In a liquidity trap, the rules of economics change. Things that worked in the past don’t work in the present. Central bankers’ economic models, iffy in the best of times, become even less reliable. In fact they sometimes suggest actions that are quite destructive. So why aren’t the models working?
Sometimes the best way to understand a complex subject is to draw an analogy. So with an apology to all the true mathematicians among our readers, I want to revisit what I call the Economic Singularity. I must confess that when I coined the term in 2012 I had no idea how accurate the description would become in the past few quarters.
The Economic Singularity
Singularity was originally a mathematical term for a point at which an equation has no solution. In physics, it was proven that a large enough collapsing star would eventually become a black hole so dense that its own gravity would cause a singularity in the fabric of space-time, a point at which many standard physics equations suddenly have no solution.
Beyond the “event horizon” of the black hole, the models no longer work. In general relativity, an event horizon is the boundary in space-time beyond which events cannot affect an outside observer. In a black hole it is “the point of no return,” i.e., the point at which the gravitational pull becomes so great that nothing can escape.
This theme is an old friend to readers of science fiction. Everyone knows that you can’t get too close to a black hole or you will get sucked in; but if you can get just close enough, you can use the powerful and deadly gravity to slingshot you across the vast reaches of space-time.
One way that a black hole can (theoretically) be created is for a star to collapse in upon itself. The larger the mass of the star, the greater the gravity of the black hole and the more surrounding space-stuff that will get sucked down its gravity well. The center of our galaxy is thought to be a black hole with the mass of 4.3 million suns.
We can draw a rough parallel between a black hole and our current global economic situation. (For physicists this will be a very rough parallel indeed, but work with me, please.) An economic bubble of any type, but especially a debt bubble, can be thought of as an emergent black hole. When the bubble gets too big and then collapses in upon itself, it creates its own black hole with an event horizon beyond which all traditional economic modeling breaks down. Any economic theory that does not attempt to transcend the event horizon associated with excessive debt will be incapable of offering a viable solution to an economic crisis. Even worse, it is likely that any proposed solution will make the crisis more severe.
We are fast reaching the point where markets are crossing the event horizon, where mathematical investment analysis no longer makes sense. We read that some 25% of bonds in Europe now offer negative interest rates. How do your value equations work in an environment of negative yields? It becomes mathematically impossible for pensions and insurance companies to meet their goals, given their investment mandates, in a world of negative interest rates. While economists may applaud negative rates, those who will need their annuities and pensions are probably not yet aware that their futures have been mortgaged for a set of narrow economic goals, which look as though they are not being fulfilled at any rate. When the bill comes due in 10 years, those in charge today will have moved on to other more lucrative opportunities, and pensioners will realize how screwed they have been.
German bonds have negative yields out to the eight-year mark, as yields have steadily dropped for the last three years:

Switzerland is now issuing 10-year bonds at negative rates. Has lending returned to Europe? If you squint real hard, you might be able to detect an uptick in the next chart.

However, when you take a closer look, you find that the recent uptick is almost all in finance (in just two financial corporations, to be specific) and not in the household and business sectors, which are seeing credit lines being close to them. (Hat tip Alhambra Partners.)
I believe the world will soon find out that by holding interest rates down and allowing sovereign debts to accumulate past the point of rational expectation for being paid, in one country in Europe after another (Greece is just the first), central banks have pushed us past the event horizon, believing they have supernatural powers that will let the global economy escape the debt black hole that has been created by and for governments.
The Minsky Moment
Debt (leverage) can be a very good thing when used properly. For instance, if debt is used to purchase an income-producing asset, whether a new machine tool for a factory or a bridge to increase commerce, then debt can be net-productive.
Hyman Minsky, one of the greatest economists of the last century, saw debt in three forms: hedge, speculative, and Ponzi. Roughly speaking, to Minsky, hedge financing occurred when the profits from purchased assets were used to pay back the loan; speculative finance occurred when profits from the asset simply maintained the debt service and the loan had to be rolled over; and Ponzi finance required the selling of the asset at an ever higher price in order to make a profit.
Minsky maintained that if hedge financing dominated, then the economy might well be an equilibrium-seeking, well-contained system. On the other hand, the greater the weight of speculative and Ponzi finance, the greater the likelihood that the economy would be what he called a deviation-amplifying system. Minsky’s Financial Instability Hypothesis suggests that over periods of prolonged prosperity, capitalist economies tend to move from a financial structure dominated by (stable) hedge finance to a structure that increasingly emphasizes (unstable) speculative and Ponzi finance.
Minsky proposed theories linking financial market fragility in the normal life cycle of an economy with speculative investment bubbles that are seemingly an inescapable part of financial markets. He claimed that in prosperous times, when corporate cash flow rises beyond what is needed to pay off debt, a speculative euphoria develops; and soon thereafter debts exceed what borrowers can pay off from their incoming revenues, which in turn produces a financial crisis. As the climax of such a speculative borrowing bubble nears, banks and other lenders tighten credit availability, even to companies that can afford loans, and the economy then contracts.
“A fundamental characteristic of our economy,” Minsky wrote in 1974, “is that the financial system swings between robustness and fragility and these swings are an integral part of the process that generates business cycles.”
In Endgame I explored the idea of a debt supercycle, the culmination of decades of borrowing that finally ends in a dramatic bust. At the time I wrote the book, I felt that much of the developed world was at the end of the 60-year-long debt supercycle and approaching the event horizon of a global economic singularity.
The Event Horizon
A business-cycle recession is a fundamentally different thing than the end of a debt supercycle, such as much of Europe is tangling with, Japan will soon face, and the US can only avoid with concerted action in the next few years. A business-cycle recession can respond to monetary and fiscal policy in a more or less normal fashion; but if you are at the event horizon of a collapsing debt black hole, monetary and fiscal policy will no longer work the way they have in the past or in a manner that the models would predict, which is precisely what we’re seeing today.
There are two contradictory forces battling in a debt black hole: expanding debt and collapsing growth. Raising taxes or cutting spending to reduce debt will have an almost immediate impact on economic growth.
But there is a limit to how much money a government can borrow. Although that limit can vary significantly from country to country, to suggest there is no limit puts you squarely in the camp of the delusional.In our analogy, the event horizon is relatively easy to pinpoint. It is what Rogoff and Reinhart call the “Bang!” moment, when a country loses the confidence of the bond market. For Russia it came at 57% of debt-to-GDP in 1998. Japan is at 250% of debt-to-GDP and rising, even as its population falls – the “Bang!” moment has arrived, and Japan is now monetizing debt at a rate that is unprecedented for a developed country in modern history. Obviously, Greece had its first such moment several years ago and is now getting ready to experience another such painful moment. Spain lost effective access to the bond market a few years ago and survived only because of European Central Bank intervention, as did Italy. If there is further contagio n from Greece, will these and other southern- and eastern-tier European countries go Bang?
As an aside, it makes no difference how the debt was accumulated. The black holes of debt in Greece and in Argentina had completely different origins from those of Spain or Sweden or Canada (the last two in the early ’90s). The Spanish problem did not originate because of too much government spending; it developed because of a housing bubble of epic proportions. Seventeen percent of the working population in Spain was employed in the housing industry when it collapsed. Is it any wonder that unemployment is now 25%? If unemployment is 25%, that both raises the cost of government services and reduces revenues by proportionate amounts.
The problem of too much debt is not new. Rogoff and Reinhart’s epic research highlights 266 crises over the last few hundred years; and if they were writing their book today, they would be able add a few new ones. I believe there will be even more such events within the next five to ten years.
The policy problem is daunting: how do you counteract the negative pull of a black hole of debt before it’s too late? How do you muster the “escape velocity” to get back to a growing economy and a falling deficit – or, dare we say, even to a surplus that lets you pay down the old debt? How do you defuse the mutually amplifying forces of insufficient growth and too much debt?
The problem is not merely one of insufficient spending; the key problem is insufficient income. By definition, income has to come before spending. You can take money from one source and give it to another, but that is not organic growth. We typically think of organic growth as only having to do with individual companies, but I like to think the concept also applies to countries. The organic growth of a country can come from natural circumstances like ample energy resources or an equable climate or land conducive to agricultural production, or it can come from developing an educated populace. There are many sources of potential organic growth: energy, tourism, technology, manufacturing, agriculture, trade, banking, etc.
While deficit spending can help bridge a national economy through a recession, normal business growth must eventually take over if the country is to prosper. Keynesian theory prescribed deficit spending during times of business recessions, offset by the accumulation of surpluses during good times, in order to be able to pay down debts that would inevitably accrue down the road. The problem is that the model developed by Keynesian theory begins to break down as we near the event horizon of a black hole of debt.
Deficit spending is a wonderful prescription for Spain, but it begs the question of who will pay off the deficit once Spain has lost the confidence of the bond market. Is it the responsibility of the rest of Europe to pay for Spain or Greece? Or Italy or France, or whatever country chooses not to deal with its own internal issues?
Deficit spending can be a useful tool in countries with a central bank and an independent currency, such as the US. But at what point does borrowing from the future (that is, from our children) become a failure to deal with our own lack of political will in regards to our spending and taxation policies? There is a difference, as I think Hyman Minsky would point out, between borrowing money for infrastructure spending that will benefit our children and borrowing money to spend on ourselves today, with no future benefit. And for countries without a central bank, that are already trapped in a debt black hole, adding more debt just worsens the problem. Ask Greece.
Where Does Growth Come From?
While it may seem odd to shift directly from a discussion of debt to one about growth, the above question is actually at the heart of the matter. Paul Krugman and I would readily agree that growth of the type we experienced in the ’80s and ’90s is the best cure for too much debt. Nominal GDP growth at 6 to 7% with deficits rising no more than 2 to 3% (or even a surplus!) can quickly reduce a country’s debt burden. Growth not only eases the debt burden, it produces jobs and a better standard of living for everyone. Growth is the equivalent of an economic magic elixir.
What causes growth? As noted above, Krugman wrote:
The clean little secret of economics since then, however, is that basic textbook models, reflecting an approach to recessions and recoveries that would have seemed familiar to students half a century ago, have performed very well.
The problem is that the models tend to confuse correlation with causation. The “textbook models” note that growth appears when rates are low and money is easier to find. Thus, when a central bank lowers its rates, it expects to see higher growth. It also wants to see an increase in jobs, and that is in fact what seems to happen.
I would not dispute that lower rates can for a time be a stimulus. But lower rate certainly weren’t much of a stimulus in Japan and have not been all that successful in Europe over the last few years. There is something going on that a simple easy-money policy cannot address.
What happens after a recession is that companies adjust their business models. Initially this may mean cutting costs by reducing jobs and lowering overhead. Eventually, businesses start to be profitable again. Most companies try to take some of that profit and increase their business. It is the natural state of things that free entrepreneurs will figure out how to grow their businesses. The individual actions of almost 7 million businesses and 22 million self-employed workers trying to improve their lot in life create growth in the aggregate.
There is a fabulous infographic at Business Insider, detailing the statistics on the state of US small businesses. It’s way too long to reproduce here, but those who are interested can click on the link.
A few facts:
- 50% of the working population of the US works in small business.
- There are over 22 million self-employed workers, and the remaining almost 7 million businesses have almost 100 million employees.
- Small businesses have generated over 65% of the net new jobs since 1995.
- An astounding 543,000 businesses get started each month; and, for decades, more businesses would open than close. That has changed, and we are now closing more businesses than we are opening new ones. We have shut down the engine for the source of new jobs.
- Starting a new business is very risky. Only 7 out of 10 new employer firms survived at least 2 years, half last at least 5 years, a third make it for 10 years, and only a quarter stay in business 15 years or more. These are actually better odds than when I was researching and writing about the topic in the ’80s. Perhaps that is because 52% of all small businesses are now home-based, with lower overhead and clearly different business models than were prevalent 30 years ago.
- That self-employed market contributes over 6% of GDP.
The growth of an economy after a recession is the result of tens of millions of small and large businesses figuring out how to improve their lot. To credit a central bank and its monetary policy as the primary forces in bringing about prosperity is misguided at best and disingenuous at worst. It is giving credit to the cart for delivering the package rather than to the horse that pulled it.
If we want growth, then we need more small businesses. Elon Musk employs 6000 employees, on his way to 10,000+; but his business started with a few people sitting around a table trying to figure out how to make it happen. Same with Google. Or Amazon. Or any big business.
You don’t get big businesses with large numbers of employees without having an active pool of new businesses being created. The simple fact is that regulations and a complicated tax code have made starting a new business more difficult.
Economic Distortions and Unintended Consequences
The Federal Reserve policy of holding rates too low for too long in the middle of the last decade clearly helped create the environment for the housing bubble and the distortions in the financial markets that were at the root of the Great Recession. The Federal Reserve is once again making the mistake of leaving interest rates too low for too long and bringing about distortions that are creating bubbles all over the world, especially in the emerging markets.
By encouraging a reach for yield in riskier investments because interest rates are abnormally low, the Fed has created an environment in which far more risk is being taken than is normal and healthy. It is as if the central bankers and economists have decided that individuals are not smart enough to do what is in their own best interests and think they need to be encouraged to make riskier investments. The problem is that many of those riskier investments are now being made with funds that should in be lower-risk investments meant to sustain people well into their retirement years.
Most retirement money should be put to work in lower-risk investments meant for the long term. Now that investors have been forced into seeking higher-yielding, higher-risk investments, at the first sign of danger they will be emotionally driven to withdraw their funds at just the wrong time, as they did during the Great Recession. Central bank policy, even if well-meant, has created an environment of risk that monetary policy cannot resolve. We have sown the seeds of the next crisis throughout the economies of the world by distorting markets with low rates and encouraging $9 trillion of dollar-denominated debt to flow into emerging markets.
Further, rather than reforming their labor and regulatory markets and unleashing their entrepreneurs, Japan and now Europe are engaged in what amounts to a currency war waged under the guise of trying to engender inflation.
The central banks of the major developed economies have once again dangerously distorted the real economy. It strains credulity to say that slowly raising rates by as little as 2% would somehow make it impossible for businesses to make money. A business that survives only because of 0% interest rates is a zombie business that is incapable of surviving in a normal economy. Repressing savers and destroying the income of those who have saved for a lifetime seems a very high price to pay to support businesses that would fail in normal times. Thwarting savers greatly reduces the consumption those savers would have been able to contribute to the real economy. And to prop up the very financial institutions that were part and parcel of the last crisis? The income inequality that so many in academic circles decry is actually a studied result of current thinking about monetary policy.
We have once again entered dangerous ground where central banks with their low rate policies have distorted the economy. Yes, the near-zero rate policies of central banks have benefited financial businesses and large corporations that can take advantage of access to low-interest-rate financing, but they have not spurred the development of new businesses. Monetary policy does not create jobs. Businesses create jobs.
In addition, we have put in place onerous new banking regulations that are being thrust upon small banks, taking away their power to lend money to good businesses. We are strangling the real economy with easy-money policies and encouraging financial transactions that look a lot like Ponzi, as opposed to hedge, financing.
The total amount of global debt has risen by 33% in just the last seven years, that is, by a staggering $57 trillion. How much of the $57 trillion was pursued as hedge finance rather than Minsky’s speculative or Ponzi finance? I fear that we are once again facing a Minsky Moment, when our accumulated debt and the continued distortion of the economy by central banks will create another financial crisis.
Is it 2005 all over again, so that we can expect another few years before the piper must be paid? Or is it mid-2007, so that we need to be preparing for another global crisis? In both cases the markets were telling us things were okay, but in 2007 we were beginning to notice signs of increased volatility, and growth seem to be weakening. What do you see when you look around? Does it feel like 2005, or 2007?
To me, the world feels like it’s about half a bubble off dead center.
San Diego, Raleigh, Atlanta, and New York
I am home next week before heading over to San Diego a few days early for the Strategic Investment Conference. If you are around Wednesday afternoon (the 29th), look me up in the gym. Once the conference starts Wednesday night, I will have very little time Thursday and Friday to catch my breath, let alone get into the gym. Maybe Saturday afternoon, if I have any energy left.
The middle of May sees me going to Raleigh for an institutional investment conference before participating in a board meeting for Galectin Therapeutics in Atlanta. In early June I have a trip scheduled to New York and then New Hampshire. I will likely drive from there up to Stowe, Vermont, where my Mauldin Economics partner Olivier Garret has his offices. I’m sure a few other trips will come along in the meantime.
My friends know that I enjoy a great science fiction book. I’ve been reading science fiction for well over 50 years. I’m really not sure how many thousands of books I’ve read in that span of time. Lately, not as many as I would like, as there is so much other material that I feel compelled to read. The really good writers (not just of science fiction) not only grip you tight with a well-told story, they seem to be able to throw in plot twists that open up new horizons for the protagonists and engender wonder and joy in the reader. Most of the time, at least. George R. R. Martin (best known for Game of Thrones) is notorious for plot twists that kill off main characters just as you have come to really feel that you know and like them. It does allow him to take his plot in unexpected directions, though.
Just when I thought I could see how things would progress into my own near future, there has lately been a plot twist or two in my life (fortunately no one has been sacrificed for the enhancement of my personal plot). I choose to see them as opening up new possibilities, and now find myself wondering what other opportunities are out there. Like any good novelist, I will make sure my character moves forward, taking his chances just over the next pass or out beyond the next star. How much more fun can you have than getting to write your own story? It’s been a pretty good one so far. Let’s see if this writer can keep it up.
Right now, though, I have to focus on finishing the final edits on a new book and putting the details into my speech for San Diego. New storylines will have to wait a few weeks. I hope you’re having a great week. May all your plot twists be good ones.
Your wondering what genre of fiction I live in analyst,

John Mauldin
subscribers@MauldinEconomics.com

Let me take one final opportunity to invite you to come to the 2015 Strategic Investment Conference. We’ve assembled an amazing cast of speakers who will delve deeply into what is really driving the world’s economy. I have some of the finest experts on China from around the world, central bankers, some very powerful analysts whose work commands the attention of the biggest institutions and hedge funds in the world (and whose work costs 20 times or more the price of my conference). Market analysts, geopolitical wizards, and futurists will be on hand, too. This is really the finest gathering of minds I have been pleased to assemble for a Strategic Investment Conference. Click on the link above and peruse the lineup and schedule. The conference starts in a little over a week, on the evening of April 29, and lasts through May 2 at noon. Between those times we will wine and dine you as you feast on powerful ideas, one after another. You will come away with a much better grasp of our near-term future, including when and how the Fed will raise rates, what will happen to China, how Europe will evolve (or devolve), and what the overall geopolitical outlook for the world is. All in one place with some of the smartest and friendliest attendees you’ll ever find.
Almost everyone who attends these conferences say they are the best they’ve ever been to, and I work hard to make sure they can say that every year. This year I believe they will be able to say it again. Make a last-minute decision to come – you’ll be glad you did. To make your decision easier, we are holding the current registration price of $2,195 through the rest of the week.
Now let’s look at what central banks are doing to us.

Gold & Silver Trading Alert originally sent to subscribers on April 20, 2015, 7:59 AM
Briefly: In our opinion, a speculative short position (half) in gold, silver and mining stocks is justified from the risk/reward point of view.
The situation in the precious metals market is quite specific at this time. We have gold moving higher on low volume and moving lower on increased volume (which is bearish), but during the last few weeks miners have outperformed gold which seems to indicate strength. One of the signals that help to decide what the outlook really is comes from silver stocks.
Before we move to silver miners, let’s take a look at gold and silver (charts courtesy of http://stockcharts.com).

As mentioned above, the price of gold moved back and forth and the corresponding action in volume was
bearish. Volume very often confirms the direction in which the market is going and it allows to differentiate between true rallies (that are likely to be followed by even bigger rallies) and corrections (that are likely to be followed by declines). In this case, we saw the latter type of action.
Gold is after a confirmed breakdown below the rising support line and after reaching the 50% retracement based on the February – March decline, so it’s been likely to decline and the price-volume action makes this even more likely.

Silver’s bearish outlook also remains unchanged as the price didn’t do much on Friday. Silver tried to move above the previously broken black support/resistance line, but was only able to move to it on an intra-day basis and decline shortly thereafter.

Yesterday’s price action in mining stocks (the GDX ETF includes both gold stocks and silver stocks) might seem surprising to those who believed that miners would soar right after the breakout as miners refused to rally even despite the gold’s rally on Friday. That’s a bearish sign.
Have we just seen another top? Based on the Nov. 2014 highs being reached – yes. However, we wouldn’t rule out a move to the $21 level as such a move would make the head-and-shoulders patternmore symmetrical. Please note that we don’t have to see this type of move for the pattern to have bearish implications – the pattern doesn’t have to be perfectly symmetrical and a top (right shoulder of the pattern) at exactly the previous top (left shoulder of the pattern) would very much make it meaningful anyway.
Our previous comments about the head-and-shoulders pattern’s implications for mining stocks remain up-to-date:
The red resistance lines that you can see on the chart are based on the possible head-and-shoulders pattern. If we see a move to the Nov. high or even to the $21 level but without a visible breakout above them and then see a decline, the implications will be very bearish. If we don’t see such upswings and miners decline before these levels are reached (which seems likely), then the implications will be very bearish anyway, because the head-and-shoulders pattern will continue to be formed. If it is completed, the decline following the breakdown below $17 could take the GDX ETF below $13.

What about the silver stocks?
Silver stocks formed bearish head-and-shoulders patterns a few times previously. In each case, these patterns resulted in much lower values of silver stocks and the rest of the precious metals sector. What’s particularly interesting about these patterns is that the right shoulder was quite often (2 out of 3 cases) smaller than the left one. Consequently, a move higher here is not required for the right shoulder of the current head-and-shoulders to form. In fact, it’s top could be already behind us.
All in all, the thing that silver stocks tell us is that we can really see a move lower right away, without another small upswing (hence, exiting the small short positions at this time seems premature).

Furthermore, let’s not forget that the silver to gold ratio has recently moved sharply higher, causing the RSI Indicator based on it to become overbought. In EACH case that we saw this development a major decline followed (at times we had to wait for it a few weeks, but it ultimately happened without a bigger rally before it). We have not seen a major decline so far, so the bearish implications remain in place.

The gold to oil ratio closed the week well below its 2011 high, and – because of the size of the move and the weekly close – we consider the breakdown to be confirmed. The implications are bearish and our previous comments remain up-to-date:
We think that there’s nobody in the precious metals market that needs to be convinced that the 2011 top was a major event. However, it was not only major in gold itself, but also in the case of its ratios, including the gold to oil ratio.
This ratio peaked in 2011 as well and it was not until this year that it was broken. The initial move lower in the ratio earlier this year and a rebound from the 2011 high proved that this is indeed a major support/resistance level. This important level was just broken yesterday in a very profound way.
The gold to oil ratio moves in tune with gold, so such a major breakdown in this ratio has bearish implications for gold as well.
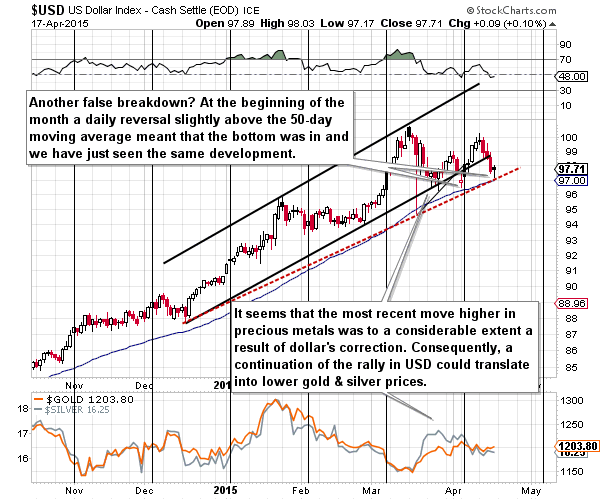
The USD Index declined on Friday, but only initially – it came back up in the following part of the session. Will the USD decline based on the breakdown below the rising trend channel? It’s possible, but it’s not very likely. Please note that this line was invalidated a few times in the past and in each previous case the USD rallied back above it.
Moreover, the 50-day moving average provides support (just like it was the case in mid-March and early April) and so does the red dashed support line based on the December and March lows. Consequently, the outlook did not deteriorate significantly – we can still see much higher USD values in the coming days and weeks.
Summing up, even though it seems that the situation in the precious metals market is improving based on last week’s strength in mining stocks, we think that this is not the case – in fact, the opposite might be taking place. The strength in miners was no longer present on Friday and practically no other market or ratio (i.a. gold, silver, silver to gold ratio, gold to oil ratio, silver stocks, USD Index) is confirming it. While we could see some more strength in miners, it’s not likely to be significant and – more importantly – we don’t have to see more strength for the bearish head-and-shoulders pattern to be completed. The right shoulder has already been formed (it’s after the right shoulder’s highest point) in the case of gold and silver and it seems that it’s about to be formed in the case of mining stocks. The implications are very bearish and it seems that exiting small short positions in the precious metals sector at this time would be premature. If we see an invalidation thereof, we’ll close the positions, but it seems more likely that we will see a bearish confirmation, which will likely result in increasing the size of the short position.
We will keep you – our subscribers – updated.
To summarize:
Trading capital (our opinion): Short (half position) position in gold, silver and mining stocks is justified from the risk/reward perspective with the following stop-loss orders and initial (!) target prices:
- Gold: initial target price: $1,115; stop-loss: $1,253, initial target price for the DGLD ETN: $87.00; stop loss for the DGLD ETN $63.78
- Silver: initial target price: $15.10; stop-loss: $17.63, initial target price for the DSLV ETN: $67.81; stop loss for DSLV ETN $44.97
- Mining stocks (price levels for the GDX ETN): initial target price: $16.63; stop-loss: $21.83, initial target price for the DUST ETN: $23.59; stop loss for the DUST ETN $12.23
In case one wants to bet on lower junior mining stocks’ prices, here are the stop-loss details and initial target prices:
- GDXJ: initial target price: $21.17; stop-loss: $27.31
- JDST: initial target price: $14.35; stop-loss: $6.18
Long-term capital (our opinion): No positions
Insurance capital (our opinion): Full position
Please note that a full position doesn’t mean using all of the capital for a given trade. You will find details on our thoughts on gold portfolio structuring in the Key Insights section on our website.
As a reminder – “initial target price” means exactly that – an “initial” one, it’s not a price level at which we suggest closing positions. If this becomes the case (like it did in the previous trade) we will refer to these levels as levels of exit orders (exactly as we’ve done previously). Stop-loss levels, however, are naturally not “initial”, but something that, in our opinion, might be entered as an order.
Since it is impossible to synchronize target prices and stop-loss levels for all the ETFs and ETNs with the main markets that we provide these levels for (gold, silver and mining stocks – the GDX ETF), the stop-loss levels and target prices for other ETNs and ETF (among other: UGLD, DGLD, USLV, DSLV, NUGT, DUST, JNUG, JDST) are provided as supplementary, and not as “final”. This means that if a stop-loss or a target level is reached for any of the “additional instruments” (DGLD for instance), but not for the “main instrument” (gold in this case), we will view positions in both gold and DGLD as still open and the stop-loss for DGLD would have to be moved lower. On the other hand, if gold moves to a stop-loss level but DGLD doesn’t, then we will view both positions (in gold and DGLD) as closed. In other words, since it’s not possible to be 100% certain that each related instrument moves to a given level when the underlying instrument does, we can’t provide levels that would be binding. The levels that we do provide are our best estimate of the levels that will correspond to the levels in the underlying assets, but it will be the underlying assets that one will need to focus on regarding the sings pointing to closing a given position or keeping it open. We might adjust the levels in the “additional instruments” without adjusting the levels in the “main instruments”, which will simply mean that we have improved our estimation of these levels, not that we changed our outlook on the markets. We are already working on a tool that would update these levels on a daily basis for the most popular ETFs, ETNs and individual mining stocks.
Our preferred ways to invest in and to trade gold along with the reasoning can be found in the how to buy gold section. Additionally, our preferred ETFs and ETNs can be found in our Gold & Silver ETF Ranking.
As always, we’ll keep you – our subscribers – updated should our views on the market change. We will continue to send out Gold & Silver Trading Alerts on each trading day and we will send additional Alerts whenever appropriate.
The trading position presented above is the netted version of positions based on subjective signals (opinion) from your Editor, and the Tools and Indicators.
As a reminder, Gold & Silver Trading Alerts are posted before or on each trading day (we usually post them before the opening bell, but we don’t promise doing that each day). If there’s anything urgent, we will send you an additional small alert before posting the main one.
=====
Latest Free Trading Alerts:
Bitcoin Trading Alert: Bitcoin in Deadlock
Bitcoin went up both yesterday and on the day before. This could have looked like the end of the decline but we were rather cautious about that yesterday. Has anything changed since then?
=====
Hand-picked precious-metals-related links:
Gold below $1,200 on steadier dollar; eyes on Greece, China
=====
In other news:
US, Ukraine Start Military Training, Defying Russian Fury
Greece Flashes Warning Signals About Its Debt
=====
Thank you.
Sincerely,
Przemyslaw Radomski, CFA
Founder, Editor-in-chief


-
I know Mike is a very solid investor and respect his opinions very much. So if he says pay attention to this or that - I will.
~ Dale G.
-
I've started managing my own investments so view Michael's site as a one-stop shop from which to get information and perspectives.
~ Dave E.
-
Michael offers easy reading, honest, common sense information that anyone can use in a practical manner.
~ der_al.
-
A sane voice in a scrambled investment world.
~ Ed R.
Inside Edge Pro Contributors

Greg Weldon

Josef Schachter

Tyler Bollhorn

Ryan Irvine

Paul Beattie

Martin Straith

Patrick Ceresna

Mark Leibovit

James Thorne

Victor Adair