
Gold & Precious Metals

Last week, I told you that I couldn’t even count the number of analysts who mistakenly believe Europe’s financial crisis is over.
Today, I’m going to tell you about those who are wrong about Asia. I can’t even count the number of analysts who still predict doomsday for China.
Or, in fact, for all of Asia — based on some crazy notion that Asian economies can’t possibly thrive when Europe is such a mess and the United States is growing at a mere 2.4 percent.
Meanwhile, for well over a year now I’ve been telling you …
1. That instead, Asian economies — especially China’s — were booming.
2. That Asian stock markets would be some of the best performing markets on the planet.
3. That if you needed income, to look at Asian sovereign bond markets instead of Europe and the United States …
And that other than normal pullbacks, such as we are seeing now in Asian markets, the best long-term growth opportunities will continue to be in Asia, for many years to come.
So who’s been right? Let’s look at the facts:
 A. China’s economy continues to grow at seven percent. Yes, that’s a six-year low, but it’s still 7 percent, enough to double the size of China’s economy roughly every 10 years.
B. The average GDP growth rate of southeast Asian economies for 2014 was a very healthy 4.7 percent. Meanwhile …
C. China’s stock market — Shanghai A share market — was up a whopping 53.05 percent in 2014, and is up 30.37 percent, year-to-date!
At the same time, virtually all Asian stock markets have handily beat the S&P 500.
So then, what’s next for Asia?
As I just mentioned, other than occasional short-term pullbacks, one of which is unfolding now, Asia’s future remains very bright indeed.
Look, as far as I’m concerned, if there’s one thing you need to focus on to understand Asia and to get it right
— despite all the pundits out there who keep calling for Asia’s collapse — it’s this:
Asia is home to 4 BILLION PEOPLE. That’s roughly 60 percent of the world’s population.
Or put another way, three out of every five people in the world are Asian.
And they are leapfrogging from either the late 19th century or early 20th to the 21st century, in one fell swoop.
Can 4 billion people coming from feudal, socialist, or outright communist countries be stopped from wanting more for themselves? For their children? For their grandchildren?
I don’t think so. It’s a force that will drive Asia’s growth for many years, even decades, to come.
It’s a force where domestic consumption is now beginning to outpace the region’s reliance on export economic growth, meaning overall growth in Asia will now enter the next phase, even more turbo-charged than the previous one.
It’s a force where the epicenter of the boom, China, has nearly 4 TRILLION DOLLARS in reserve to deploy to help the country — and the region — grow even more.
It’s a force where 57 countries from all over the world are joining the new Asian Infrastructure Investment Bank (AIIB) — because they all recognize that Asia is where it’s at.
All but the United States, where our President foolishly tried to block other countries from participating in the AIIB.
The rise of Asia is so historic, the ground beneath your feet is shaking, yet most don’t even know it.
In terms of Purchasing Power Parity (PPP), China is already the largest economy in the world. In terms of regularly calculated GDP, China’s economy will be the largest in the world in less than 10 years.
And guess what? That estimate doesn’t even take into consideration China’s new Silk Road, which will turbocharge economic growth not only in rural western China …
But throughout all of Asia as well.
In fact, as I pen this column, China’s President Xi Jinping is in Pakistan signing a $46 billion China-Pakistan Economic Corridor (CPEC) — a 1,865 mile network of roads, railways and pipelines between the two countries.
My view: Asia should be at least one-third of your portfolio, if not more.
Best wishes and stay safe,
Larry
P.S. Why would anybody in his right mind give away investment guides and tools worth $26.9 million? I’m doing it because I am alarmed by the terrifying new developments I see taking place around the world today. And I am ready, willing and able to give you everything you need to help protect and multiply your wealth in 2015 — absolutely FREE.
– See more at: http://www.swingtradingdaily.com/2015/04/22/asia-still-rising/#sthash.SpwFvwPE.dpuf

 Summary
- How concerned is the market about the recent soft patch?
- Were there any warning signs in 2007?
- How does 2015 compare?
Bad Weather To Blame?
Recent economic numbers and earnings projections have come in on the soft side. If the rationale below holds water, we have nothing to worry about. From MarketWatch:
Once again, the U.S. economy appears to have slowed in the first quarter. And once again the fault has fallen on several major snowstorms and periods of frigid temperatures that afflicted much of the country in late January and February. That kept consumers away from retail stores during typically busy shopping hours and prevented builders from starting new construction projects, among other things.
Objective View Of Market Risk
There are many ways to attempt to quantify risk in the stock market. Regardless of whether or not you believe in technical analysis, we know one thing with 100% certainty… we cannot start a new bear market until stocks make a lower high and a lower low. For example, the weekly moving averages shown below made a discernible lower high (near point A) followed by a discernible lower low (near point B) when the S&P 500 (NYSEARCA:SPY) was still trading over 1,400 (it eventually fell to 666).

How Does The Same Chart Look Today?
Instead of making a lower low, the same moving averages recently broke above a downward-sloping trendline (near point A), made a higher high (point B), and last week posted another higher high (point C). Recent market action tells us the aggregate opinion of all market participants is much more favorable today than it was in late 2007.

A More Detailed Look
This week’s video looks at the stock market (NYSEARCA:VTI) from numerous perspectives to assess risk and potential reward.
After you click play, use the button in the lower-right corner of the video player to view in full-screen mode. Hit Esc to exit full-screen mode.
Investment Implications – The Weight Of The Evidence
Our market model will begin to reduce equity exposure when the hard data and observable evidence begins to deteriorate. The lower low in December 2007 is an example of observable bearish evidence. Based on the evidence in hand, we continue to hold an equity-heavy allocation. With inflation data, durable goods, and GDP coming later this week, we will observe with a flexible and open mind.

One of the defining traits of financial bubbles is the willingness of traders and investors to interpret pretty much everything as a buy signal. Rising corporate earnings mean growth, while falling profits mean easier money on the way. War means more revenues for defense contractors and easy money for everyone else. Blizzards means consumer spending will rebound in the Spring. Inflation means higher asset prices for speculators while deflation means, once again, easier money for everyone. When people are this optimistic they find the silver lining in every black cloud and happily to buy the dips with borrowed money.
A timely example is Greece’s threat to leave the Eurozone, default on its debt and go back to using drachmas. This could be seen as either the beginning of a chain reaction that destroys the eurozone and the rest of the world as we know it, or as an excuse for vastly easier money. So far — in a sign that the bubble is still expanding — each new twist (like last weekend’s announcement of de facto capital controls) has been accompanied by European Central Bank reassurances and market acceptance of those promises.
Another case in point is China’s twin weekend announcements that two major companies defaulted on their debt while the government eased bank reserve requirements. The pessimistic take on such things happening simultaneously would be that China’s financial sector is in crisis and the government is desperately and probably impotently trying to stop the bleeding. But the European and US markets saw only the liquidity side of the story and bid up risk assets pretty much across the board.
When we change our minds
But in the life cycle of every bubble there comes an emotional phase change. Dark clouds start to obscure their silver linings and new highs get harder and harder to achieve. Think home prices rising beyond middle-class affordability in 2007 or tech stocks hitting 50-times sales in 1999. Only unambiguously good news can keep the bubble going, and because few events are that pure, the crowd gets nervous and the spin gets negative. Faster growth means tighter money; a weak dollar means inflation while a strong one means falling corporate profits. War means instability, extreme weather means lower near-term growth. So sell the rallies and hide out in cash.
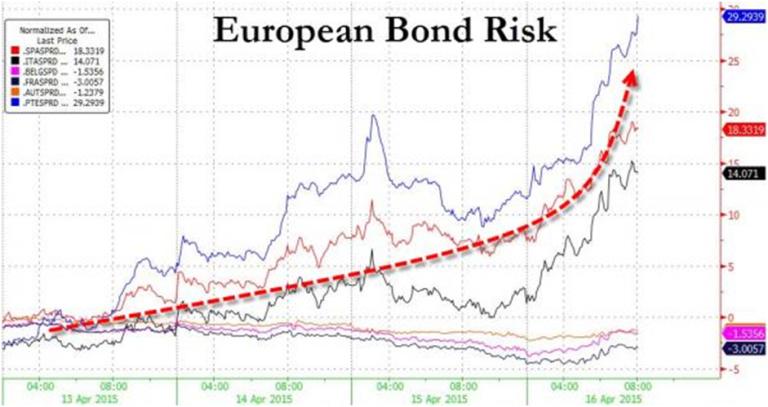
The world isn’t quite at this point — or maybe it is. The following chart (from Bloomberg) shows the impact of Greece’s impending loan deadline on a measure of risk in peripheral eurozone bond markets. Greece is the blue line; the black and red are Italy and Spain.
There’s no way to know until after the fact if the dark night of the market’s soul has begun. But when it comes, that’s how its first stage will look.
Saudi Arabia is not trying to crush U.S. shale plays. Its oil-price war is with the investment banks and the stupid money they directed to fund the plays. It is also with the zero-interest rate economic conditions that made this possible.
Saudi Arabia intends to keep oil prices low for as long as possible. Its oil production increased to 10.3 million barrels per day in March 2015. That is 700,000 barrels per day more than in December 2014 and the highest level since the Joint Organizations Data Initiative began compiling production data in 2002 (Figure 1 below). And Saudi Arabia’s rig count has never been higher.

Figure 1. Saudi Arabian crude oil production and Brent crude oil price in 2015 U.S. dollars. Source: U.S. Bureau of Labor Statistics, EIA and Labyrinth Consulting Services, Inc.
….for larger Charts & more commentary go HERE


-
I know Mike is a very solid investor and respect his opinions very much. So if he says pay attention to this or that - I will.
~ Dale G.
-
I've started managing my own investments so view Michael's site as a one-stop shop from which to get information and perspectives.
~ Dave E.
-
Michael offers easy reading, honest, common sense information that anyone can use in a practical manner.
~ der_al.
-
A sane voice in a scrambled investment world.
~ Ed R.
Inside Edge Pro Contributors

Greg Weldon

Josef Schachter

Tyler Bollhorn

Ryan Irvine

Paul Beattie

Martin Straith

Patrick Ceresna

Mark Leibovit

James Thorne

Victor Adair