
Gold & Precious Metals

The slowdown in retail sales growth has been a big surprise this spring, as lower gasoline pump prices were expected to boost spending. What’s going on?
Analysts at TIS Group have a fascinating if scary answer: The consumer credit cycle is breaking down as families sense the economy is slipping a gear and don’t want to over-leverage themselves. This is happening even as corporate credit continues to boom.
It’s the old story, right? If you don’t need credit, you can get it — and if you do need it, you can’t.
This distinction is important because the world is not on a typical boom-and-bust business cycle. With central banks driving much of the action, the world is instead on a credit cycle, which according to TIS means that everything depends on the availability and price of credit.
With the Fed threatening to raise rates despite a disinflationary environment, credit conditions are changing in the United States as well as in other developed countries.

The chart above, provided by TIS, shows that according to Federal Reserve data, Consumer Credit Revolving fell
sharply in February 2015 (blue circle). The analysts note you have to go back to mid-2010 and then to the dark days of the first quarter of 2009 to see readings as weak. In its commentary, the Fed has focused on consumers’ unwillingness to charge purchases.
This is not about the weather; it is about consumers’ view of the future of their jobs and wages. It can be seen as a warning that consumers are reining in their purchases and not using their windfall from lower gasoline prices in the expected way.
It gets worse. The National Association of Credit Managers produces a monthly report on credit conditions, and the March edition, which you can read here – and you should read it — paints an incredibly gloomy picture of current credit stresses.
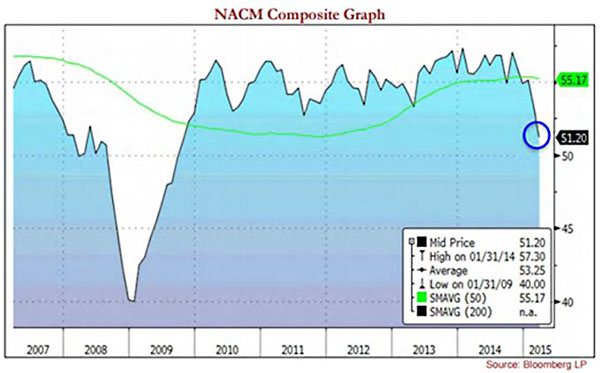
This chart above shows the NACM Index Composite and appears to show a problem is developing in the credit system. This is how NACM described it in the March blog:
“We now know the readings of last month were not a fluke or some temporary aberration that could be marked off as something related to the weather. There is quite obviously some serious financial stress manifesting in the data and this does not bode well for growth of the economy going forward. These readings are as low as they have been since the recession started and to see everything start to get back on track would take a substantial reversal at this stage. The data from the CMI is not the only place where this distress is showing up, but thus far, it may be the most profound.”
TIS analysts note that in the NACM Composite, a reading below 50 signals an economic contraction is underway. The last sub-50 reading was in September 2009. So after 5.5 years, the NACM Composite is closing in on a return to contraction territory, though it is not there yet.
Looking at sub-indexes of the composite, the Service sector’s unfavorable conditions have generated a reading at 48, which signals contraction. Manufacturing was also below 50, at a 48.9 reading. So the consumer’s willingness and ability to borrow is deteriorating. And companies are also experiencing more difficulty accessing credit, the analysts observe.
This begs the big question: Why is this happening?

We need to dig deeper, and look at another NACM gauge called the Rejection of Credit Applications Index. The TIS analysts call it “a real stunner,” and it sure is. Broken down by service and manufacturing sectors, the service reading is at 42, worse than it was during the September 2008 crash. The manufacturing reading is 43.8, also below September 2008 levels. In fact, the March calculation is the largest increase in rejections of applications for credit on record.
TIS goes on to conclude that “this is what a burgeoning credit crunch looks like.” Based on this data, the notion that the Fed is even thinking about raising the price of credit — at a time it is already hard to come by — seems crazy and impossible. It might even be fair to expect the Fed would want to ease credit amid such conditions.
This is a very out-of-consensus idea and may help explain why the stock market remains stuck even as it bumps against the top of its recent range.
Corporate Bonds Rule
So what about the corporate bond market?
For this part of the story, I turn to old friend Fil Zucchi, a money manager and independent analyst in Arlington, Va., who argues that the credit managers report above is consistent with what’s been happening since 2009. “The economy basically sucks for individuals and small companies and their credit is tied to that,” he said.
But Zucchi added that if you are a large company that has access to the public debt markets or syndicated bank lines, pension funds are throwing money at you. The markets are about financial engineering, not fundamentals, these days — and the cash from large debt buyers that allows for such engineering activities like buybacks and dividend increases keeps rolling in, arguably even at an accelerated pace. Even energy credit is improving and there’ve been some very large refinancing deals in that space in the last couple of weeks.
Fil goes on to point out that first quarter corporate bond issuance was $399 billion in 2009, $429 billion in 2011, $457 billion in 2012, and was $496 billion this year.
In short, corporate debt issuance is not broken — it is blowing away all years post-financial crisis. As a point of reference, he notes that veteran credit analyst Brian Reynolds argues that an annual average issuance of approximately $100 billion per month suggests that companies are issuing debt not only to refinance maturities and for operating cash, but to also to fund buybacks.
To see how recent corporate bond issues trade in the secondary market, Fil tracks a cross-section of new bonds, trying to cover most industries and credit quality. His only filter is the size of the offering, a minimum of $750 million. The latest batch is by far the strongest seen in the past three years, he says.
Zucchi also looks at the generic Investment Grade and High Yield Credit Default Swaps indices. In a strong credit cycle, these have become the most important derivatives because they are the instruments that credit bears will attack when they want to disrupt markets.
You may recall from the financial crisis that credit default swaps, or CDS, are essentially insurance contracts for credit. They move higher when credit holders are worried and reach for more insurance, and move lower when credit holders are not worried about defaults and become increasingly complacent.

The chart above, supplied by Zucchi, shows the investment Grade Credit Default Swaps with bands that can be used as guides for when: a) bulls are firmly in control; b) things are getting agitated; and c) bears may be gaining the kind of upper hand that has been a precursor to the 2000-2002 and 2007-2009 financial debacles.
When he captured this screenshot, the IG CDX was a little bit above 65bps. Since then it has fallen lower. Fil observes that the 60 bps area has been a line in the sand for credit bears. Below that level, he says it is likely they would be forced to initiate a whole new round of short covering — an event that would likely spill over into more buying of equities.
The bottom line is that while consumer credit may be freaking out, corporate credit appears to be quite healthy. Perhaps this is just another manifestation of the difference between the 1 percent and everyone else.
Best wishes,
Jon Markman

Crude oil has been the center of energy-related headlines since 2H14 when it started its dramatic ‘normalizatin’ process while everybody (us included) seems to have forgotten about natural gas. So we thought we should give an update on natural gas as well.
Market Watch reported that May natural gas NGK15 settled at $2.49 per million British thermal units (MMBtu) on Monday, ahead of the May contract expiration on Tuesday. Prices, based on the front-active contracts, haven’t settled at levels this low since June 15, 2012.

Chart Source: Market Watch, April 27, 9 pm US CST
According to EIA inventory report, total domestic natural gas storage has been trending in the same direction as crude inventories –up, way up. As of April 17, total lower-48 working gas underground stockpile stood at 1,629 Bcf (Billion Cubic Feet), up 82.6% from a year ago. However, unlike crude oil inventories which have reached unprecedented ‘no-man’s land’ by any historical record, natural gas inventory is at least still within it 5-year range.

Source: EIA, week ending April 17, 2015
Despite the export ban on crude oil, domestic oil may still find ways to move some of the glut to international markets via petroleum products like gasoline and diesel. U.S. already beat Russia and achieved the status as the top natural gas producer in the world. But while LNG seems to offer some promising prospect for gas globalization, natural gas in the U.S. remains land-locked and a distant poor little brother to the tall, dark, crude oil.
Based on an energy equivalent basis, crude oil and natural gas prices should have a theoretical ratio of 6 to 1. The geographical constraint of domestic gas was part of the reason when Henry Hub price dipped below $2 about two years ago, the oil to natural gas ratio exploded to 52:1 (WTI at the time was at ~$102/bbl) surpassing the previous record-breaking 25 to 1 in 2009. That ratio right now is about 23 to 1.
For now, natural gas is in the ‘shoulder season’, neither too cold nor too hot to spur any seasonal demand spike, while also suffering from the same overall demand slow-down as oil with limited capability to move the over-supply outside the U.S. and Henry Hub.
Market Watch also noted that one analyst see the $2.50 level as “a psychological support number,” while T. Boone Pickens said prices will reach above $3 this winter. We believe the $3 or $4 price level is certainly attainable with a couple of cold snaps, and/or hurricanes, but the oil to gas ratio most likely would not revert back to its historical pattern of 8-12x (prior to 2007) any time soon, even with the new normal of $50 oil.
 It’s been less than a week since the big chiefs of the commodities world met at the FT Commodities Global Summit in Lausanne, Switzerland, situated along the beautiful banks of Lake Geneva, yet already the markets have begun to adjust its collective expectations. So what’s all the fuss about?
Quite simply, all of the commodity moguls, from Gunvor to Glencore to Vitol, all among the largest private companies in the business, have proffered one clear message and it is this: That they, nearly to a one, expect a healthy recovery in commodity prices. With all of the big shots expressing an upbeat view it becomes clear that they are acting on far more information than the rest of us, as one might surely expect, as being in the commodity business allows them ready access to more tangible and viable data. That nearly unanimous upbeat tone should be taken as a rather clear sign that we are about to see a bounce back in commodity prices. Surely, with currencies such as the Aussie, Kiwi, Loonie and the Norwegian Krone, and many more currencies beyond those, being highly sensitive to commodities prices, we are likely to see perhaps a significant impact in the FX arena.
Two Big Predictions
Although the talk at the Commodities Summit was on commodity prices, in general, it was evident that two sectors had drawn more attention than the others. Oil, naturally, because of its importance to the global economy but also Iron Ore, a key ingredient in the making of steel and one of the major commodities exported to China.
Iron Ore prices have now recovered by roughly 15% from their low amid talk of more stimulus and more monetary easing from the Peoples Bank of China in its ongoing efforts to stimulate the economy and allow China’s housing market to recover. With China being the world’s largest Iron Ore consumer and with Chinese traders increasing their stockpiles in anticipation of further gains, many predict that more upside is to come for Iron Ore.
Although most Oil chiefs were upbeat on Oil, one prediction caught investors’ attention; that was the prediction made by Tony Hayward, the former CEO of British Petroleum and the incumbent chairman of Glencore, one of the largest commodity traders in the world. According to Mr. Hayward, Oil prices have bottomed out and Oil will now be heading to $80, undoubtedly a number we haven’t heard for a long while in the context of Oil. The pillar of Hayward’s prediction is the quick reduction in Oil rigs in the US, signaling a sharp reduction in US oil output, with many companies cutting back on future investment in shale oil production. With the US shale Oil boom being a key factor in the steep downfall of Oil prices in the first place it’s understandable why the Oil chief expects a robust return in prices.
Two Laggers to Avoid
In fact, we have talked about the possibility of a rebound in Oil prices for while, with the chances of the Yemen conflict threatening Oil supplies and given the reduction in Oil prices. Now, the key questions are which currencies stands to gain from all of this and how durable will this trend be?
Although most commodity linked currencies will stand to benefit, somehow, it’s fairly obvious which two currencies are the least favored. The first is the Russian Ruble, because despite having an upside potential (in the event Oil prices do recover) the political uncertainty and risk of sanctions make the Ruble a risky long term bet. And the second currency to be less favored in the commodity pack? It is the Canadian Dollar, aka the Loonie. Despite having an upside potential from Oil prices and the surge in commodity prices, in general, there are two factors that hurdle the Loonie’s chance to yield better returns than its peers in the commodity space. The first is the fact that the cost of production per barrel in Canada is one of the highest in the world; hence, Oil prices would have to recover substantially more in order to lift growth in Canada and boost the country’s exports yet the Canadian economy would still lag versus its peers. And the second reason? Canada’s major export destination is none other than the US, and with the US still having record reserves of its own Oil, it’s clear that the liftoff in demand for Canadian Oil in the US will be much slower than it will be for Oil exporters in other areas of the world, i.e. Asia or Europe.
The Outperformers
While there are some potential laggers to this brewing recovery there are some currencies best positioned to outperform. The first would be the Aussie, with its high exposure to China and Asia, in general, and with Iron Ore being one of its major exports to China. The second would be the Norwegian Krone, because while the Krone is oriented towards Oil, unlike the Russian Ruble there is no political uncertainty to weigh on the currency. And unlike Canada, most Norwegian North Sea exports are headed to Europe or Asia. How will this massive trend brew into targets for those currencies? In the next two articles, I intend to crunch the fundamentals of the two and shed light on what I deem as a probable target for the two currencies in the eye of the big commodity rotation.
Look for my post next week.
Best,
Lior Alkalay
INO.com Contributor – Forex
Disclosure: This article is the opinion of the contributor themselves. The above is a matter of opinion provided for general information purposes only and is not intended as investment advice. This contributor is not receiving compensation (other than from INO.com) for their opinion.

 You may not like PM Stephen Harper’s politics but you should love his new policy on increasing TFSAs. Yes the Liberals and NDP say it makes the rich richer, but in fact it also helps the middle class dramatically.
The fact is this new policy provides a better return on your investment (after tax) than sinking money into your RRSPs. In fact, if you only have the ability to choose between one or the other, you should seriously choose TFSAs. With the new increase from $5,500 to $10,000 per year (to a max of $41,000), this allows you to start to put aside some serious money for you and your spouse. The Liberals say it will cost billions to government coffers which means they are upset that you get to keep more of your money instead of giving it to them to manage.
If you read this recent article in the Financial Post by Ted Rechtshaffen (CLICK HERE), you’ll see the benefit of adding more of your money into TFSAs.
Increase your wealth by placing Private Equity into your TFSAs
So what should you invest in your TFSA? If you’re not investing in private and alternative (P&A) investments, you are missing the boat. It’s that simple. The P&A market is hitting record highs. According to McKinsey & Co, it’s more than doubled since 2005 – hitting a record high of $7.2 TRILLION! The problem is most Canadians are unaware of this new sector and continue to miss out on opportunity to grow their wealth and provide non correlating assets into their portfolio. If you only use the stock market, you have to buy stocks that do not correlate with each other. For example, buying energy stocks and buying airline stock to hedge on the price of oil. By adding private equity and alternative investments to your portfolio, you don’t have to add the known losers to hedge your bet. You can buy something that does not care what the price of oil is nor if people will fly this year.
Heck, even our CPP (Canada Pension Plan) almost contains 20% of non-traditional assets. As a general rule of thumb, we recommend the new 80 / 20 Rule for investing. Gone are the days of the old 60 / 40 standard of equity and bonds. The new standard should be 80 / 20 of public / private asset mix. The National Post has a great article on alternative investments by John Shmuel (CLICK HERE).
At TriView, we’re private equity specialists that promote the idea of a diversified portfolio has private and alternative investments. We want to educate our clients on how to maximize the diversity in their portfolios while making capital preservation our main goal. We can provide yield and capital growth through private real estate opportunities and alternative investments. To learn more, visit our website at www.triviewcapital.com.
Craig Burrows


-
I know Mike is a very solid investor and respect his opinions very much. So if he says pay attention to this or that - I will.
~ Dale G.
-
I've started managing my own investments so view Michael's site as a one-stop shop from which to get information and perspectives.
~ Dave E.
-
Michael offers easy reading, honest, common sense information that anyone can use in a practical manner.
~ der_al.
-
A sane voice in a scrambled investment world.
~ Ed R.
Inside Edge Pro Contributors

Greg Weldon

Josef Schachter

Tyler Bollhorn

Ryan Irvine

Paul Beattie

Martin Straith

Patrick Ceresna

Mark Leibovit

James Thorne

Victor Adair