
Bonds & Interest Rates
 With continued volatility in global markets, today one of the greats in the business sent King World News a powerful piece warning about a loss of confidence in the Fed and the most important data in 6 years. He also discussed what is happening in the metals and currency markets.
May 8 – Overnight bond markets were mixed, though German 10-year bunds continued to take a beating, trading as high as 65 basis points before rallying a bit. World equity markets were slightly weaker. The early going here saw the indices sort of hugging unchanged, though slightly red through midday. In the early afternoon though, a small party started and the market closed roughly 0.5% higher. I guess most folks were not too worried ahead of tomorrow’s (Friday’s) nonfarm payroll roulette wheel.

 Elon Musk just unveiled something called the “Tesla Powerwall,” a means to store solar-created electricity in people’s homes… with the potential to put the entire utility industry out of business.
As you probably know, Musk also has these electric cars that people seem to like to drive… with the potential to put all the major car manufacturers out of business. Oh, and the dealerships too.
Musk also has a spaceship company. It is his stated goal to leave Earth and set up shop on Mars. He has already put the US government out of business when it comes to space.
How did he manage to do all this stuff? He made $34 million selling a software company when he was 24, which he freerolled into PayPal, which he made $165 million selling in 2002. He then freerolled that into SpaceX and Tesla.
Oh, and another thing. Musk thinks the state of California is incompetent to build a choo-choo train going from San Francisco to Los Angeles, so he drew up plans for a “Hyperloop,” basically a giant pneumatic tube that can get you there in 35 minutes for $20.
He said he didn’t have time to build it, so he gave the plans to the state for free. (Jerry Brown is going ahead with the snail rail. Unions need to get paid, you know.)
Feel Terrible About Yourself Yet?
I’m not done. He is chairman of a company called SolarCity, which is the second-biggest residential solar panel maker in the country. They will come to your house and install solar panels, so you don’t have to buy electricity from the grid.
Now—if you watch the video of Musk’s Powerwall speech, you’ll start to see the genius of his plan.
You have these giant batteries you keep in your house (which take up little space and hang flat on the wall).
You have solar panels on your roof to generate electricity.
You store the electricity in the battery when the sun goes down.
You charge your car off the battery.
Everything—every house, every car, every business–is now powered by what Elon Musk calls a “giant nuclear fusion reactor in the sky, which runs all the time.” Not oil or gas or coal.
I wouldn’t consider myself a big environmentalist, but still, this excites me. Have you ever heard of something called “Moore’s Law” where computing power grows at an exponential rate? It applies to solar panels too. It won’t be long before solar power is cheaper than conventional energy sources.
The politics of it are a little tricky. I don’t like subsidizing solar, and SolarCity’s entire business model is based on solar tax credits. But soon, it won’t matter—the technology will exist for solar power to compete directly with fossil fuels. And the higher oil prices go, the better solar will look.
Growing Eyes in the Back of Your Head
Elon Musk is a pretty inspirational character, but he seems to have made a lot of enemies along the way. Democrats don’t like him because he’s a creature of business and finance. Republicans don’t like him because he lives off subsidies. Not bad for a guy who calls himself half-Democrat, half-Republican.
The car companies sure don’t like him. If oil gets back above $100, they will like him even less. The history of the auto industry is full of all kinds of backstabbing and intrigue (see Preston Tucker).
If everyone starts driving electric cars, the oil companies aren’t going to like him very much, either.
And the utilities are really going to have it out for him. But they suck. Of all the terrible businesses out there, including the tobacco companies, I despise the utilities the most—even if it isn’t really their fault.
The utilities generate and distribute electricity pretty much the same way they have for the last 100 years. No innovation at all. Why not? Well, because we decided they were utilities! If you put a cap on the rate of return someone can earn, there isn’t a lot left over for innovation. So be very careful what you start calling a public utility.
SolarCity gives us the promise of distributed generation, where electricity is generated at the home or business, and if it’s generated in excess, it’s sold back to the grid. This already happens in dribs and drabs, and is starting to have an impact on the power trading business.
If enough people generate their own electricity, you don’t really need utilities anymore.
It’s not hard to see where this is going. The utility companies are going to fight back, hard. But not in the free market—on Capitol Hill.
If Musk is permitted to succeed—which is a big if—there’ll be no more carbon emissions and a cheap, endless power source.
Yes, We Can
This is save-the-world type stuff. Pretty ambitious. But will it work?
I can’t say this cynically enough: A lot of it depends on Musk managing the politics… not the engineering.
I owned both Tesla (TSLA) and (SolarCity) SCTY for a time. I traded them pretty well, which doesn’t happen often. I don’t currently own them.
One thing I love to say: Whenever you have a disruptive innovation, it’s a lot easier to bet against the losers than on the winners. And the utilities are clearly the losers.
It’s a long-term thesis, maybe 20 years, but this is like betting against BlackBerry (RIMM) in 2008—one of those trades that will seem really obvious seven years from now.
Then again, utilities have never been a growth business. It’s all about the dividends. And stupid dividend investors will hang on to a trade far longer than economic sense dictates. See tobacco.
I have a hunch that 20 years from now, we won’t be burning coal for electricity. But not because of any government decree, but because the free market will have done what the politicians couldn’t do for themselves: make renewable energy sources cheaper.
Jared Dillian

Signs of The Times
“$53 trillion of all global bonds have negative yields, of which 60% are European.”
“Central bank assets now exceed $22 trillion, equivalent to the combined GDP of US and Japan.”
−Zero Hedge, April 21.
What a promotion!
Members of our Friday lunch group have been in the markets for a long time and recently we recalled a really blatant Vancouver promotion. It was so obvious that “even the crooks called it a ‘crooked deal’.”
There is nothing more dangerous than academic economists craving fame and Wall Streeters craving instant wealth.
This racket is becoming increasingly eligible to a bout of professional infamy.
In the meantime:
“A four-year-old auto finance company…sold $149 million bond deal consisting of car loans made to borrowers considered so subprime you might call them–dunno–sub- subprime?”
−Bloomberg, April 22.
“Wall Street’s biggest names are getting their mojo back. The results were particularly notable at Goldman, which received a big boost from its trading desk–a core focus for the firm.”
−Wall Street Journal, April 17.
“Stunned…Despite soaring stock markets and low gas prices, Consumer Confidence tumbled to 95.2 (against expectations of a jump to 102.2. The March figure was 101.4).”
−Zero Hedge, April 28.
This is noted as the biggest miss since June 2010.
*****
Stock Markets
Bigger Picture:
In the face of such remarkable financial speculation, it seems appropriate to review the intentions of policymakers. The notion of a “lender of last resort” was behind the advent of the Fed. That with a “flexible” currency would provide stability. After all–nasty financial setbacks that initiated recessions would be prevented.
Fabulous idea. And it is still a fable.
Now, why are stocks up when Consumer Confidence (CCI) is plunging?
CCI may not be moving on seasonal pressures, the stock market has been on a seasonal rally.
This goes back to October when the seasonal decline generated a Springboard Buy. The “natural” next leg up would likely run into around May. Other guidance was that when the crude crash ended it would prompt a stock market rally of around three months.
That gets us to, well, around now and there are no doubts about another eruption of private- sector speculative activity. Central banking is still controlled by speculators and they are still in a speculative mode.
And as we have been noting, this is the season when virtually straight-up action can erupt and then collapse. Our April 9th Pivot outlined that this could be accomplished within eight weeks. Next week is Week Four and in the US, IBB has been surging. New issues in China have been, as the saying went, “out of sight”. That’s in the number of IPOs and as in straight up.
Often this type of rally is called “parabolic”. Mathematically, this implies that the curve can be solved. This is not the case, as the ending action of a mania is a skewed growth curve and there is no formula for it. In so many words, a computer cannot solve it and predict its end.
Don’t despair.
There is the “analogue model”. Each such blowoff has had similar characteristics and the chart of one example overlays another example. The Daily chart of the South Sea Company (let’s call it SSC) in 1720 is remarkably similar to that of RCA in 1929, Cisco in 2000, housing was the phenomenon in 2007 and IBB is a good example now.
SSC peaked in June of that fateful year; RCA in May, with the test at the same level in that fateful September; Cisco set its peak in late March, made the test in July and died; IBB set what could be a peak in late March and is struggling after the test in April.
Representative examples in Shanghai seem to be taking a break from the rapture mode.
The record is that each bubble, in its day, was the greatest financial speculation in history. For each set of participants, a culmination was unthinkable. For those who were thinking it would be at a higher level.
In reaching for perspective, it is reasonable to conclude that this one really is different. It includes an global bubble in bonds that is without precedent. And it is coming apart–big time!
Last week’s conclusion in Stock Markets was: “We should soon start considering the probability of a liquidity crisis.”
It is arriving.
Nearer Term:
The old Dow Theory has been providing some guidance. Non-confirmations by the Transports of the general rising trend has been “on” since the first of March. We have considered this as an alert, which is becoming more acute this week
Last week, the TRAN rally stopped at the 50-Day. This week it’s been below the 200-Day at 8700. The dive into early April stopped at 8527 and taking this out would set an intermediate downtrend. Taking out the October low of 7700 would be very bearish.
Biotechs (IBB) accomplished a surge to to 375 in March. This was sensational enough to register a “Trifecta”, which is Upside Exhaustions on the Daily, Weakly and Monthly readings.
Ross had an initial target, which provided support and the bounce tested the high at 368. The April low was 334 and at 334 now it is threatening that support. It is also well below the 50- Day moving average.
As noted, this surge of speculation is exceptional, which represents a compulsion that will not quit quietly.
Our view has been that the when the “around May” surge burns out, a summer of consolidation would be probable. Enough of a change in credit markets could force an overall contraction.
US credit spreads widened until the mini-panic completed in January. This was part of the crash in crude and narrowing lately is on a seasonal move that could end “around May”.
Last year’s reversal to widening started at 143 bps in June and the worst was 212 bps in January. So far, the best on this has been 176 bps this week. This is testing the initial “rebound” into March.
This correction in the main trend of widening could reverse within the next 4 weeks or so. Getting beyond 187 bps would technically resume the trend.
After flattening for some 16 months and it within the time window when reversal has been probable. The most for the move was accomplished a couple of weeks ago. Breaking below the 50-Day ma would be an alert to change.
Again, we should repeat our Consumer Product Warning. Reversals in spreads and the curve have anticipated significant contractions and, what’s more, the senior central bank has been unable to prevent the change.
Long-dated Treasuries soared to an exceptionally overbought condition in late January. Our special study of January 20th “Ending Action” called for the end of the great bull market that began in the financial crisis of 1981.
The ChartWorks of February 2nd reviewed technical excesses then and last Wednesday published “Noteworthy Break in Bonds”.
In a couple of Pivots, the comment was that the reversal in the US market would eventually encompass the even greater mania in European bonds.
Last Wednesday’s special on bonds observed that the German yield seemed to be reversing. That was at 0.10% and a break above 0.20% would reverse the trend. That was accomplished on yesterday as the yield soared to 0.29. Today it has reached 0.37%.
And the ECB was buying at below 0.10%. This blunder could rank with defending the pound when Soros was short in 1992.
Sure, the numbers are small but the change is big.
Using the TLT, the high for the US bond was 137.66 at the end of January and the initial low was 122.71 in early March. The rebound made it to 132.48 in late March. Since then the trade has followed the declining 50-Day ma. Declines this week have taken the price down to 124.51. It only took three days to plunge below the 50-Day
While the bull market for Treasuries was on, there was little point in reviewing the history of real interest rates (as adjusted for inflation). On every great bubble real long rates in the senior currency have declined to significant lows. In some cases such as in 1873 the yield declined to negative. In 1929 it did not. In 2007 the declined was to minus 1.5%.
The main thing is that on the five examples from 1720 to 1929 the typical increase was 12 percentage points. In the 2008 financial collapse the real yield jumped from -1.5% to +6%. Bad enough, but obviously not enough to end the abuse of the credit markets, otherwise known as a “New Financial Era”.
In each case, the increase was accomplished through rising nominal interest rates as commodities decline. A more thorough update on real interest rates will follow. “.
Commodities
Generally, most commodities were likely to rally into “around May”.
Crude ended its crash in January at 43, which was tested at 42 in March. Now at the 59 level, the Daily RSI has had a huge swing from very oversold to almost overbought. The ChartWorks notes that momentum is enough to register a Springboard Sell, which could become effective over the next few weeks.
Energy stocks (XLE) have rallied from 71 in January to 83.25 earlier today. This touched the 40-Week ma, which represents resistance. It is a good gain in a volatile world and money should be taken off the table.
Commodity index, DBC, has rallied from 16.84 in January and the test at 16.71 in March. Now at 18.25, the RSI has had a good swing from very oversold to almost overbought. There is resistance at the 18.40 level and there is only a few weeks left on the favourable season.
Within this, base metals (GYX) set lows at 300 in January and March. The latest rally bounced off the 50-Day and is accomplishing an outstanding swing on the Daily RSI Mining stocks (SPTM) have rallied from 513 in January to 794 earlier today. This is becoming overbought in the window of opportunity. The opportunity now is to take money off the table.
Lumber became exceptionally oversold in April and the best that can be said about the chart is that it is trying to find stability. Tree stocks such as WY are in a similar pattern. We would avoid the sector.
In January we looked to the possibility of a “rotation” whereby depressed commodities could rally. This has essentially been accomplished and there is little point in staying in the trade.
Precious Metals
Gold stocks (GDX) rallied from 16.34 in November to 23.22 in January. That was right at the 40-Week ma and the next low was 17.29 in March. The latest rise made it to the 200Day earlier today and has retreated. This is not healthy.
For a sustainable rally in the sector, gold stocks would have to outperform the bullion price. The ratio has rallied from .152 in December to .181 yesterday. This has been good but the problem now is that it reached the 200-Day, which has been declining and offering resistance on every rally attempt.
The other constructive essential would be silver outperforming gold. The silver/gold ratio set a low at .129 in November and made it to .143 in March. The declining 200-Day ma ended that rally and the chart looks weak.
The high for the GDX was 20.90 yesterday and it has slipped to 20 today.
Our advice in November was to accumulate some gold stocks into weakness. We did not get fully invested. Our concerns have been that another liquidity crisis could be discovered after mid-year and it would not be good for most precious metal stocks.
The next crisis seems to have started and we would take money out of gold stocks.
Today’s weakness in gold and silver in the face of a steady dollar is interesting. At the open, silver was very weak relative to gold.
Let’s look at the gold/silver ratio. The key low was 69.4 on March 23rd and the bounce was to 76.4 last Thursday. The drop was to 72 on Tuesday and it popped to 73 yesterday and this is starting to tell a story.
When the ratio goes up it signals a pending credit contraction and in looking at the action this week, rising through 77 would set the uptrend. This would indicate a developing credit crisis.
The bottoming process in the Precious Metals sector will be prolonged.
In the meantime, gold’s real price has sharply corrected from its high in January. We use our Gold/Commodities Index to keep track. The low was 340 in June and we have considered that that set the beginning of a cyclical bull market. The high was a screamingly overbought at 505 in January and the correction has been to 450 in February and this week. This is oversold on the Daily RSI and support should hold.
Our long-term mojo has been that the cyclical bull market for gold’s real price will eventually pull gold shares up.

-
The 40-Day exponential moving average has provided key support on each correction.
-
This was violated in early April.
-
This week’s retreat from trying to rally above the moving average is a failure.
- This is threatening key support at 75, the March low.
BOB HOYE, INSTITUTIONAL ADVISORS E-MAIL bhoye.institutionaladvisors@telus.net
WEBSITE: www.institutionaladvisors.com

 FINANCIAL REPRESSION – What It Means for Investors
Global leadership is faced with the dilemma of maintaining stability in an over indebted world. Decades of consuming more than you produce and unsound money practices has left developed economies with few politically realistic options. Failed Public, Fiscal and Monetary Policies have resulted in excessive Debt to GDP levels, unpayable entitlement / social obligations and sovereign Fiscal Gaps that have historically never been seen before.
Monetary Policy is primarily relying on the Macro Prudential Strategy of Financial Repression to attempt to maintain stability & solvency as debt levels are slowly “vaporized’ through the post WWII proven techniques of Financial Repression.
….continue reading HERE

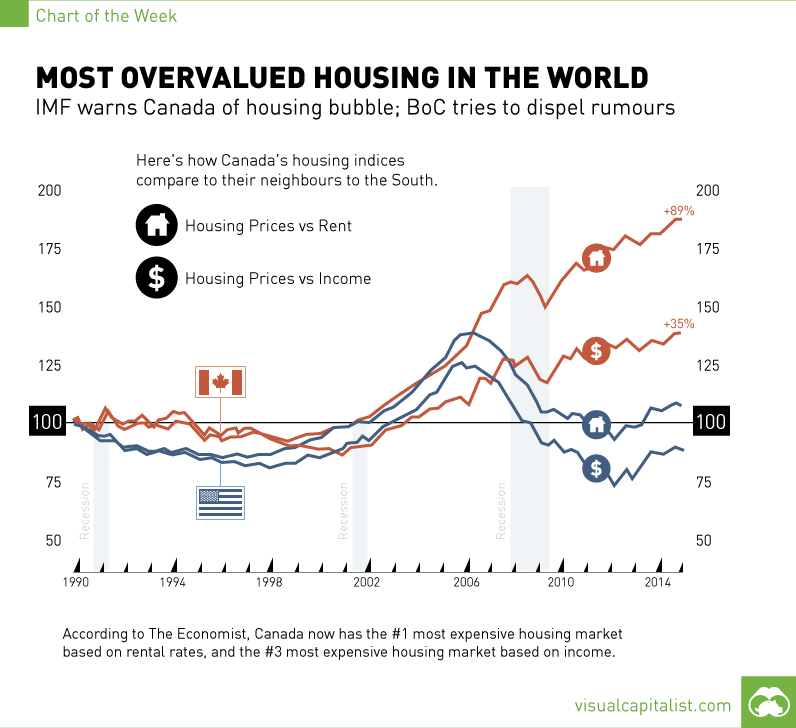
In every inflating bubble, there’s usually two camps. The first group points out various metrics suggesting something is inherently unsustainable, while the second reiterates that this time, it is different.
After all, if everyone always agreed on these things, then no one would do the buying to perpetuate the bubble’s expansion. The Canadian housing bubble has been no exception to this, and the war of words is starting to heat up.
On one side of the ring, we have The Economist, that came out last week saying Canada has the most overvalued housing market in the world. After crunching the data in housing markets in 26 nations, The Economist has determined that Canada’s property market is the most overvalued in terms of rent prices (+89%), and the third most overvalued in terms of incomes (+35%). They have mentioned in the past that the market has looked bubbly for some time, but finally Canada is officially at the top of their list.
Of course, The Economist is not the only fighter on this side of the ring.
Just over a month ago, the IMF sounded a fresh alarm on Canada’s housing market by saying that household debt is well above that of other countries. Meanwhile, seven in ten mortgage lenders in Canada have expressed “concerns” that the real estate sector is in a bubble that could burst at any time. Deutsch Bank estimates the market is 63% overvalued and readily offers seven reasons why Canada is in trouble. Even hedge funds are starting to find ways to short the market in anticipation of an upcoming collapse. Canada’s housing situation could give rise to the world’s next Steve Eisman, Eugene Xu, or Greg Lippmann.
On the opposing side of the ring, who will contend that the Canadian housing market is just different this time? Hint: look to the banks and government.
Stephen Harper, Canada’s Prime Minister, has tried to dispel fears. He recently told a business audience in New York that he didn’t anticipate any housing crisis in Canada.
Just this week, the Bank of Canada also tried its best to deflate housing bubble fears. “We don’t believe we’re in a bubble,” says Stephen Poloz, the Bank’s Governor. “Our housing construction has stayed very much in line with our estimates of demographic demand.”
Poloz suggested that housing costs do not necessarily have to contract to match the incomes of Canadians. Instead, he expects growth in the economy to raise wages and make housing more affordable.
Strangely enough, by the Bank of Canada’s own estimate, the housing market is overvalued by as much as 30%. It is hard for housing to become more affordable when prices are rising in double digits in a year. Combine this with the fact that household debt rates keep setting new records, and one side of the fight might get tilted sooner than later.


-
I know Mike is a very solid investor and respect his opinions very much. So if he says pay attention to this or that - I will.
~ Dale G.
-
I've started managing my own investments so view Michael's site as a one-stop shop from which to get information and perspectives.
~ Dave E.
-
Michael offers easy reading, honest, common sense information that anyone can use in a practical manner.
~ der_al.
-
A sane voice in a scrambled investment world.
~ Ed R.
Inside Edge Pro Contributors

Greg Weldon

Josef Schachter

Tyler Bollhorn

Ryan Irvine

Paul Beattie

Martin Straith

Patrick Ceresna

Mark Leibovit

James Thorne

Victor Adair