
Stocks & Equities
Investors Intelligence: “Despite the indexes still trading near record levels there was a further contraction in advisor optimism and even some new bear projections. While index highs could be retested medium term investors should be cautious after the recent lofty readings for the bulls.
The index selloff to lows on 6-May caused a new contraction for the bulls to 47.5%. It was 52.5% and 57.4% the prior two weeks. That latter reading almost hit historic danger levels suggesting many advisors were near fully invested. Bulls above 50% show elevated risk and that has persisted since Nov-14 with only a few weeks of exceptions.
Sentiment Chart
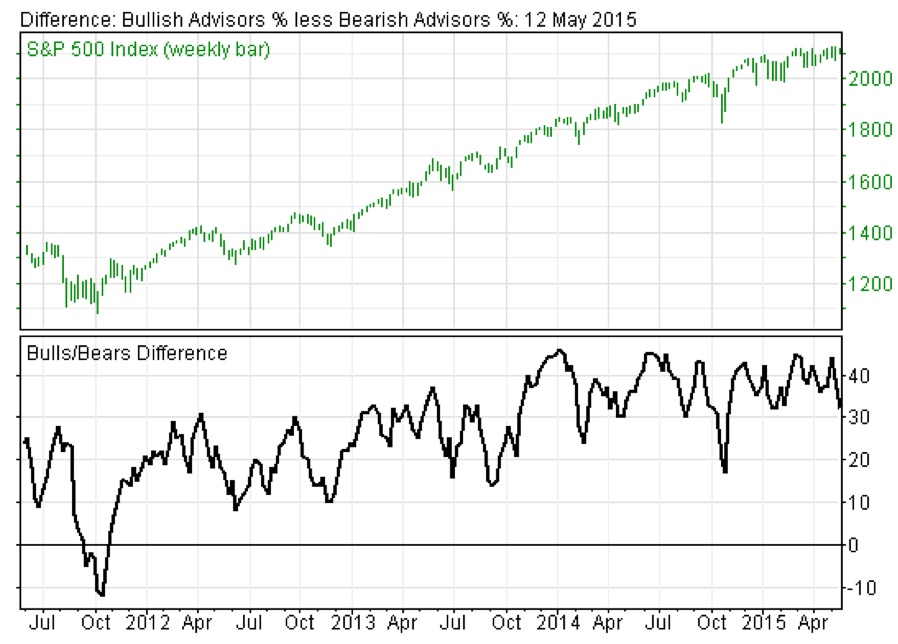
There was a small increase for the bears at 15.8%, up from the 2015 low a week ago at 13.9%.
The spread between the bulls and bears further contracted to 31.7%, down from 38.6% a week ago. It is also down 11.8% from the 43.5% difference before that, a dangerously high reading last seen late Feb. Differences over 30% are a worry and above 40% signal major caution. Bears haven’t outnumbered bulls (a negative spread) since Oct-2011. IMPORTANT – To subscribe to Investors Intelligence CLICK HERE.
***ALSO JUST RELEASED: Gerald Celente – This Historic Move By China Will Have Massive Global Ramifications CLICK HERE.

Is the debt bomb about to go off?
Editor’s note: You’ll find the text version of the story below the video.
The yields on U.S. Treasuries and European sovereign debt have risen sharply in a relative short time.
Bond prices trend inversely to yields — which means debt portfolios have suffered substantial losses.
From mid-April through May 6, yield on German 10-year bunds spiked 47 basis points. Yields on 10-year U.S. Treasuries jumped 29 basis points in just the past week.
Volatility in the bond market continued on May 7. In just a few hours, the yield on the 10-year bund jumped 21 basis points before pulling back. Bear in mind that sovereign bond yields rarely move more than a fraction of one percent in a day.
Long-term bonds have been hit particularly hard. The yield on 30-year U.S. Treasuries topped 3% for the first time this year.
“We’ve been hurt,” said [an] investment manager at Aberdeen Asset Management. “The movements of recent days have been extremely unusual ….” (Financial Times, May 7)
German government debt is regarded as a benchmark for European assets.
Take a look at this chart of Euro-Bund futures from our May 6 Financial Forecast Short Term Update:

Similar to the credit crisis in 2007-2009, the rout is starting in the bond market, where the pace of evaporating liquidity is quickening. Bids are pulled, prices crack, yields rise and it leaks out toward other asset classes. The turn in bonds in the U.S. and Europe is a sign that the “debt bomb” … is about to go boom.
The April Elliott Wave Financial Forecast warned subscribers about the insanity that pervades the world’s bond markets. Take a look at this chart and commentary:

Many bonds that are perceived to be the safest credit risks guarantee investors a loss. To our knowledge this has never occurred on such a widespread basis in the history of finance. Yields on nearly a third of the euro area’s $6 trillion of government bonds are below zero, which means that bond buyers are guaranteed to lose money if they buy these bonds and hold them to maturity.
The risk of widespread defaults also lurks in the world’s credit markets.
Here’s what well-known hedge fund manager Stanley Drunkenmiller recently said:
Back in 2006/2007, 28% of debt being issued was B-rated. Today 71% of the debt that’s been issued in the last two years is B-rated. So, not only have we issued a lot more debt, we’re doing so with much [lower standards].
All told, the world’s credit markets are on very unstable ground. Expect that ground to get even shakier in the months ahead.
This article was syndicated by Elliott Wave International and was originally published under the headline Big Volatility Shakes Bond Investors. EWI is the world’s largest market forecasting firm. Its staff of full-time analysts led by Chartered Market Technician Robert Prechter provides 24-hour-a-day market analysis to institutional and private investors around the world.

The dollar soars by a record amount versus the euro and the yen in 2014. And economists predict strong growth in 2015. Really? If a country can have a rapidly-appreciating currency with all the benefits that that confers, and strong economic growth with all the obvious advantages that thatconfers, why wouldn’t everyone be going for powerhouse currencies?
Because the two things, a strong currency and accelerating growth, tend to be mutually exclusive in the short run, with a strong currency acting like rising interest rates, slowing growth and making debts harder to service.
So it shouldn’t be a surprise that the latest batch of US numbers are somewhere between disappointing and catastrophic. First-quarter GDP was flat and is about to be revised negative. Retail sales were flat in April, the first month of the second quarter, with business inventories and import prices pointing in the same grind-to-a-halt direction.

The US is now looking at zero growth for the entire first half of 2015. Six years into a recovery, with record low interest rates and a recent doubling of govern ment debt, that’s a bit of a dilemma. Especially given the Fed’s threat to raise interest rates in the next few months.
Rates clearly are not going to be raised, at least not on purpose. On the contrary, slow growth always and everywhere leads panicked governments to break out the stimulus. And the dollar is reacting to this prospect exactly as one would expect, by falling like a stone in the past month.

Gold, meanwhile, is acting like the reciprocal of the dollar, adding $30 an ounce in the past two days.

At the risk of excess repetition, the US is obviously losing the currency war and will soon be forced into a new offensive. Negative interest rates, here we come.

We live in an age where bad economic news is not only unwelcome, but it is routinely overlooked or excused. On the other hand, good news is spotted and trumpeted even when it doesn’t exist. An ideal illustration of this dangerous tendency towards collective selectivity came last week when the markets and the media somehow turned an awful employment report into an ideal data set that confirmed all optimism and contained nothing but good news for investors. In truth, it was anything but.
The stakes were high with this year’s April non-farm payroll report. It was the first major employment report of the Second Quarter and it was hoped that it would show an economy bouncing back from a sluggish winter. But there was cause for concern. The March report had been an unmitigated disaster. Only 126,000 jobs were created when 247,000 were expected. Then, two lesser April employment reports had been released, the ADP private payroll data and the Challenger jobs cuts report that came in far below expectations (Challenger showed the biggest month over month increase in layoffs in three years). Even more harrowing was the recently released .2% annualized GDP in the First Quarter, a dismal April trade deficit, and the worst back to back monthly productivity reports in almost a decade. We needed good news, and we needed it bad.
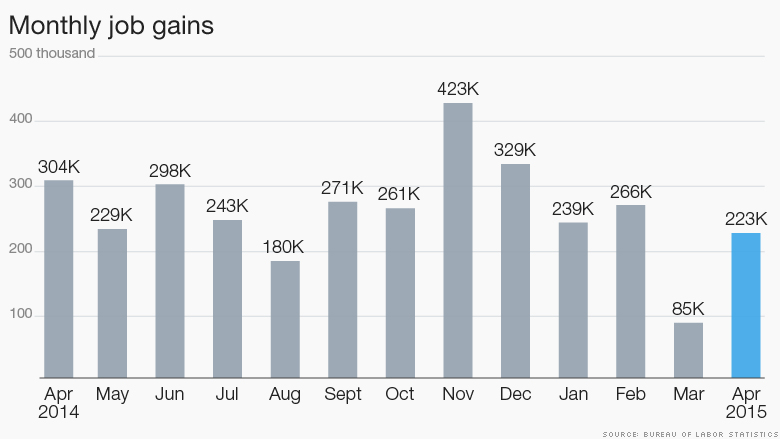
The April report’s headline was all most people needed to see before breathing a collective sigh of relief. 223,000 jobs were created during the month, which was a full 3,000 jobs more than the 220,000 that had been predicted by the consensus of economists. In addition, the unemployment rate held at a very low 5.4% (matching the consensus), the lowest number since the Market Crash of 2008. The steady rate, and the modest beat (of a modest expectation) were received like a strand of garlic to ward away evil spirits. Icing the cake was the understanding that the report was not so good that it would accelerate the Federal Reserve’s timetable to raise interest rates. As a result, it was termed a “Goldilocks” report, which many consider to be the best of all possible outcomes. But even a casual look beneath the surface should have thoroughly deflated the euphoria.
The biggest shock should have been the downward revision of the already weak March numbers, which most people had expected would be revised upwards. Instead, 41,000 jobs were cut from March, leaving only 85,000 hires for the month, making it the worst month in job creation in three years. If March and April were averaged, we would only have about 150,000 jobs per month, numbers that would be indicative of a very weak economy. And don’t forget, April may be revised down next month just as drastically as March.
As you dig down, it gets worse. Average hourly earnings only increased .1%, which was exactly half of the expected .2% increase. They also revised down March’s gain from .4% to .2%. The report showed that the number of Americans who have left the labor force has hit an all-time high of 93,149,000. But the most important set of ignored ugly data was the breakdown of full time vs. part time jobs.
As far as the headline number of job creation is concerned, all jobs are equal. No matter if they involve brain surgery or lawn mowing, or if they are full time or part time, a job is a job. But the April Household Survey, which is released in support of the Nonfarm Payrolls, showed an increase of 437,000 part-time jobs, the biggest gain in part-time employment since June of last year. At the same time, the number of full time jobs declined by 252,000, the biggest drop of the year. Instead of talking about these lost real jobs, we talk about net gain in the total number of jobs which was only made possible by the huge increase in part time jobs. It is safe to say that a great many of those who found part time jobs would have preferred something with more hours and more pay. These facts show how the types of jobs Americans are finding continue to deteriorate, and explains why wage growth has been so disappointing.
It’s also worth noting that up to 175,000 of the new jobs reported in April resulted from assumptions that government statisticians make using the birth/death model. This technique compensates for unknown business formation to assume that a certain number of businesses come into being when the economy is strong. And since the government assumes that the economy is currently strong, it assumes those jobs were created. How convenient.
Another disturbing aspect of the Household Survey is the demographic breakdown of who is working and who is not. In April, workers aged 55 and older gained 266,000 jobs, while workers aged 25-54 lost 19,000 jobs. These results should blow another hole in the theory, repeatedly espoused by Janet Yellen and others, that the labor participation rate is falling because of retiring baby boomers. If that were the case, then you would see the number of older workers going down, not going up. The people who should be retiring are instead taking part-time jobs to keep food on the table or to pay their electric bills. It’s the younger workers, in the prime of their earning potential and who need to be working, who are leaving the labor force in droves.
The fact that this dog of a report could be received like a beauty queen is a testament to how desperate and intellectually complacent Wall Street economists have become. In the days since the report was issued, data that confirms a strong spring rebound has yet to materialize. April retail sales and March business inventories were flat and below expectations. If analysts actually delved beneath the rosy headlines, they would not be surprised that debt-laden consumers, with part-time jobs facing rising costs of basic necessities, were too broke to shop.
The story was much different last spring, when the economy was rocketing upward after contracting in First Quarter. Yet the optimism for the full year surprisingly persists. Few major Wall Street firms have cut their full year GDP predictions below 2.0%, even though such sluggish growth seems more and more likely. The Fed itself has only backed off slightly from its 2.6%-3.0% “Central Tendency” 2015 growth forecast that it issued last December, and now sees full year growth from 2.3%-2.7%. That is already starting to look like wishful thinking. (See my previous commentary). But optimism is hard to kill. Maybe because that’s all we have?
Economic data from employment situation report Bureau of Labor Statistics
Best Selling author Peter Schiff is the CEO and Chief Global Strategist of Euro Pacific Capital. His podcasts are available on The Peter Schiff Channel on Youtube
Catch Peter’s latest thoughts on the U.S. and International markets in the Euro Pacific Capital Winter 2015 Global Investor Newsletter!

 We live in a period of staggering technological change. While society is being transformed by disruptive innovation during this transition, it will be your own individual adaptability that will determine if you are a winner or a loser.
Every 24 hours, there are approximately 4 million smartphones sold, 8 billion hits on YouTube, 700 million tweets, 130 million Instagram uploads, and over 200 million sent emails. There are now more iPhones sold every day than babies born, and the world has more than 3 billion internet users accessing 1.2 billion websites. Facebook alone has more than 1.3 billion users, which translates to a ratio of 1 in every 7 people of the word. In fact, if Facebook were its own country, by population, it would be the second largest…. CLICK HERE to read the complete article

-
I know Mike is a very solid investor and respect his opinions very much. So if he says pay attention to this or that - I will.
~ Dale G.
-
I've started managing my own investments so view Michael's site as a one-stop shop from which to get information and perspectives.
~ Dave E.
-
Michael offers easy reading, honest, common sense information that anyone can use in a practical manner.
~ der_al.
-
A sane voice in a scrambled investment world.
~ Ed R.
Inside Edge Pro Contributors

Greg Weldon

Josef Schachter

Tyler Bollhorn

Ryan Irvine

Paul Beattie

Martin Straith

Patrick Ceresna

Mark Leibovit

James Thorne

Victor Adair