
Gold & Precious Metals

14 May 2015/6:21 a.m. ET
We are seeing a dynamic relationship between German stocks, 2-year benchmark interest rates, and the currency—EUR/USD. The rise in short rates coincided nicely with a sell-off in stocks and a rise in the euro as you can see in the chart below:

This is not what ECB Governor Draghi had in mind when with quantitative easing. In fact, rising rates and a strong euro counters the effectiveness of QE and likely leads to portfolio flow from international stock funds out of the Eurozone—the real economy in Europe needs rising stocks as rising stocks are a huge repository of collateral value; that is the direct feed-back loop to the real economy.
Portfolio flow out of European stocks, money that was most likely hedged, i.e. short euro and long the US dollar, leads to the dynamic of pushing EUR/USD higher as the hedge is removed.
So, the key driver seems the 2-year benchmark yield—the blue line in the chart above (which given the recent relative juxtaposition of disappointing US economic news versus improving Eurozone news makes some sense at least relatively). What I am looking for is a corrective top in euro in the 1.1450-1.1532 level. We are close. I am looking for yield confirmation from Europe; but we have to consider the risk of continued relative US economic weakness could lead to some type of blow-off move in EUR/USD; ultimately planting the seeds of its own destruction, hyperbolically speaking. Stay tuned.
Jack Crooks
Black Swan Capital, LLC
Subscribe to Currency Currents

USDCAD Overnight Range 1.1935-1.2025
It was another stellar US Jobless Claims print (264k) which beat the forecast by 11,000 but nervous traders also noted the decline in PPI data and tempered their dollar buying enthusiasm. The Bank of Canada review is due later today and it would be a stretch to assume that it will be all sunshine and unicorns, which should provide some support to USDCAD. GBPCAD and EURCAD demand have also acted as a drag on USDCAD selling
Yesterday’s US Retail Sales report kicked the stuffing out of the US dollar but the New Zealand Retail Sales had the opposite effect during the Asia session. Kiwi retail Sales rose 2.7% vs expectations of 1.6% and the flightless bird grew wings. AUDUSD was dragged higher as well.
The European session was subdued with FX trading hampered by Ascension Day holiday’s in many countries.
Looking ahead, news that Iran is getting trigger happy and shooting at a Singapore flagged ship may lead to a re-think of some short term US dollar bearish bets and provide some support to the US dollar.
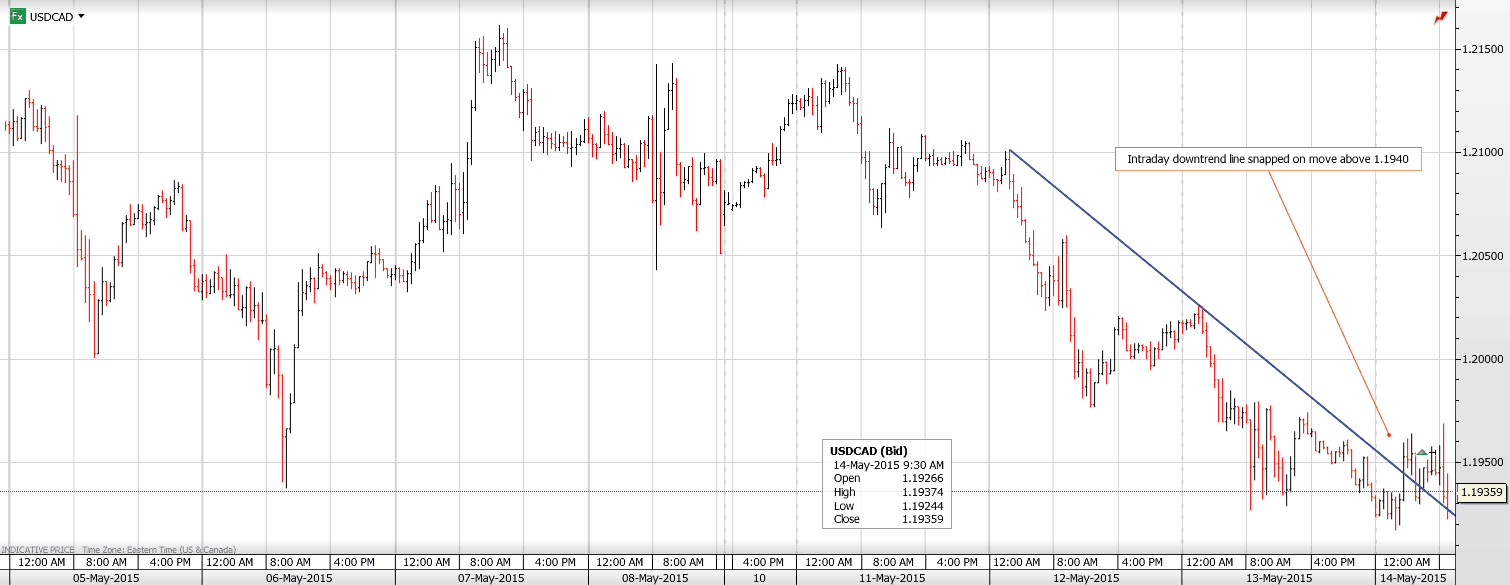
USDCAD technical outlook
The intraday USDCAD technicals are modestly bullish following the break of 1.1935, representing the downtrend line from Tuesday. Additional gains above 1.2020 will suggest that a short term bottom is in place. USDCAD selling below 1.1930 will target 1.1890 and then 1.1835. For today, USDCAD support is at 1.1930 and 1.1890. Resistance is at 1.1980 and 1.2020
Today’s Range 1.1930-1.1980
Chart: USDCAD 1 hour with downtrend


Every year the good folks at US Global Investors put together this simple and fantastic visualization on the annual returns for all commodities.
Frank Holmes, their CEO and Chief Investment Officer, has an in-depth post about it here on LinkedIn.
However, here is our quick summary of things we found interesting:
First, the two worst performers in 2014 were the two best performers the previous year: oil and natural gas. This speaks to the short-term volatility of commodities, as well to the fact that investors need to be looking to the long term. While something may swing up and down in a short time horizon, in the long term it may prove to fulfill the investment thesis based on supply and demand fundamentals.
Second, despite the sentiment for gold, it was actually the second best performing currency in the world in 2014. It was down -1.7% relative to the US Dollar, but denominated in other currencies it did quite well. In a year where many currencies (Russian Ruble, Argentine Peso, Swedish Krona, Japanese Yen, Euro, etc.) had double digit declines, this is very notable. Also, as we have learned from the recent unpegging of the Swiss Franc to the Euro, we have seen that even stalwart safe havens can be tampered with.
Last, as it has been noted by several pundits, silver got crushed in a year where gold did relatively well. Silver is much more volatile than gold and typically swings with it in the same direction, except with more velocity. This was untrue for 2014, but it could be an interesting thing to watch in 2015.
We would not be surprised to see silver gaining ground on gold to bring the gold/silver ratio to a more historically normal level.
The price of silver opens trading on Wednesday at a very key technical junction with a 4+ year downtrend in play. At the open of futures trading, the silver price is challenging, and now breaking above, a very significant technical level, around $16.80-$17 an ounce. (May 13, 2015 – 8:04am)

The break of this key technical resistance level is likely to fuel short-covering and momentum buyers which could be perfect scenario for the silver price to make a very significant price move in a very short order to the upside. If the silver price maintains $17+ an ounce here, we could very well see the price accelerate gains to the $20-25 level very quickly.
This event would be the first indication that the long-term downtrend in silver prices has ended and the next phase, either consolidation around the $20 area or the trigger for the reversal to $25+ above. We will be watching closely – click here to view the live silver price.


-
I know Mike is a very solid investor and respect his opinions very much. So if he says pay attention to this or that - I will.
~ Dale G.
-
I've started managing my own investments so view Michael's site as a one-stop shop from which to get information and perspectives.
~ Dave E.
-
Michael offers easy reading, honest, common sense information that anyone can use in a practical manner.
~ der_al.
-
A sane voice in a scrambled investment world.
~ Ed R.
Inside Edge Pro Contributors

Greg Weldon

Josef Schachter

Tyler Bollhorn

Ryan Irvine

Paul Beattie

Martin Straith

Patrick Ceresna

Mark Leibovit

James Thorne

Victor Adair